

Abstract
Background
RAS is dysregulated in neurofibromatosis type 1 (NF1) related plexiform neurofibromas (PNs). The activity of tipifarnib, which blocks RAS signaling by inhibiting its farnesylation, was tested in children and young adults with NF1 and progressive PNs.
Methods
Patients aged 3–25 years with NF1-related PNs and imaging evidence of tumor progression were randomized in a double-blinded fashion to receive tipifarnib (200 mg/m2 orally every 12 h) or placebo (phase A) and crossed over to the opposite treatment arm at the time of tumor progression (phase B). PN volumes were measured with MRI, and progression was defined as ≥20% volume increase. Time to progression (TTP) in phase A was the primary endpoint, and the trial was powered to detect whether tipifarnib doubled TTP compared with placebo. Toxicity, response, and quality of life were also monitored.
Results
Sixty-two patients were enrolled. Tipifarnib and placebo were well tolerated. On phase A, the median TTP was 10.6 months on the placebo arm and 19.2 months on the tipifarnib arm (P = .12; 1-sided). Quality of life improved significantly compared with baseline on the tipifarnib arm but not on the placebo arm. Volumetric tumor measurement detected tumor progression earlier than conventional 2-dimensional (WHO) and 1-dimensional (RECIST) methods.
Conclusions
Tipifarnib was well tolerated but did not significantly prolong TTP of PNs compared with placebo. The randomized, flexible crossover design and volumetric PN assessment provided a feasible and efficient means of assessing the efficacy of tipifarnib. The placebo arm serves as an historical control group for phase 2 single-arm trials directed at progressive PNs.
Keywords: neurofibromatosis type 1, phase 2 trial, plexiform neurofibroma, RAS signaling, trial design
See the editorial by Prados, on pages 617–618.
Neurofibromatosis type 1 (NF1) is a common (1 in 2 500 individuals), autosomal-dominant tumor predisposition syndrome that is associated with the development of tumors of the peripheral and central nervous systems.1 Plexiform neurofibromas (PNs) are complex, benign nerve sheath tumors that develop in 20%–40% of individuals with NF1.1,2 These NF1-related PNs may be congenital and grow slowly during childhood. PNs can cause substantial morbidity such as pain, neurologic dysfunction, and compression of vital structures2,3 and can be fatal. A subset of PNs undergo transformation to malignant peripheral nerve sheath tumors (MPNSTs), which are aggressive soft tissue sarcomas.4,5 The only standard treatment for PNs is surgery. However, the location, infiltrative nature, high vascularity, and size of PNs make surgical resection challenging, and complete surgical removal is usually not feasible.2,6–8
The NF1 gene product neurofibromin contains a domain with significant homology to RAS GTPase-activating proteins that regulate RAS activity. RAS is a GTPase that plays a central role in cell survival, proliferation, and differentiation by transducing responses to growth stimuli initiated by receptors on the cell surface to intracellular signaling molecules.9 Neurofibromin accelerates RAS-GTP hydrolysis to RAS-GDP and thus functions as a negative regulator of RAS. Lack of functional neurofibromin in NF1 leads to dysregulated RAS and tumorigenesis;10 inhibition of RAS activity is therefore a rational target for NF1-related tumors.11
Tipifarnib (R115777, Zarnestra) is an orally bioavailable, potent, and selective inhibitor of farnesyltransferase (FTase) that catalyzes the posttranslational farnesylation of a variety of cellular proteins including RAS, RHO-B, and RAC.12–14 FTase was identified as a target to block RAS signaling proteins, but the antiproliferative effects of tipifarnib and other FTase inhibitors in preclinical tumor models are not completely explained by inhibition of RAS signaling alone.15,16
In a phase 1 trial of tipifarnib performed in children with refractory solid tumors or NF1-related inoperable PNs, the maximum tolerated dose (MTD) was 200 mg/m2/dose every 12 h, daily × 21 days, repeated every 28 days.17 This pediatric MTD is equivalent to the recommended adult fixed dose of 300 mg on the same schedule for solid tumors.18,19 Dose-limiting toxicities of tipifarnib in children are myelosuppression, rash, and gastrointestinal toxicity, and the spectrum of toxicities is similar in children with solid tumors and NF1. At steady state in children receiving the MTD, FTase activity in peripheral blood mononuclear cells was inhibited by 70% relative to baseline. No objective responses (WHO criteria)20 were observed on the pediatric phase I trial, but participants with NF1 (n = 17) received a median of 10 (range, 1–32) 28-day treatment cycles without development of cumulative toxicity.
Tumor response is the traditional endpoint in phase 2 trials, but substantial shrinkage of PNs after treatment with tipifarnib was not felt to be a realistic therapeutic goal. PNs appear and grow to a large size primarily during early childhood,21 and controlling PN growth could prevent morbidity and mortality and potentially reduce the risk of malignant transformation to an MPNST. Therefore, time to progression (TTP), rather than response, was the primary endpoint used to assess the activity of tipifarnib on this phase 2 trial. The novel, randomized, double-blinded flexible crossover design ensured that all participants could receive tipifarnib and that tipifarnib was continued in each participant until objective evidence of tumor progression was documented. Participants were required to have evidence of PN growth prior to study entry, and PN growth during the study was monitored using sensitive tumor volume measurements,22 maximizing our ability to detect PN progression earlier and shortening the time to complete the trial. The design also provided a comparison of the acute and chronic toxicities from tipifarnib to placebo and assessed quality of life (QOL) on both arms. In addition, TTP using volumetric tumor measurements (3D)22 on MRI were compared with TTP using the conventional 1-dimensional (1D)23 and 2-dimensional (2D)20 solid-tumor measurement methods.
Materials and Methods
This trial (NCT00021541) was sponsored by the National Cancer Institute (NCI) Cancer Therapy Evaluation Program (CTEP), coordinated by the NCI Pediatric Oncology Branch, and included 10 participating sites, of which 7 enrolled participants.
Trial Design
The unknown natural history of PNs, their complex shape, and slow and potentially erratic growth2 imposed challenges for measuring a therapeutic effect from tipifarnib. A validated method22 of semiautomated 3D MRI analysis of PNs was used to sensitively measure changes in size of PNs on this trial.21,22 PN progression was defined as ≥20% increase in tumor volume compared with baseline. To determine whether tipifarnib prolongs TTP required a concurrent, untreated control population to assess the natural history of PNs. For these reasons, we developed a randomized, placebo-controlled, double-blinded, flexible crossover design to determine whether tipifarnib increases TTP in patients with progressive PNs.
Randomization Process
The random allocation sequence was randomly generated by a computer program (written in-house) that followed specifications created by the study statistician. To minimize chances of uncovering the future randomization sequence, the study statistician specified that the study start with a block size of 4 and then switch to block sizes of 2 after the first 16 participants were randomized. The randomization sequence was provided on a paper list only to the pharmacy, where the drug was prepared and delivered in a double-blinded fashion; neither the participant nor the treating physician was made aware of the treatment administered. Once the participant was registered into the trial via a central registration office, which verified eligibility, the central office notified the trial pharmacist, who selected the next randomly assigned slot on the list and assigned it as the treatment for that specific participant.
After central randomization to the tipifarnib arm or placebo arm, participants were followed on the first treatment (phase A) until PN progression, at which time they were crossed over to the other treatment arm (phase B) to receive the placebo if they originally received tipifarnib or tipifarnib if they originally received the placebo. Participants were monitored on the same schedule with 3D MRI until PN progression was documented on phase B, at which time they were removed from the study. The final MRI scan on phase A demonstrating PN progression was used as the baseline scan for phase B. The crossover ensured that all participants could receive tipifarnib, and crossing patients over to the other treatment arm only after PN progression was documented (rather than at a fixed time point) ensured that participants who benefitted from tipifarnib continued to receive the drug.
Patient Eligibility
Children and young adults ≥3 and ≤25 years with a clinical diagnosis of NF124 and unresectable, progressive PNs with the potential to cause significant morbidity3 were eligible if they met the criteria outlined in Table 1. Patients who underwent prior surgery for their progressive PNs were eligible provided the residual tumor was measurable. No prior medical therapy was required, as there is no standard medical treatment for PNs. This trial was approved by the Institutional Review Boards of the participating institutions. All patients or their legal guardians signed an informed consent indicating their understanding of the investigational nature and the risks of this study. Written assent was obtained from children aged 7–17 years.
Table 1.
Trial eligibility requirements
| Plexiform neurofibroma: | Measurable : ≥3 cm in one dimension |
| Progressive: ≥20% increase in PN volume, or ≥13% increase in 2-dimensional, or ≥ 6% increase in 1-dimensional measurement over last 2 consecutive MRI scans or within ∼1 year prior to trial evaluation | |
| Histologic confirmation not required in presence of consistent radiographic and clinical findings but to be performed if malignant transformation was considered | |
| Performance status: | ECOG 0–2 |
| Life expectancy ≥12 months | |
| Organ function: | Recovered from prior therapy to grade ≤1 toxicity |
| Hematologic function: | Absolute neutrophil count ≥1500/µL |
| Hemoglobin ≥9.0 g/dL | |
| Platelet count ≥150 000/µL | |
| Hepatic function: | Bilirubin within normal limits except for participants with Gilbert syndrome |
| Alanine aminotransferase ≤2-times the upper limit of normal | |
| Renal function: | Age-adjusted normal serum creatinine |
| Prior treatment, last dose of: | Colony stimulating factors ≥1 week |
| Radiation ≥6 weeks | |
| Chemotherapy ≥4 weeks | |
| Investigational agent >30 days | |
| MRI imaging: | Ability to undergo MRI evaluation of plexiform neurofibroma |
| Exclusion criteria: | Ongoing hormonal-, immuno-, or chemotherapy directed at PN |
| >1 prior myelosuppressive chemotherapy regimen | |
| Pregnancy or breastfeeding | |
| Significant systemic unrelated illness | |
| Presence of optic glioma, malignant glioma, malignant peripheral nerve sheath tumor, or other cancer requiring treatment with chemotherapy or radiation | |
| Inability to return for follow-up visits |
Dosing Schedule
Tipifarnib/placebo was supplied by CTEP as 50 mg tablets and administered orally at the pediatric solid tumor MTD (200 mg/m2/dose)17 after a meal every 12 h for 21 days followed by a 7-day rest period for 28-day treatment cycles. Each participant's dose was rounded to the nearest 50 mg using a dosing nomogram based on body surface area. The am and pm doses were identical. Tablets could be crushed for easier consumption in young children. At the time of crossover from phase A to phase B, there was a 2-week washout with no drug. Daily intake of tipifarnib/placebo was documented by participants or their guardians in drug diaries, which were reviewed with the medical team at the time of response evaluations.
Toxicity Grading and Dose Modifications for Toxicity
Adverse events were graded according to the NCI Common Toxicity Criteria version 2. Tipifarnib/placebo was held for grade 2 toxicities considered possibly, probably, or definitely related to tipifarnib treatment until resolution to grade ≤1. Tipifarnib/placebo was held until resolution of toxicity and subsequent dose reduction for recurrent grade 2 or for grade 3 or 4 drug-related toxicities. Tipifarnib/placebo was permanently discontinued for recurrent grade ≥2 toxicities after a dose reduction.
Potential effects of tipifarnib/placebo on growth were monitored by comparing annualized growth velocities and weight gain (increase in height or weight during phase A divided by duration of therapy in months, multiplied by 12) for placebo and tipifarnib-treated participants.
Study Evaluations on Phases A and B
Participants were monitored with history and physical examination including neurologic evaluation, complete blood count with differential, and serum electrolytes, creatinine, calcium, magnesium, phosphorus, alanine aminotransferase, bilirubin, prothrombin time, partial thromboplastin time, and fibrinogen every 2 weeks during cycles 1–3 and subsequently prior to every cycle. Urinalyses were performed prior to cycles 1, 4, 7, and 10 and then every 6 cycles. Ophthalmological examinations were performed prior to each treatment phase because dose-dependent lens opacities were observed in rats after prolonged administration of tipifarnib.12
Short T1-inversion recovery MRI of up to 3 most clinically relevant target PNs was performed for 3D analysis, as previously described,22 prior to the start of cycles 1, 4, 7, and 10 and then after every 6 cycles. All MRIs obtained were sent to the NCI for central response evaluation. A volume increase of ≥20% in at least one PN compared with baseline on phase A or phase B was defined as progressive disease. Response evaluations were also performed using standard solid tumor response criteria (RECIST and WHO criteria) for comparison to TTP based on the 3D analysis.
Parents of participants aged 6–18 years completed the Impact of Pediatric Illness (IPI) Scale25 about their child prior to the start of cycles 1, 4, 7, and 10 and then after every 6 cycles. The IPI Scale assesses QOL in 4 domains: adaptive behavior, emotional functioning, medical/physical status, and cognitive functioning. Responses to the 43 items are made on a 5-point Likert scale (1 to 5) ranging from “not at all” to “a lot.” Higher mean scores indicate better QOL.
Statistical Considerations
Comparison of TTP in participants receiving tipifarnib to participants receiving placebo during phase A was the primary analysis and was used to estimate the sample size. In the absence of historical data for TTP based on 3D PN measurements, we assumed that TTP for untreated PNs would be 6 months. Thirty participants per arm would be required to detect an increase in the median TTP on phase A of 6 months with placebo to 12 months with tipifarnib with 80% power and a 1-tailed alpha = 0.05. Kaplan–Meier analysis and log-rank statistics were used to compare TTP with tipifarnib and placebo. We chose a large effect size, as only a substantial, clinically meaningful increase in the TTP on tipifarnib would justify the chronic and prolonged administration of an experimental agent to this young population with histologically benign tumors.
As one measure of evaluating treatment effects in participants serving as their own control, we identified all participants who had at least doubling of the TTP on tipifarnib or placebo during phase A or B. In addition we performed a Kaplan–Meier analysis, placing all participants who received treatment with placebo into one curve and placing all those who received tipifarnib onto another curve, irrespective of the treatment phase. In this analysis, participants who received treatment in both phases are represented on both curves, and participants who received treatment only in phase A are represented once; thus the 2 curves can be presented for descriptive purposes but cannot be formally compared because of lack of independence.
Based on more recent findings describing more rapid PN growth in younger children as compared with older children21 and in nodular PN lesions,26 we also analyzed the effect of age and PN type on PN growth rates (percent change in volume per year). PN growth rates were analyzed using linear regression for each target PN to detect change in PN growth rate as a result of age, and paired results between phases (all participants who received treatment on both phase A and phase B) were compared using a 2-tailed Wilcoxon signed rank test. The growth rates of target PNs and of nodular PN lesions were also compared with a 2-tailed Wilcoxon signed rank test.
To evaluate for differences between the placebo and treatment arm at enrollment, a Cox model was constructed containing treatment arm, age, PN type (nodular vs typical), number of progressive PNs documented at enrollment, and number of PNs known at enrollment.
For the QOL analysis, parent total scores for participants on placebo were compared with scores for participants receiving tipifarnib on phase A over time. Repeated measures ANOVA were conducted with one between groups (treatment) and one within groups (time) factor. Post hoc analyses were done to further explore findings. Statistical tests were 2-tailed, and the alpha was set at 0.05.
This trial was monitored annually by the NCI Center for Cancer Research Data Safety and Monitoring Board. Trial data were unblinded 1 year after enrollment was complete and the last patient had been enrolled on the trial for 1 year.
Results
Patient Characteristics
Sixty-two participants enrolled in the trial. This included 2 participants who were found to be ineligible after enrollment due to a diagnosis of MPNST and had to be replaced. Characteristics of the 60 eligible patients are listed in Table 2. At enrollment, the median age and PN volume of participants randomized to the tipifarnib arm on phase A were slightly greater compared with participants on the placebo arm. The median volume of target PNs was 364 mL (range, 20.5–5 573 mL). Five participants, 3 on placebo and 2 on tipifarnib, had a distinct nodular lesion26 within a larger PN, which was chosen as the target lesion. Forty-three participants had an ECOG performance score of zero, and 48 had not received prior medical treatment for their PNs.
Table 2.
Clinical characteristics of 60 eligible participants on phase A
| Total | Placebo | Tipifarnib | |
|---|---|---|---|
| Participants enrolled (n) | 60 | 29 | 31 |
| Sex (M:F) | 35:25 | 14:15 | 21:10∞ |
| Age in years: Median (range) | 8.5 (3–21.5) | 8.2 (3–17.7) | 9.7 (3–21.5) |
| ECOG performance score | |||
| 0 | 45 | 24 | 21 |
| 1 | 13 | 4 | 9 |
| 2 | 2 | 1 | 1 |
| Plexiform neurofibromas (PNs) | |||
| Number of PNs observed | 96 | 52 | 44 |
| Number of target PNs* | 63 | 31 | 32 |
| Volume (mL): Median (range) | 364 (20.5–5 573) | 316 (39.6–4 896) | 572 (20.5–5 573)** |
| Location: target/observed | |||
| Neck & chest | 15/20 | 9/12 | 6/8 |
| Trunk & extremity | 12/18 | 3/7 | 9/11 |
| Pelvis | 10/12 | 6/7 | 4/5 |
| Face | 7/8 | 3/3 | 4/5 |
| Abdomen | 4/12 | 2/7 | 2/5 |
| Back | 7/14 | 3/8 | 4/6 |
| Head & neck | 7/8 | 4/5 | 3/3 |
| Extremity | 1/4 | 1/3 | 0/1 |
| Prior medical PN treatments | |||
| Yes/No | 12/48 | 4/25 | 8/28 |
| Methotrexate/vinblastine | 6 | 3 | 3 |
| Pirfenidone | 3 | 1 | 2 |
| Cis retinoic acid | 1 | – | 1 |
| Peginterferon alfa 2B | 1 | – | 1 |
| Thalidomide | 1 | – | 1 |
*The PN chosen for volumetric MRI analysis to determine time to progression.
**The PN volume was larger in participants randomized to tipifarnib compared with placebo (P = .09, exact Wilcoxon rank sum test).
∞There was no significant difference in sex by arm (P = .19 by Fisher' exact test).
Abbreviation: PN, plexiform neurofibroma.
Tipifarnib/Placebo Toxicity
Tipifarnib and placebo were well tolerated over multiple cycles on both treatment phases. With the exception of neutropenia and skin rash, which are known tipifarnib-related toxicities, adverse events were clinically indistinguishable from placebo. There was no statistically significant difference in tipifarnib (555 cycles) vs placebo (469 cycles) toxicity when considering the maximum toxicity grade per patient on phase A (p2 = 0.28 exact Cochran-Armitage trend test). No toxicities required unblinding. Most toxicities were low grade and observed with similar incidence and grade on the placebo and tipifarnib treatment arms (Table 3). Seven participants were removed permanently from treatment for reversible adverse events. Six participants receiving tipifarnib were removed from treatment for grade 3 (n = 1) or grade 4 (n = 1) neutropenia, grade 2 (n = 1) or grade 3 (n = 1) rash, grade 3 (n = 1) serum transaminase elevation, and grade 3 (n = 1) hallucination. One participant receiving placebo was removed from treatment for grade 3 neutropenia. This participant had a prior history of intermittent neutropenia. One participant, who developed grade 3 tipifarnib-related neutropenia, was able to tolerate tipifarnib at a reduced dose. No cumulative toxicities were observed.
Table 3.
Number of participants with possibly, probably, or definitively tipifarnib- or placebo-related toxicities (worst toxicity grade per patient) during all treatment cycles administered
| Phase A |
Phase B |
|||||||||||||||
|---|---|---|---|---|---|---|---|---|---|---|---|---|---|---|---|---|
| Tipifarnib (n = 31) 555 cycles |
Placebo (n = 29) 469 cycles |
Tipifarnib (n = 22) 319 cycles |
Placebo (n = 19) 410 cycles |
|||||||||||||
| Toxicity grade CTCv2 | 1 | 2 | 3 | 4 | 1 | 2 | 3 | 4 | 1 | 2 | 3 | 4 | 1 | 2 | 3 | 4 |
| Allergy/immunology | ||||||||||||||||
| Allergic reaction (rhinitis) | 1 | |||||||||||||||
| Blood/bone marrow | ||||||||||||||||
| Hemoglobin | 6 | 5 | 5 | 3 | ||||||||||||
| Neutropenia | 5 | 1 | 2 | 1 | 2 | 3 | 1 | |||||||||
| Platelets | 5 | 3 | 1 | 1 | ||||||||||||
| White blood count | 12 | 2 | 4 | 1 | 6 | 4 | ||||||||||
| Lymphopenia | 4 | 5 | 3 | 3 | ||||||||||||
| Leukopenia | 1 | 1 | ||||||||||||||
| Cardiovascular | ||||||||||||||||
| Hypertension | 1 | |||||||||||||||
| Chest pain | 1 | |||||||||||||||
| Edema | 1 | 1 | 1 | |||||||||||||
| Palpitations | 2 | |||||||||||||||
| Coagulation | ||||||||||||||||
| Prolonged PT | 9 | 11 | 8 | 6 | ||||||||||||
| Prolonged PTT | 10 | 9 | 8 | 7 | ||||||||||||
| Fibrinogen | 5 | 4 | 2 | 2 | 1 | 2 | ||||||||||
| Constitutional | ||||||||||||||||
| Fatigue | 6 | 4 | 1 | 2 | ||||||||||||
| Fever (no neutropenia) | 1 | 1 | 1 | 3 | 3 | 1 | ||||||||||
| Dermatology | ||||||||||||||||
| Alopecia | 1 | 2 | 1 | |||||||||||||
| Bruising | 1 | |||||||||||||||
| Flushing | 2 | 1 | ||||||||||||||
| Dry skin | 1 | 1 | ||||||||||||||
| Pruritus | 4 | 1 | 3 | |||||||||||||
| Rash | 2 | 2 | 4 | 3 | 3 | 1 | ||||||||||
| Pink eye | 1 | |||||||||||||||
| Gastrointestinal | ||||||||||||||||
| Anorexia | 6 | 2 | 1 | 2 | ||||||||||||
| Constipation | 3 | 2 | 1 | 2 | ||||||||||||
| Diarrhea | 8 | 1 | 10 | 1 | 8 | 5 | ||||||||||
| Nausea | 13 | 10 | 8 | 4 | 1 | |||||||||||
| Pharyngitis | 1 | 1 | ||||||||||||||
| Vomiting | 12 | 6 | 1 | 4 | 4 | 1 | 1 | |||||||||
| Hemorrhage | ||||||||||||||||
| Epistaxis | 1 | 1 | 2 | |||||||||||||
| Hematuria | 2 | 2 | ||||||||||||||
| Hepatic | ||||||||||||||||
| Increased bilirubin | 2 | 1 | 2 | |||||||||||||
| Hypoalbuminemia | 2 | 3 | 3 | 1 | ||||||||||||
| Bilirubin | 1 | 3 | ||||||||||||||
| Increased AST | 3 | 1 | 3 | 1 | 3 | 1 | 1 | |||||||||
| Increased ALT | 2 | 1 | 3 | 3 | 1 | 1 | ||||||||||
| Metabolic/laboratory | ||||||||||||||||
| Hyperkalemia | 4 | 3 | 4 | |||||||||||||
| Hyperglycemia | 3 | 1 | 1 | |||||||||||||
| Hypermagnesia | 3 | 4 | 2 | 1 | ||||||||||||
| Hypercalcemia | 1 | 1 | 1 | |||||||||||||
| Hypokalemia | 2 | 1 | 1 | |||||||||||||
| Hypoglycemia | 4 | 2 | 4 | |||||||||||||
| Hypomagnesemia | 2 | 1 | 1 | |||||||||||||
| Hyponatremia | 3 | 2 | 3 | 1 | ||||||||||||
| Hypocalcemia | 4 | 3 | 2 | 2 | ||||||||||||
| Hypophosphatemia | 1 | 2 | ||||||||||||||
| Bicarbonate | 6 | 6 | 5 | 4 | ||||||||||||
| Neurology | ||||||||||||||||
| Dizziness | 2 | |||||||||||||||
| Depression | 1 | 2 | 1 | |||||||||||||
| Insomnia | 1 | 2 | 1 | |||||||||||||
| Sensory neuropathy | 1 | 1 | 1 | |||||||||||||
| Pain | ||||||||||||||||
| Abdominal | 9 | 9 | 2 | 6 | 1 | |||||||||||
| Tumor pain/general | 1 | |||||||||||||||
| Headache | 3 | 5 | 8 | 1 | ||||||||||||
| Myalgia | 1 | |||||||||||||||
| Neck | 1 | |||||||||||||||
| Other | ||||||||||||||||
| Mood alteration/ anxiety/agitation | 2 | 2 | ||||||||||||||
| Cough | 3 | 3 | 2 | |||||||||||||
| Muscle weakness | 1 | |||||||||||||||
| Otalgia (earache) | 1 | |||||||||||||||
| Mouth dryness | 1 | |||||||||||||||
| Personality/behavior | 1 | |||||||||||||||
| Blurred vision | 1 | |||||||||||||||
| Taste disturbance | 1 | |||||||||||||||
| Seizure | 1 | |||||||||||||||
| Hallucinations | 1 | |||||||||||||||
| Weight loss | 2 | 2 | 1 | |||||||||||||
| Renal | ||||||||||||||||
| Creatinine | 1 | 2 | ||||||||||||||
| Dysuria | 1 | 1 | ||||||||||||||
| Urinary urgency | 1 | |||||||||||||||
| Proteinuria | 5 | 3 | 3 | |||||||||||||
Abbreviations: ALT, alanine aminotransferase; AST, aspartate aminotransferase; PT, prothrombin time: PTT, partial thromboplastin time.
At enrollment, participants randomized to receive placebo had a mean (standard deviation) height percentile for age of 27.2% (±23.8) and weight percentile for age of 37.4% (±28), compared with 25.9% (±29) and 42.5% (±34) for patients on tipifarnib, respectively. There were no differences in linear growth rate or weight gain for participants treated with tipifarnib versus placebo on phase A. Participants grew on average (standard deviation) 5.6 (±3.4) cm/year on placebo versus 4.8 (±3.6) cm/year on tipifarnib (P = .36), and gained 3.1 (±4.0) kg/year of weight on placebo versus 3.6 (±4.2) kg/year on tipifarnib (P = .51).
Time to Progression and Response
The trial status at the time of unblinding of the study by the NCI Data Safety and Monitoring Board is shown in Fig. 1A. Nine participants remained on study with stable disease, 4 on phase A (2 on placebo, 2 on tipifarnib) and 5 on phase B (3 on placebo, 2 on tipifarnib). Twenty-two participants had been removed from treatment after progression on both treatment phases. Thirteen participants were removed from the study for reasons other than progression by 3D MRI analysis on phase A, and 16 participants were removed prior to or during phase B, with the 2 most frequent reasons being withdrawal of consent and toxicity. Reasons provided for withdrawal of consent included “study fatigue” (n = 4), loss to follow-up (n = 2), and inability to return for follow-up visits, start of a different therapy directed at the PN, sense that current treatment was not working, and low adherence in one patient each. On phase A, only 5 of the 13 participants who were removed from treatment prior to disease progression were censored prior to reaching the median time to progression (2 on placebo and 3 on tipifarnib). One patient with severe spinal cord compression due to PN experienced clinical progression and death after 2 cycles of treatment.
Fig. 1.

(A) Trial status of eligible participants at the time of trial unblinding. (B) Progression-free survival on phase A. The median time to progression for tipifarnib (n = 31) was 19.2 months and for placebo (n = 29) 10.6 months (1-tailed P = .12). Participants who were removed from study for reasons other than progression had their follow-up censored at the times shown with tick marks. (C) Progression-free survival on phase B. The median time to progression for tipifarnib (n = 22) was 13.3 months and for placebo (n = 18) 14.5 months (1-tailed P = .14). Participants who were removed from the study for reasons other than progression had their follow-up censored at the times shown with tick marks. (D) Progression-free survival for all participants who received placebo or tipifarnib irrespective of the treatment phase. The median time to progression for placebo (n = 47) was 13.0 months and for tipifarnib (n = 53) 18.2 months. Forty participants are represented on both curves. Participants who were removed from the study for reasons other than progression had their follow-up censored at the times shown with tick marks.
The median time to progression on phase A was 19.2 month for tipifarnib (n = 31) and 10.6 months for placebo (n = 29), 1-tailed P = .12 (Fig. 1B). Tipifarnib thus did not achieve a doubling of the TTP. On phase B, the median TTP was 13.3 months for tipifarnib (n = 22) and 14.5 months for placebo (n = 18), 1-tailed P = .14 (Fig. 1C).
The paired comparison of TTP on phase A and phase B with participants serving as their own control demonstrated at least a doubling in the TTP on tipifarnib compared with placebo in 6 of 40 participants who received treatment on both phases. One of them received tipifarnib during phase A along with 5 during phase B. Three participants experienced at least a doubling in the TTP on placebo; all 3 received placebo on phase B and tipifarnib on phase A. The median time to progression for all participants who received placebo (n = 47) or tipifarnib (n = 53) irrespective of the treatment phase was 13.0 and 18.2 months, respectively (Fig. 1D). Forty participants received treatment with both placebo and tipifarnib and are therefore included on both curves. The curves depict very similar progression patterns over time for both agents for all participants who ever received each given agent.
PN growth rates were inversely related to age. PN growth rates demonstrated more rapid growth in younger participants (r = −0.45; P = .0005) (Fig. 2A and B). In the 40 participants who received treatment on both phase A and phase B, PN growth rates were significantly higher while participants were on phase A (30.9% median increase in PN volume per year) compared with phase B (18.5% median increase in PN volume per year) (P = .026). Nodular target lesions had a substantially faster growth rate (61.6% median increase in lesion volume per year) compared with other target PN (18.5% median increase in PN volume per year) (P = .0031).
Fig. 2.
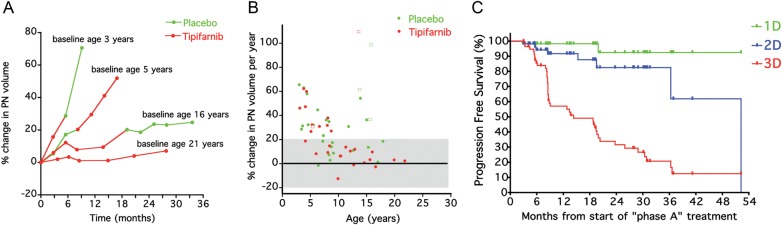
(A) Examples of plexiform neurofibroma growth rate on phase A and phase B in 4 participants. The plexiform neurofibroma growth rate appears constant within patients but variable among patients, and more rapid growth occurs in younger patients. (B) Percent change in target plexiform neurofibromas (circles) or target nodular lesions (squares) volumes per year on phase A for participants treated with tipifarnib or placebo. (C) Comparison of time to progression for 60 participants enrolled on phase A using 1D (RECIST, progression = ≥20% increase in sum of longest diameters), 2D (WHO, progression = ≥25% increase in sum of products of longest perpendicular diameters), and 3D criteria (progression = ≥20% increase in plexiform neurofibroma volume) used in this trial. Median time to progression was 14.3 months for 3D, 52.5 months for 2D, and was not reached for 1D analysis.
The Cox model containing treatment arm, age, PN type, number of progressive PNs documented at enrollment, and number of PNs known at enrollment demonstrated that treatment (P = .59) and number of progressive PNs documented at enrollment (P = .69) were not significant when jointly considered with the other 3 factors (each with P < .02). In a model removing the number of progressive PNs documented at enrollment, age, type of PN, and number of PNs known at enrollment remained significantly associated with time to progression on phase A (each P < .01), while the treatment arm was not associated with time to progression when adjusting for these factors (P = .58 in the presence of the other 3 factors).
The median TTP on phase A for all 60 participants (placebo and tipifarnib arms combined) was 14.3 months using 3D measurements with ≥20% increase in volume defined as progression. Using the conventional tumor response criteria (WHO and RECIST), the median TTP was 52.5 months for 2D measurements with ≥25% increase in area defined as progression, and a median TTP was not reached for 1D measurements with ≥20% increase in diameter defined as progression (Fig. 2C). At the time progression was determined by 3D analysis on phase A (n = 43), 10 participants met criteria for progressive disease based on 2D and 1 patient based on 1D response criteria.
No meaningful decrease in PN volumes was observed. The largest decrease in PN volume was 11% in one participant.
Quality of Life
For the 35 participants (placebo n = 18, tipifarnib n = 17; none with tumor progression through cycle 4) whose parents completed the IPI Scale at baseline and pre-cycle 4 on phase A, there was a significant group by time interaction (F (1,33) = 7.03; P = .012) in which the mean total scores were no different over time in the placebo group (3.70 to 3.68; F (1,17) = 0.19; P = .66) but increased significantly in the tipifarnib group (3.69–3.91; F (1,16) = 7.40; P = .015), indicating an early improvement in QOL on tipifarnib.
For the 28 participants (placebo n = 12, tipifarnib n = 16; 7 participants with progression after cycle 4) who remained on-study through both pre-cycle 4 and 10 on phase A and received follow-up QOL assessments, there was a significant main effect of time (F (1,26) = 7.00; P = .014) indicating an overall increase in mean total scores and a borderline time by group interaction (F (1,26) = 3.27; P = .082) suggesting slightly different trajectories for the 2 groups over time. Post hoc analyses on the separate groups found a nonsignificant change in mean scores in the placebo group (3.72 to 3.74 to 3.84; F (2,22) = 2.44; P = .11) and a significant increase in the mean scores of the tipifarnib group (3.69 to 3.90 to 3.84; F (2,30) = 3.96; P = .03) similar to the precycle 4 results.
Exploratory post hoc analyses of the parent IPI Scale domain scores from baseline to pre-cycle 4 found a significant interaction only in the domain of emotional functioning (F (1,33) = 7.75; P = .009), in which the mean domain scores over time were not different in the placebo group (3.63 to 3.64; F (1,17) = 0.00; P = .94) but increased significantly in the tipifarnib group (3.37–3.72; F (1,16) = 13.12; P = .002). Also, a borderline interaction was found in the subdomain of cognitive functioning (F (1,33) = 3.42; P = .07) with an upward nonsignificant trend in scores in the tipifarnib group (3.55 to 3.89; F (1,16) = 3.71; P = .07) but not in the placebo group (3.46 to 3.44; F (1,17) = 0.04; P = .83).
Discussion
The primary goal of this trial was to assess the activity of tipifarnib in children and young adults with NF1 and progressive PNs using TTP rather than response as the primary endpoint to assess activity. Although TTP on phase A was longer in participants randomized to the tipifarnib arm (19.2 months) compared with the placebo arm (10.6 months), the increase in TTP did not achieve the targeted 2-doubling increase compared with placebo, and the difference in TTP on the tipifarnib versus placebo arms was not statistically significant. In addition, the median TTP for all participants who received placebo (n = 47) or tipifarnib (n = 53), irrespective of the treatment phase, was similar with 13.0 months for placebo-treated and 18.2 months for tipifarnib-treated participants.
The goal of the treatment on this study was to block aberrant RAS signaling in NF1 PNs by inhibiting RAS farnesylation, which is a posttranslational modification required for RAS activity. Subsequent studies have shown K-RAS signaling to be critical in NF1-related tumors.27,28 Although tipifarnib effectively inhibits H-RAS farnesylation, N- and K-RAS can also undergo an alternate lipid modification (geranyl-geranylation), which circumvents the effect of inhibiting farnesyltransferase.29 Alternative drugs that block the RAS signaling pathway are available, and ongoing clinical trials for children and young adults with NF1 and PNs are evaluating agents that inhibit signal transduction proteins downstream of RAS including the multi-targeted tyrosine kinase inhibitor sorafenib,30 which inhibits RAF, and AZD6244 (NCT01362803), a specific MEK inhibitor.
An alternative explanation for the longer TTP on the tipifarnib arm on phase A could be the older age of participants randomized to receive tipifarnib on phase A. We have previously reported that PNs grow more rapidly in younger children compared with older children.21 While the ages did not differ significantly between the groups (P > .5), it is possible that the participants who received tipifarnib first (median age, 9.7 y) would have more slowly progressive tumors compared with participants randomized to receive placebo first (median age, 8.2 y). Our matched comparison of the TTP between phase A and phase B in participants serving as their own control supports this hypothesis. Eight of the 9 participants who experienced at least a doubling in the TTP on one of the treatment phases did so in phase B, when they were older. In addition, participants had more rapid PN growth rates on phase A compared with phase B (P = .026). Finally, PN growth rates were age dependent, demonstrating more rapid growth in younger participants (r = −0.45; P = .0005). Age stratification should therefore be considered for future clinical trials that use TTP as the primary endpoint.
Other factors to be considered for future trials include PN volume and presence of nodular target lesions. Participants randomized to receive tipifarnib on phase A had larger PN volumes compared with participants randomized to placebo (P = .09). More PN growth is required in these larger tumors to reach a 20% increase in PN volume, which may have contributed to the longer TTP for tipifarnib on phase A. Five participants were enrolled with progressive nodular target lesions arising within PNs, which were recently described to grow more rapidly compared with surrounding or adjacent PNs.26 We observed substantially faster growth rates of nodular target lesions compared with other target PNs on this trial (P = .0031). Nodular lesions may therefore have to be considered separately in future trials.
To be eligible for this trial, participants must have had evidence that their PNs were growing by 1D, 2D, or 3D MRI analysis during the 12 months or within the last 2 consecutive MRI scans preceding study enrollment. Limiting enrollment to participants with PNs that are progressing is critical to demonstrating a drug effect on PN growth. Monitoring PN volumes in this subset of participants with progressing PNs provides information about the natural history of PNs. The tumor growth curves from participants on this study and from our prior published study21 using volumetric tumor measurements demonstrate that the PN growth rate is relatively linear over months to years and that it is age dependent, with more rapid growth during early childhood (Fig. 2A and B). Therefore, treatment must focus on suppressing the growth of PNs before they reach a size that causes morbidity, rather than attempting to treat them after they have become clinically apparent or symptomatic. This pattern of PN growth primarily during childhood may mean that lifelong therapy to suppress PN growth may not be necessary.
The group of participants randomized to the placebo arm will serve as an historical control group for phase 2 trials of other new drugs for NF1-related PNs. Subsequent trials comparing TTP to this control arm must use the same eligibility criteria and specifically must require participants to have evidence of PN growth prior to enrollment and must recruit participants of a similar age range to ensure that the comparison is valid. Single-arm clinical trials of pirfenidone (NCT00076102), sirolimus (NCT00634270), and peginterferon-alfa-2b (NCT00396019) use the placebo phase A arm of this study as an historical control group.
TTP was measured using change in tumor volume estimated with a validated, semiautomated method to derive tumor volume from standard MRI scans.22 Serial volumetric tumor measurements are more sensitive for detecting tumor growth and progressive disease compared with the WHO and RECIST tumor measurement methods, as evidenced by the comparison of the 3 methods in Fig. 2C. The large size and complex, irregular shape of PNs make it difficult to consistently measure tumor diameters in serial scans, especially if the angle of the slices varies on the axial images. Varying slice angles have less impact on volumetric measurements, which use all images containing tumor to estimate the volume rather than taking measurements from a single slice (WHO, RECIST). Although volumetric measurements are more labor- and resource -intensive, requiring detailed quality assurance and central response evaluation, compared with tumor diameter measurements (RECIST), detecting tumor progression substantially earlier and completing the trial more rapidly justifies the use of change in PN volume as the primary endpoint. Volumetric MRI analysis in clinical trials for PNs limits time of exposure to potentially inactive or toxic agents and serves as the primary endpoint in many subsequent clinical trials directed at PNs.25,30–33
The QOL analyses on phase A demonstrated a significant early improvement in overall scores, as rated by parents at baseline and again at pre-cycle 4 for participants receiving tipifarnib but not placebo. Further examination found a significant increase in scores in the emotional domain and an upward nonsignificant trend in the cognitive domain in the treatment group only. Although the mechanism underlying this observation is not clear, the effect of tipifarnib on QOL, and in particular on emotional and cognitive functioning, is possible. Both animal34,35 and human36 studies have shown that various drugs that target the Ras/MAPK pathway, such as tipifarnib,37 may decrease depressive-like behavior35,36 and reverse learning and memory deficits.34,36 This biochemical pathway plays an important role in hippocampal neurogenesis, which is involved in learning and memory as well as the regulation of emotions38 and has been implicated in the cognitive and behavioral phenotype of NF1 and other related genetic disorders.39 In addition, similar improvements in the emotional and cognitive domains of QOL were found in a very small sample of children with NF1 in a clinical trial of sirolimus to treat PN.33 It is important to note that the current results should be interpreted with caution due to having both random missing data and participants who went off study before the pre-cycle 10 evaluation. However, having 2 separate studies that yield similar, although preliminary, findings, raises a hypothesis that should be investigated in future studies. Furthermore, the QOL data support that tipifarnib was well tolerated and did not have a negative effect on everyday functioning. Thus, the incorporation of patient-reported outcome measures into future trials may provide added value in determining the clinical benefit of therapies.40,41
The placebo-controlled, flexible crossover trial design allowed all participants to receive tipifarnib and to remain on the drug if they were potentially benefitting (ie, had no evidence of PN progression). The primary analysis compared TTP on tipifarnib with placebo on phase A, but we also planned to compare tipifarnib TTP with placebo TTP across phases A and B with each participant serving as his or her own control. However, withdrawal from study for reasons other than progression or toxicity increased over time, and only 22 of the 60 participants completed (progressed on) both phases of the study (Fig. 1A). Censoring prior to progression may thus have impacted this paired analysis, and our trial demonstrates the potential difficulty of long-term continuous administration of investigational agents for a non-life-threatening condition.
In conclusion, tipifarnib did not significantly prolong TTP of PNs compared with placebo. The randomized, flexible crossover design and volumetric PN assessment provided a sensitive and efficient means of assessing the efficacy of a new agent. Tipifarnib was well tolerated, which ensured that physicians and families were unable to determine whether patients were receiving drug or placebo. The placebo arm serves as an historical control group for phase 2 single arm trials in progressive PNs.
Acknowledgments
We thank the patients and their families who volunteered to participate in the trial for their commitment and adherence to the required on-study evaluations for the duration of the study. The views expressed do not necessarily represent views of the National Institutes of Health or the United States government.
Conflict of interest statement. None declared.
Funding
This research was supported (in part) by the Intramural Research Program of the National Institutes of Health, National Cancer Institute, Center for Cancer Research, and by a Clinical Trial Award (MIPR 1LCDN91152) from the Department of Defense.
References
- 1.Ferner RE, Huson SM, Thomas N, et al. Guidelines for the diagnosis and management of individuals with neurofibromatosis 1. J Med Genet. 2007;44(2):81–88. doi: 10.1136/jmg.2006.045906. [DOI] [PMC free article] [PubMed] [Google Scholar]
- 2.Korf BR. Plexiform neurofibromas. Am J Med Genet. 1999;89(1):31–37. doi: 10.1002/(sici)1096-8628(19990326)89:1<31::aid-ajmg7>3.0.co;2-w. [DOI] [PubMed] [Google Scholar]
- 3.Kim A, Gillespie A, Dombi E, et al. Characteristics of children enrolled in treatment trials for NF1-related plexiform neurofibromas. Neurology. 2009;73(16):1273–1279. doi: 10.1212/WNL.0b013e3181bd1326. [DOI] [PMC free article] [PubMed] [Google Scholar]
- 4.Evans DG, Baser ME, McGaughran J, et al. Malignant peripheral nerve sheath tumours in neurofibromatosis 1. J Med Genet. 2002;39(3):311–314. doi: 10.1136/jmg.39.5.311. [DOI] [PMC free article] [PubMed] [Google Scholar]
- 5.Ferner RE, Gutmann DH. International consensus statement on malignant peripheral nerve sheath tumors in neurofibromatosis. Cancer Res. 2002;62(5):1573–1577. [PubMed] [Google Scholar]
- 6.Canavese F, Krajbich JI. Resection of plexiform neurofibromas in children with neurofibromatosis type 1. J Pediatr Orthop. 2011;31(3):303–311. doi: 10.1097/BPO.0b013e31820cad77. [DOI] [PubMed] [Google Scholar]
- 7.Needle MN, Cnaan A, Dattilo J, et al. Prognostic signs in the surgical management of plexiform neurofibroma: the Children's Hospital of Philadelphia experience, 1974–1994. J Pediatr. 1997;131:678–682. doi: 10.1016/s0022-3476(97)70092-1. [DOI] [PubMed] [Google Scholar]
- 8.Prada CE, Rangwala FA, Martin LJ, et al. Pediatric plexiform neurofibromas: impact on morbidity and mortality in neurofibromatosis type 1. J Pediatr. 2012;160(3):461–467. doi: 10.1016/j.jpeds.2011.08.051. [DOI] [PubMed] [Google Scholar]
- 9.Satoh T, Kaziro Y. Ras in signal transduction. Cancer Biology. 1992;3(4):169–177. [PubMed] [Google Scholar]
- 10.Cichowski K, Jacks T. NF1 tumor suppressor gene function: narrowing the GAP. Cell. 2001;104(4):593–604. doi: 10.1016/s0092-8674(01)00245-8. [DOI] [PubMed] [Google Scholar]
- 11.Weiss B, Bollag G, Shannon K. Hyperactive Ras as a therapeutic target in neurofibromatosis type 1. Am J Med Genet. 1999;89(1):14–22. [PubMed] [Google Scholar]
- 12.End D. Farnesyl protein transferase inhibitors and other therapies targeting the Ras signal transduction pathway. Investigational New Drugs. 1999;17(1):241–258. doi: 10.1023/a:1006380320290. [DOI] [PubMed] [Google Scholar]
- 13.Karp JE, Lancet JE. Development of the farnesyltransferase inhibitor tipifarnib for therapy of hematologic malignancies. Future Oncol. 2005;1(6):719–731. doi: 10.2217/14796694.1.6.719. [DOI] [PubMed] [Google Scholar]
- 14.Sebti SM. Protein farnesylation: implications for normal physiology, malignant transformation, and cancer therapy. Cancer Cell. 2005;7(4):297–300. doi: 10.1016/j.ccr.2005.04.005. [DOI] [PubMed] [Google Scholar]
- 15.Crul M, de Klerk GJ, Beijnen JH, et al. Ras biochemistry and farnesyl transferase inhibitors: a literature survey. Anticancer Drugs. 2001;12(3):163–184. doi: 10.1097/00001813-200103000-00001. [DOI] [PubMed] [Google Scholar]
- 16.Doll RJ, Kirschmeier P, Bishop WR. Farnesyltransferase inhibitors as anticancer agents: critical crossroads. Curr Opin Drug Discov Devel. 2004;7(4):478–486. [PubMed] [Google Scholar]
- 17.Widemann BC, Salzer WL, Arceci RJ, et al. Phase I trial and pharmacokinetic study of the farnesyltransferase inhibitor tipifarnib in children with refractory solid tumors or neurofibromatosis type I and plexiform neurofibromas. J Clin Oncol. 2006;24(3):507–516. doi: 10.1200/JCO.2005.03.8638. [DOI] [PubMed] [Google Scholar]
- 18.Lara PN, Jr., Law LY, Wright JJ, et al. Intermittent dosing of the farnesyl transferase inhibitor tipifarnib (R115777) in advanced malignant solid tumors: a phase I California Cancer Consortium Trial. Anticancer Drugs. 2005;16(3):317–321. doi: 10.1097/00001813-200503000-00011. [DOI] [PubMed] [Google Scholar]
- 19.Punt CJ, van Maanen L, Bol CJ, et al. Phase I and pharmacokinetic study of the orally administered farnesyl transferase inhibitor R115777 in patients with advanced solid tumors. Anticancer Drugs. 2001;12(3):193–197. doi: 10.1097/00001813-200103000-00003. [DOI] [PubMed] [Google Scholar]
- 20.Miller AB, Hoogstraten B, Staquet M, et al. Reporting results of cancer treatment. Cancer. 1981;47(1):207–214. doi: 10.1002/1097-0142(19810101)47:1<207::aid-cncr2820470134>3.0.co;2-6. [DOI] [PubMed] [Google Scholar]
- 21.Dombi E, Solomon J, Gillespie AJ, et al. NF1 plexiform neurofibroma growth rate by volumetric MRI: relationship to age and body weight. Neurology. 2007;68(9):643–647. doi: 10.1212/01.wnl.0000250332.89420.e6. [DOI] [PubMed] [Google Scholar]
- 22.Solomon J, Warren K, Dombi E, et al. Automated detection and volume measurement of plexiform neurofibromas in neurofibromatosis 1 using magnetic resonance imaging. Comput Med Imaging Graph. 2004;28(5):257–265. doi: 10.1016/j.compmedimag.2004.03.002. [DOI] [PubMed] [Google Scholar]
- 23.Therasse P, Arbuck S, Eisenhauer E, et al. New guidelines to evaluate the response to treatment in solid tumors. J Natl Cancer Inst. 2000;92(3):205–216. doi: 10.1093/jnci/92.3.205. [DOI] [PubMed] [Google Scholar]
- 24.National Institutes of Health Consensus Development Conference Statement: neurofibromatosis. Bethesda, Md., USA, July 13–15, 1987. Neurofibromatosis. 1988;1(3):172–178. [PubMed]
- 25.Babovic-Vuksanovic D, Widemann BC, Dombi E, et al. Phase I trial of pirfenidone in children with neurofibromatosis 1 and plexiform neurofibromas. Pediatr Neurol. 2007;36(5):293–300. doi: 10.1016/j.pediatrneurol.2007.01.009. [DOI] [PubMed] [Google Scholar]
- 26.Meany H, Dombi E, Reynolds J, et al. 18-fluorodeoxyglucose-positron emission tomography (FDG-PET) evaluation of nodular lesions in patients with neurofibromatosis type 1 and plexiform neurofibromas (PN) or malignant peripheral nerve sheath tumors (MPNST) Pediatr Blood Cancer. 2013;60(1):59–64. doi: 10.1002/pbc.24212. [DOI] [PMC free article] [PubMed] [Google Scholar]
- 27.Dasgupta B, Yi Y, Chen DY, et al. Proteomic analysis reveals hyperactivation of the mammalian target of rapamycin pathway in neurofibromatosis 1-associated human and mouse brain tumors. Cancer Res. 2005;65(7):2755–2760. doi: 10.1158/0008-5472.CAN-04-4058. [DOI] [PubMed] [Google Scholar]
- 28.Khalaf WF, Yang FC, Chen S, et al. K-ras is critical for modulating multiple c-kit-mediated cellular functions in wild-type and Nf1+/- mast cells. J Immunol. 2007;178(4):2527–2534. doi: 10.4049/jimmunol.178.4.2527. [DOI] [PubMed] [Google Scholar]
- 29.Rowinsky E, Windle J, Von Hoff D. Ras protein farnesyltransferse: A strategic target for anticancer therapeutic development. J Clin Oncol. 1999;17(11):3631–3652. doi: 10.1200/JCO.1999.17.11.3631. [DOI] [PubMed] [Google Scholar]
- 30.Kim A, Dombi E, Tepas K, et al. Phase I trial and pharmacokinetic study of sorafenib in children with neurofibromatosis type I and plexiform neurofibromas. Pediatr Blood Cancer. 2013;60(3):396–401. doi: 10.1002/pbc.24281. [DOI] [PMC free article] [PubMed] [Google Scholar]
- 31.Jakacki RI, Dombi E, Potter DM, et al. Phase I trial of pegylated interferon-alpha-2b in young patients with plexiform neurofibromas. Neurology. 2011;76(3):265–272. doi: 10.1212/WNL.0b013e318207b031. [DOI] [PMC free article] [PubMed] [Google Scholar]
- 32.Robertson KA, Nalepa G, Yang FC, et al. Imatinib mesylate for plexiform neurofibromas in patients with neurofibromatosis type 1: a phase 2 trial. Lancet Oncol. 2012;13(12):1218–1224. doi: 10.1016/S1470-2045(12)70414-X. [DOI] [PMC free article] [PubMed] [Google Scholar]
- 33.Weiss B, Widemann B, Wolters PE, et al. Sirolimus for non-Progressive NF1-Associated Plexiform Neurofibromas: An NF Clinical Trials Consortium Phase II Study [published online ahead of print November 23, 2013] Pediatr Blood Cancer. doi: 10.1002/pbc.24873. 2013. doi:10.1002/pbc.24873. [DOI] [PubMed] [Google Scholar]
- 34.Costa RM, Federov NB, Kogan JH, et al. Mechanism for the learning deficits in a mouse model of neurofibromatosis type 1. Nature. 2002;415(6871):526–530. doi: 10.1038/nature711. [DOI] [PubMed] [Google Scholar]
- 35.Halloran J, Hussong SA, Burbank R, et al. Chronic inhibition of mammalian target of rapamycin by rapamycin modulates cognitive and non-cognitive components of behavior throughout lifespan in mice. Neuroscience. 2012;223:102–113. doi: 10.1016/j.neuroscience.2012.06.054. [DOI] [PMC free article] [PubMed] [Google Scholar]
- 36.Lang UE, Heger J, Willbring M, et al. Immunosuppression using the mammalian target of rapamycin (mTOR) inhibitor everolimus: pilot study shows significant cognitive and affective improvement. Transplant Proc. 2009;41(10):4285–4288. doi: 10.1016/j.transproceed.2009.08.050. [DOI] [PubMed] [Google Scholar]
- 37.Newton HB. Molecular neuro-oncology and development of targeted therapeutic strategies for brain tumors. Part 1: Growth factor and Ras signaling pathways. Expert Rev Anticancer Ther. 2003;3(5):595–614. doi: 10.1586/14737140.3.5.595. [DOI] [PubMed] [Google Scholar]
- 38.Lee E, Son H. Adult hippocampal neurogenesis and related neurotrophic factors. BMB Rep. 2009;42(5):239–244. doi: 10.5483/bmbrep.2009.42.5.239. [DOI] [PubMed] [Google Scholar]
- 39.Acosta MT, Bearden CE, Castellanos FX, et al. The Learning Disabilities Network (LeaDNet): using neurofibromatosis type 1 (NF1) as a paradigm for translational research. Am J Med Genet A. 2012;158A(9):2225–2232. doi: 10.1002/ajmg.a.35535. [DOI] [PMC free article] [PubMed] [Google Scholar]
- 40.Acquadro C, Berzon R, Dubois D, et al. Incorporating the patient's perspective into drug development and communication: an ad hoc task force report of the Patient-Reported Outcomes (PRO) Harmonization Group meeting at the Food and Drug Administration, February 16, 2001. Value Health. 2003;6(5):522–531. doi: 10.1046/j.1524-4733.2003.65309.x. [DOI] [PubMed] [Google Scholar]
- 41.Stevenson DA, Carey JC. Health-related quality of life measures in genetic disorders: an outcome variable for consideration in clinical trials. Am J Med Genet C Semin Med Genet. 2009;151C(3):255–260. doi: 10.1002/ajmg.c.30217. [DOI] [PMC free article] [PubMed] [Google Scholar]