

Abstract
Determining disease-associated changes in protein glycosylation provides a better understanding of pathogenesis. This work focuses on human immunoglobulin A1 (IgA1), where aberrant O-glycosylation plays a key role in the pathogenesis of IgA nephropathy (IgAN). Normal IgA1 hinge region carries 3 to 6 O-glycans consisting of N-acetylgalactosamine (GalNAc) and galactose (Gal); both sugars may be sialylated. In IgAN patients, some O-glycans on a fraction of IgA1 molecules are Gal-deficient. Here we describe a sample preparation protocol with optimized cysteine alkylation of a Gal-deficient polymeric IgA1 myeloma protein prior to in-gel digestion and analysis of the digest by MALDI-TOF/TOF mass spectrometry (MS). Following a novel strategy, IgA1 hinge-region O-glycopeptides were fractionated by reversed-phase liquid chromatography using a microgradient device and identified by MALDI-TOF/TOF tandem MS (MS/MS). The acquired MS/MS spectra were interpreted manually and by means of our own software. This allowed assigning up to six O-glycosylation sites and demonstration, for the first time, of the distribution of isomeric O-glycoforms having the same molecular mass, but a different glycosylation pattern. The most abundant Gal-deficient O-glycoforms were GalNAc4Gal3 and GalNAc5Gal4 with one Gal-deficient site and GalNAc5Gal3 and GalNAc4Gal2 with two Gal-deficient sites. The most frequent Gal-deficient sites were at Ser230 and/or Thr236.
Keywords: human immunoglobulin A1 (IgA1), IgA nephropathy, O-glycosylation, glycopeptides, mass spectrometry, microgradient separation
1. Introduction
Immunoglobulin A (IgA) is the most abundantly produced antibody with an important role in mucosal immunity. It occurs in two structurally and functionally distinctive subclasses IgA1 and IgA2 [1]. In contrast to IgA2, the hinge region (HR) of IgA1 (Fig. 1) contains two octapeptide repeats with multiple Pro, Ser, and Thr residues and 3 to 6 O-glycan chains [2–4]. IgA1 O-glycans consist of N-acetylgalactosamine (GalNAc) that may carry galactose (Gal) and/or sialic acid (Neu5Ac) giving rise to several different IgA1 O-glycoforms (Fig. 1) [5–9]. An abnormal glycosylation of serum immunoglobulins and other glycoproteins has been observed in several human diseases [10–15]. In 1968, IgA nephropathy (IgAN) was described as a clinical entity [16] and has been since recognized as the most common primary glomerulonephritis and an important cause of end-stage renal disease [17–19]. Although the precise mechanism of IgAN pathogenesis is still being elucidated, it clearly involves formation of immune complexes that contain IgA1 with Gal-deficient O-glycans [10,20]. IgAN is diagnosed based on evaluation of renal biopsy; no alternative noninvasive diagnostic method is currently available [21–23]. Patients with IgAN have elevated levels of circulatory IgA1 with Gal-deficient O-glycans; these molecules are bound in pathogenic immune complexes (for review see: [22,23]). Therefore, identification of the O-glycan composition of IgA1 is important for a deeper understanding of the disease mechanism, biomarker discovery and validation, and implementation and monitoring of disease-specific therapies [24].
Figure 1. Structure of human IgA1.
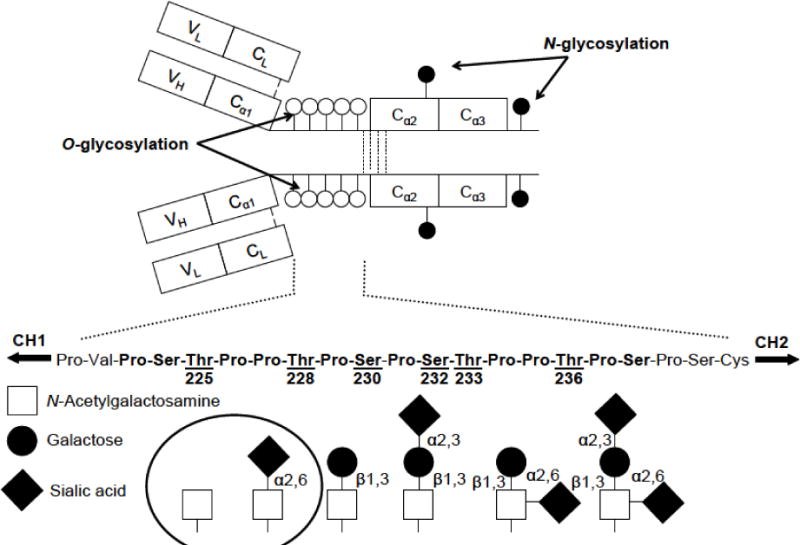
(a) Localization of O-glycosylation in the hinge region and N-glycosylation in the C-terminal constant region of the heavy chain. (b) Variants of O-glycans occurring in the hinge region of human circulatory IgA1. The circle highlights galactose-deficient O-glycans. The drawing was adopted from previous publications [3,6].
O-glycosylated isoforms from a single biological source show a distinct distribution of heterogeneity with respect to the number and structure of glycan chains [25]. Many methodological approaches have been employed for the analysis of aberrant O-glycosylation in IgA1 [26]. The Human Disease Glycomics/Proteome Initiative associated with the Human Proteome Organisation recently coordinated a multi-institutional study that evaluated methodologies with a wide use for defining N-glycan content in glycoproteins [27]. Such activities have also been extended to O-glycans [28]. These studies have shown that mass spectrometry (MS) is the most powerful tool for both identification and quantification of N- and O-glycans. The possibility of a precise assessment of mucin-type O-glycans has been successfully demonstrated using tandem mass spectrometry (MS/MS) with electron capture dissociation (ECD) or electron transfer dissociation (ETD) [6,25,29–31].
So far, two main strategies have been adopted to assess the heterogeneity of O-glycans in HR of IgA1: lectin binding assays ideally combined with monosaccharide compositional analysis [32–34] and MS analysis. Notably, only a few studies have shown a direct assignment of multiple sites of O-glycan attachment [3,6,25,29]. There have been several reports based on matrix assisted laser desorption/ionization time-of-flight mass spectrometry (MALDI-TOF MS) [7,35,36], but there is always a limitation in resolving power and mass accuracy. Every single O-glycoform of IgA1 represents a unique glycoprotein species with different abundance and possibly different biological role. Microscale solid-phase extraction methods have been used in proteomics for sample desalting, enrichment and fractionation. For that purpose, pipette tips with immobilized sorbents are used [37–39]. Another easy and economical approach for peptide fractionation involves a simple microgradient device for reversed-phase liquid chromatography (RPLC) coupled offline to MALDI-TOF MS [40].
In patients with IgAN, the O-glycosylation pattern includes Gal-deficiency but it is not fully understood whether and how it occurs at specific sites [24]. MS analysis of IgA1 O-glycosylation is complicated especially for two reasons. First, the O-glycosylation pattern of HR is rather complex. Secondly, the tryptic peptide containing HR is relatively large (38 amino acids) and thus the molecular mass of the corresponding O-glycopeptides usually exceeds 5 kDa. Recently, both glycan distribution and specific native sites of Gal deficiency for the major O-glycoforms within a single sample were elucidated by RPLC coupled to Fourier transform ion cyclotron resonance (FT-ICR) MS with ECD and ETD fragmentation. The sample was digested by a combination of trypsin and IgA1-specific proteases to obtain shorter glycopeptides [6].
In this study, a polymeric IgA1 (pIgA1) myeloma protein [20] was used that mimics Gal-deficient IgA1 in IgAN. We developed a novel experimental approach with optimized sample preparation, SDS-PAGE, in-gel tryptic digestion of the heavy chain of IgA1, RPLC separation of the obtained peptide mixture (using a simple microgradient device), and MALDI-TOF/TOF MS and MS/MS analyses of O-glycopeptides. The most important steps were both reduction/alkylation of the protein and RPLC separation of peptides. MALDI-TOF/TOF MS detected HR peptides with up to six O-glycans and the subsequent MS/MS analyses determined the sites of occupancy for most of them. Our data are consistent with recent results obtained using RPLC coupled online to FT MS [3]. The main advantage of the present approach is in its simplicity, robustness, low cost, speed and reliability. The biological significance of this work resides in the demonstration of the distribution of HR glycopeptide isoforms having the same molecular mass, but a different O-glycosylation pattern (site-specific microheterogeneity).
2. Materials and methods
2.1. Chemicals and materials
High-quality solvents for liquid chromatography/MS and MALDI matrices were from Sigma-Aldrich Chemie (Steinheim, Germany). POROS Oligo R3 50 μm particles were obtained from PerSeptive Biosystems (Framingham, MA, USA) and packed into GELoader pipette tips (Eppendorf, Hamburg, Germany). Polyimide-coated fused silica capillaries (360 μm o. d., 200 μm i. d.; and 360 μm o. d., 50 μm i. d.) were purchased from Agilent Technologies (Santa Clara, USA), AQ-C8 5 μm particles and AQ-C18 5 μm particles for laboratory filled columns were purchased from Dr. Maisch GmbH (Ammerbuch, Germany). A microtight union (5/16–24, 360 μm o.d., cat. no. P-772) was obtained from UpChurch Scientific (Oak Harbor, USA), fluorinated ethylene propylene (FEP) tubing (1/16″ × 0.25mm i.d.) was from Vici AG International (Schenkon, Switzerland).
2.2. Gal-deficient IgA1, cysteine alkylation, SDS-PAGE, and in-gel digestion
pIgA1 myeloma protein (Ale) was purified as described previously [6]. This myleoma protein has almost no sialic acid on the HR O-glycans. An aliquot (10 μl) of pIgA1 (Ale), 0.9 mg ml−1, was mixed with 4 μl of 10 mM dithiothreitol (DTT) in 100 mM NH4HCO3. The mixture was incubated at 56 °C for 30 min. The reduced pIgA1 was then alkylated in the dark for 30 min by the addition of 2.5 μl of 50 mM iodoacetamide (IAM) in 100 mM NH4HCO3. After the carbamidomethylation, the sample solution was mixed in a volume ratio of 1:1 with 2x concentrated Laemmli sample buffer containing 200 mM DTT. Then the resulting excess of the reducing agent was quenched by adding 9 µl of 1 M IAM. Aliquots of this mixture (10.5 μl) were loaded on the top of a manually prepared discontinuous polyacrylamide gel slab (4% T/3.3%C stacking gel; 10% T/3.3% C resolving gel); 100 mm × 100 mm × 1 mm in size. SDS-PAGE was performed by a standard method [41]. The separated antibody chains were visualized by Bio-Safe™ Coomassie Stain (Bio-Rad, Hercules, CA, USA). In-gel digestion of the heavy chain by trypsin was conducted using a previous protocol [42].
2.3. On-tip desalting and fractionation of digests
For desalting of tryptic digests, GELoader tips filled with POROS Oligo R3 50 μm particles were used [37]. The outlet of a GELoader tip was carefully squeezed with a Combi Tip syringe (Eppendorf, Hamburg, Germany) on flat surface and then 1 μl of POROS Oligo R3 suspension in acetonitrile (ACN) was loaded into the GELoader tip. The tip content was wetted with 10 μl 80% ACN/0.1% TFA (v/v) and equilibrated with 10 μl 2% ACN/0.1% TFA (v/v). A digest sample (40 μl) acidified with 5% (v/v) TFA (using a volume ratio of acid to sample of 1:10) was passed through the equilibrated tip and washed with 10 μl 2% ACN/0.1% TFA (v/v). Elution was achieved with 10 μl of 60% ACN/0.1% TFA (v/v), the eluate evaporated in a vacuum centrifuge and dissolved in 50 μl of 0.1% (v/v) TFA. Fractionation was done by a sequential elution of the retained sample using 12%, 24% and 35% ACN/0.1% TFA solutions (v/v; 10 μl each). The fraction containing HR O-glycopeptides (24% ACN/0.1% TFA) was subjected to MALDI-TOF/TOF MS for both O-glycopeptide profiling and estimating the relative abundance of O-glycoforms based on the isotope cluster area.
2.4. Preparation of capillary columns and RPLC separation using simple microgradient device
Capillary columns were prepared as previously described [43], except that two stationary phases were selected: either AQ-C8, 5 μm, for filling up precolumns or AQ-C18, 5 μm, for analytical columns. A simple microgradient device was then used for RPLC separation of O-glycopeptide fractions from tryptic digests (Supplementary Fig. 1). It consisted of a syringe infusion pump (Harvard Apparatus, Holliston, MA, USA) with a 100-μl microsyringe (SGE, Melbourne, Australia) connected to a 250 mm long capillary (360 μm o. d., 200 μm i. d.) using a piece of FEP tubing [43]. The capillary was connected to a home-made C8 precolumn (50 mm) through a 360-μm microtight union. The precolumn was finally connected using a second 360 μm microtight union to a home-made C18 analytical column (75 mm). The whole system was first wetted with 40 μl of 80% ACN/0.1% TFA (v/v) and then equilibrated with 40 μl of 2% ACN/0.1% TFA (v/v) after aspiration of the appropriate solvent into the microsyringe through capillary disconnected from the precolumn. Desalted sample (dried and dissolved in 50 μl 0.1% TFA, v/v) was aspirated into the syringe and loaded on the precolumn disconnected from the analytical column just for the sample loading process. The sample-loaded precolumn was then washed (40 μl 2% ACN/0.1% TFA, v/v) and connected back to the analytical column. Prior to sample separation, the microsyringe with connecting capillary was filled consecutively by four ACN–0.1% TFA (v/v) mobile phases with gradually decreasing ACN content (30% ACN/0.1% TFA – 40 μl, 20% ACN/0.1% TFA – 10 μl, 10% ACN/0.1% TFA – 10 μl, 2% ACN/0.1% TFA – 18 μl). An S-shaped gradient of mobile phase was formed inside the microsyringe as a result of the turbulent mixing of solvents during aspiration [44]. Finally the microsyringe (with the attached capillary) placed in the syringe infusion pump was connected to the precolumn (that was further connected to analytical column) and separation was started. The flow rate was 2 μl min−1 during sample loading and 0.8 μl min−1 in all other cases. Eluate drops from the analytical column were manually deposited in 20-s intervals (~0.3 μl) on MALDI targets 22 min after separation had started. Immediately after eluate drop deposition, 0.5 μl of α-cyano-4-hydroxycinnamic acid (CHCA) as a MALDI matrix, 5 mg ml−1 in 60% ACN/1 mM diammonium hydrogen citrate, was added for crystallization.
2.5. MS and MS/MS analyses
MALDI-TOF/TOF MS and MS/MS analyses were performed in the positive mode on an ABI 4800 Proteomics Analyzer (Applied Biosystems, Framingham, MA, USA) equipped with a neodymium-doped: yttrium aluminum garnet laser (355 nm) of 3–7 ns pulse and 200-Hz firing rate. Both MS and MS/MS spectra were acquired using a dual-stage reflectron mirror. Accelerating voltages applied for MS and MS/MS measurements were 20 kV and 8 kV, respectively. In MS/MS mode, a potential of 1 kV was applied and fragmentation was achieved by post-source decay [45]. The matrix composition is provided above. A mixture of six standard peptides was used for external calibration. MS and MS/MS data were processed using 4000 Series Explorer (Applied Biosystems) and further manually interpreted using Data Explorer 4.8 (Applied Biosystems) software. The following parameters were set up for estimating the relative abundance of O-glycoforms: Integration Baseline Settings: Valley to Baseline; Peak Detection Settings: %Centroid – 50, S/N Threshold – 6, Noise Window Width (m/z) – 250, Recalculate S/N from Cluster Area – Yes, Threshold after S/N Recalculation – 12, Spectrum Resolution – 10000 for m/z 1000, 16000 for m/z 2000, 13000 for m/z 3000 and 13000 for m/z 6500.
2.6. Software inspection of MS/MS spectra of O-glycopeptides
A home-made software BIOSPEAN (generated by M. Raus at Palacký University in Olomouc for intact cell/spore MS purposes) was used for a rapid inspection of the acquired MS/MS spectra. The software is a web program application and will be published separately. BIOSPEAN utilizes Linux as an operating system on the physical server, Apache as a web server software, MySQL as a database engine and PHP as a scripting language. BIOSPEAN allows detection of peaks in a mass spectrum and is able to evaluate its similarity with other spectra when searching over a spectral database. The principle of peak detection resides in a local scanning of intensity values around a particular m/z position taking the level of noise into consideration by adjusting signal-to-noise (S/N) ratio. The score value (expressed as a percentage) for a comparison of an inspected spectrum with another spectrum is derived from the number of identical peak positions found (assigned with an adjustable mass tolerance with the corresponding penalization) divided by the total number of detected peaks in the inspected spectrum. The two spectra may optionally be compared also in the opposite way and the score values obtained are then averaged.
3. Results
3.1. Subject of the study and experimental strategy
The following amino-acid residues in the HR of human IgA1 have been identified as the predominant sites of O-glycan attachment: Thr225, Thr228, Ser230, Ser232, Thr233 and Thr236 (Fig. 1) [3,6]. The range of O-glycosylation (3 to 6 O-glycans attached to 9 possible sites) and the composition of O-glycans at each binding site result in a complex heterogeneity of human IgA1. To elucidate this heterogeneity, it is necessary to include analyses of structural isomers of HR that occur based on the alternative location of O-glycans and their chemical composition. These requirements present a great challenge for current separation and detection methods. In this work, analysis of IgA O-glycan heterogeneity involved five steps: (1) optimal reduction/alkylation of a pIgA1 sample; (2) SDS-PAGE for the separation of the heavy chain of pIgA1; (3) in-gel tryptic digestion of the heavy chain; (4) fractionation and separation of the digest containing IgA HR O-glycopeptides using a simple microgradient device; (5) analysis of the separated O-glycopeptides by MALDI-TOF/TOF MS and PSD-MALDI-TOF/TOF MS/MS.
3.2. Preparation of IgA1 HR O-glycopeptides
Prior to the separation of heavy chain of pIgA1 by SDS-PAGE, the protein was reduced by DTT and the free cysteine thiol groups were then modified by IAM. After SDS-PAGE, the heavy chain was in-gel digested with trypsin (no further reduction/alkylation is needed during the procedure), generating HR glycopeptides of the following amino-acid sequence: HYTNPSQDVTVPCPVPSTPPTPSPSTPPTPSPSCCHPR. This fragment contains 13 Pro, 6 Thr, 6 Ser, and 3 Cys residues; Thr and Ser may be O-glycosylated. Quantitative in-solution cysteine reduction and alkylation by IAM was a crucial step for the optimal detection of O-glycopeptides by MALDI-TOF/TOF MS. Fig. 2 illustrates the effect of cysteine alkylation by IAM on the intensity of IgA1 HR O-glycopeptides in a set of typical mass spectra. Our data show that alkylating the sample just prior to the electrophoresis results in abundant HR O-glycopeptide ions in MALDI-TOF/TOF MS. The next step involved desalting or pre-fractionation of the tryptic digest. The resultant sample was either used for a profiling of IgA1 HR O-glycopeptides and estimation of relative abundance of individual isoforms (after pre-fractionation) or it was subjected to RPLC fractionation by a microgradient device (after desalting). Fractions containing IgA1 HR O-glycopeptides were then analyzed by MALDI-TOF/TOF MS and MS/MS.
Figure 2. The influence of sample alkylation on the intensity ofO-glycopeptide peaks in mass spectra.
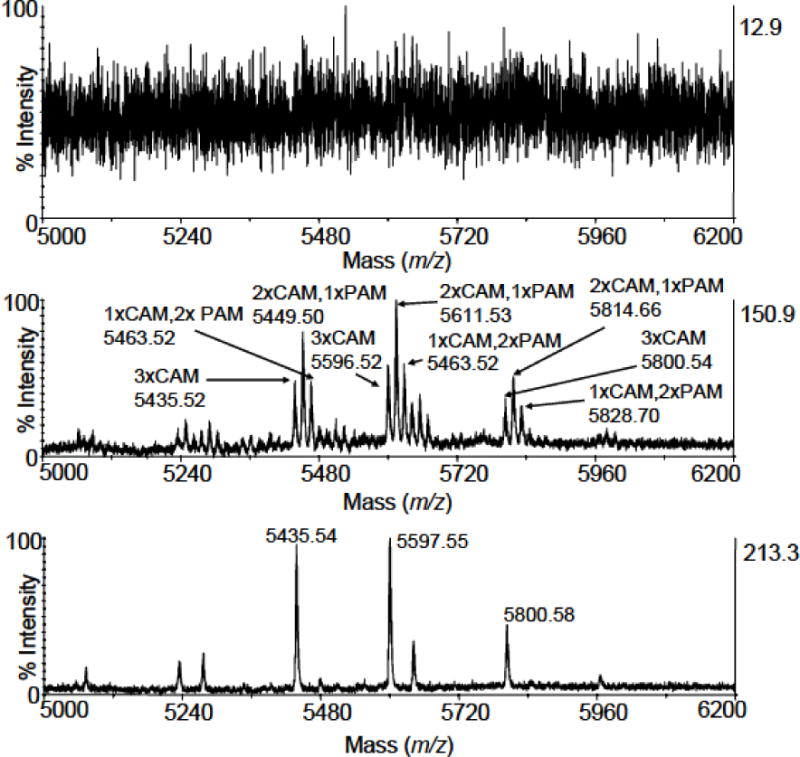
a) a MALDI-TOF mass spectrum (m/z region of 5000 – 6200) of a tryptic digest of pIgA1 (Ale) heavy chain (the reduction/alkylation step was performed after SDS-PAGE), which was acquired without any prior desalting of the sample; b) a MALDI-TOF mass spectrum (m/z region of 5000 – 6200) of the same tryptic digest (the reduction/alkylation step was performed after SDS-PAGE) acquired after involving the desalting procedure on POROS Oligo R3; c) a MALDI-TOF mass spectrum (m/z region of 5000 – 6200) of the same tryptic digest (the reduction/alkylation step was performed both prior to and after SDS-PAGE) acquired after involving the desalting procedure on POROS Oligo R3. Besides the necessity of desalting, a complete alkylation of cysteine residues is crucial for obtaining the highest possible intensity of O-glycopeptide peaks. All MALDI-TOF/TOF mass spectra were acquired on 4800 Proteomics Analyzer operating in the reflectron mode for positive ions. CHCA was used as a matrix. The abbreviations CAM and PAM stand for carbamidomethylation and propionamidation of cysteine, respectively.
3.3. Profiling and relative quantification of IgA1 HR O-glycopeptides
O-glycopeptide profiling was achieved after pre-fractionation of pIgA1 heavy-chain tryptic digests on GELoader tips filled with POROS Oligo R3 50-μm particles. A fraction containing HR O-glycopeptides (eluted in 24% ACN/0.1% TFA) was analyzed by MALDI-TOF/TOF instrument and MS profiles were acquired for estimating the relative abundance of O-glycoforms (Fig. 3). The estimation was based on processing isotope cluster areas for O-glycopeptides from 15 MS profiles obtained from 5 independent tryptic digests (each sample was analyzed in 3 replicates). All spectra were processed by the software Data Explorer (Applied Biosystems). The most abundant O-glycoform was HR containing 4 GalNAc and 4 Gal residues (designated as 4–4), whereas the most abundant Gal-deficient O-glycoforms were two variants, 4–3 and 5–4, with one Gal-deficiency and 5–3 and 4–2 with two Gal-deficient sites (Table 1). Notably, HR O-glycoforms with a single Gal-deficiency were more abundant than those with two Gal residues missing.
Figure 3. MALDI-TOF/TOF MS profile ofO-glycopeptides from tryptic digest of pIgA1 (Ale).
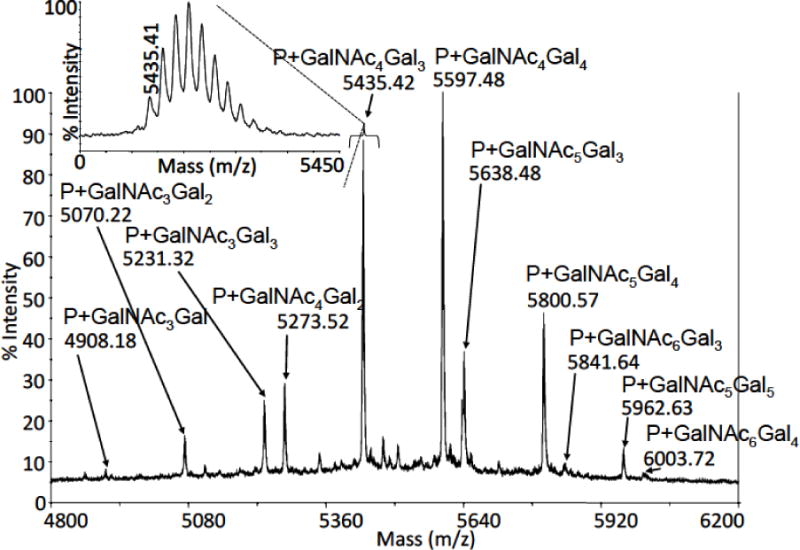
A mass spectrum of O-glycopeptides is shown, which was acquired after pre-fractionation of pIgA1 heavy-chain tryptic digest on a GELoader tip filled with POROS Oligo R3 50-μm particles. The inset demonstrates the resolution level, which was achieved during MS measurements (for m/z 5435, a resolution value of 9100 was observed). The symbol “P” represents the HR tryptic peptide.
Table 1. O-glycopeptides deduced from MALDI-TOF/TOF mass spectra of pIgA1 digest.
All O-glycopeptides were deduced based on mass calculations considering the presence of the HR tryptic peptide 208-HYTNPSQDVTVPCPVPSTPPTPSPSTPPTPSPSCCHPR-245.
| Glycan structurea | Experimental massb (Da) | Calculated massb (Da) | Mass difference (Da) | Relative abundancec (%) ± S.D. |
|---|---|---|---|---|
| GalNAc6Gal5 | 6165.94 | 6165.63 | −0.31 | – |
| GalNAc6Gal4 | 6003.84 | 6003.58 | −0.26 | – |
| GalNAc5Gal5 | 5962.84 | 5962.55 | −0.29 | – |
| GalNAc5Gal4 | 5800.85 | 5800.50 | −0.35 | 13.92 ± 2.87 |
| GalNAc5Gal3 | 5638.68 | 5638.45 | −0.23 | 10.16 ± 1.57 |
| GalNAc4Gal4 | 5597.70 | 5597.42 | −0.28 | 35.50 ± 3.83 |
| GalNAc4Gal3 | 5435.60 | 5435.37 | −0.23 | 32.21 ± 3.30 |
| GalNAc4Gal2 | 5273.51 | 5273.31 | −0.20 | 4.90 ± 2.94 |
| GalNAc4Gal1 | 5111.45 | 5111.26 | −0.19 | – |
| (GalNAc4)b | 4950.54 | 4949.21 | −1.33 | – |
| GalNAc3Gal3 | 5232.50 | 5232.29 | −0.21 | 3.27 ± 2.86 |
| GalNAc3Gal2 | 5070.40 | 5070.23 | −0.17 | – |
| GalNAc3Gal1 | 4908.32 | 4908.18 | −0.14 | – |
| (GalNAc3) | 4746.37 | 4746.13 | −0.24 | – |
| GalNAc2Gal2 | 4867.30 | 4867.15 | −0.15 | – |
| (GalNAc2Gal1) | 4705.35 | 4705.10 | −0.25 | – |
| (GalNAc2) | 4543.26 | 4543.05 | −0.21 | – |
| GalNAcGal | 4502.29 | 4502.02 | −0.27 | – |
| (GalNAc1) | 4340.18 | 4339.97 | −0.21 | – |
| Naked peptide | 4137.06 | 4136.89 | −0.17 | – |
Parentheses indicate those O-glycopeptides, where high-quality MS/MS spectra could not be acquired
Monoisotopic mass, [M+H]+
Estimated from the isotope cluster area. The total area of the most abundant O-glycopeptide peaks was set at 100%.
3.4. RPLC separation of IgA1 HR O-glycopeptides and their MS/MS analysis
To detect most HR O-glycopeptides, an aliquot of an in-gel tryptic digest of pIgA1 heavy chain (from about 15 μg total IgA) was desalted on GELoader tips with POROS Oligo R3 50 μm particles. The purified sample was reconstituted in 0.1%TFA and separated by RPLC in the C18 capillary column attached to the microgradient device. Eluted fractions were collected in 20-s intervals (fraction volume of ~ 0.3 μl), directly spotted on a MALDI target, and immediately overlaid with 0.5 μl of CHCA matrix solution. MALDI-TOF/TOF MS analysis of all spotted fractions revealed the presence of 19 unambiguous HR O-glycopeptide ion peaks in 15 fractions (Supplementary Fig. 2), and 15 of them were selected as precursors for the subsequent MS/MS.
MS/MS data were essential for assigning the sites of O-glycan attachment in pIgA1 (Ale). Fig. 4a displays an MS/MS spectrum acquired for a tryptic O-glycopeptide with precursor m/z of 5638.7 [HR+ 5 GalNAc + 3 Gal + H]+. During interpretation of MS/MS spectra, characteristic y-series fragment ions (marked by arrows in Fig. 4) allowed confirmation or exclusion of O-glycan chains at particular sites. In Fig. 4a, from the C-terminus, the y9 ion at a theoretical molecular mass calculated from the sequence excludes the presence of O-glycans at Ser238 and Ser240. The y12 ion, which is shifted by 203 Da when compared with its expected mass, indicates the presence of GalNAc at Thr236. However, interpretation of the spectra is complicated by the presence of another y12 ion, without GalNAc at Thr 236. This would suggest the existence of two isomeric 5–3 O-glycoforms, where the second isoform has a GalNAc residue attached at Thr233. Alternatively, this could be a y12 ion that has lost its GalNAc due to the presence of a [M-GalNAc + H]+ in the spectra. However based on previous reports of the utility of PSD-MALDI-TOF MS/MS in localizing sites of O-glycosylation [46] and previous reports of isomers existing between Thr233 and Thr236 [3], the fragmentation peaks in this MS/MS spectra would appear to represent true isomers. In similar fashion, all O-glycosylation sites were identified. The y15 ion confirms a disaccharide binding at Ser232, the y17 ion indicates a monosaccharide at Ser230, while the y20 and y21 ions prove a disaccharide at Thr228 and Thr225, respectively. Larger y ions, e.g., y27, support an interpretation that no carbohydrates are present at the other potential sites of O-glycan attachment (Ser224, Thr217, Ser213 and Thr210).
Figure 4. Positive ion MALDI-TOF/TOF MS/MS spectra of pIgA1 (Ale) HRO-glycopeptides.
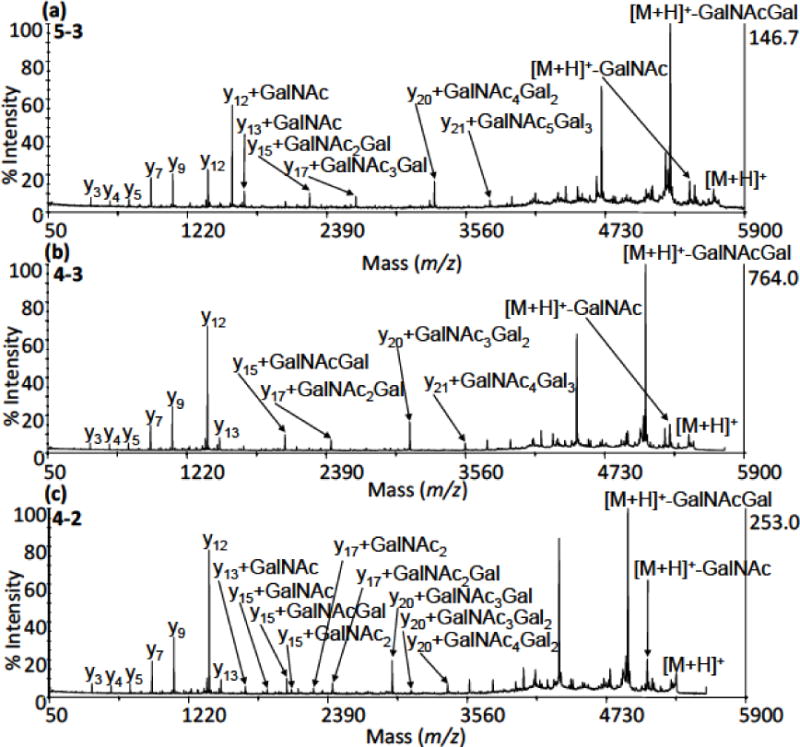
Three selected MS/MS spectra are shown, which were acquired for tryptic O-glycopeptides with precursor m/z of 5638.7 [HR+ 5 GalNAc + 3 Gal + H]+ (a), 5435.6 [HR + 4 GalNAc + 3 Gal + H]+ (b) and 5273.5 [HR + 4 GalNAc + 2 Gal + H]+ (c). In several instances, ambiguous fragments suggested the presences of isomeric IgA1 O-glycoforms. The measurements were carried out on the ABI 4800 Proteomics Analyzer operating in the reflectron mode for positive ions; CHCA was used as a matrix. Note that the signal intensity of the precursor ion [M+H]+ was reduced in the spectra as the function “Metastable Suppresor” was active on the instrument. This means that after PSD fragmentation of a precursor ion in the collision cell and subsequent reacceleration of all ions (mostly non-fragmented), the remaining precursor ion becomes deflected from the second TOF analyzer to prevent both detector saturation and metastable fragmentation of the precursor ion prior to the reflectron.
Figs. 4b and 4c show PSD-MALDI TOF/TOF MS/MS spectra for precursor ions with m/z of 5435.6 [HR + 4 GalNAc + 3 Gal + H]+ and m/z of 5273.5 [HR + 4 GalNAc + 2 Gal + H]+, respectively. Again, there were multiple y-series fragments that allowed identification of occupied O-glycosylation sites. However, the analysis of isomeric O-glycoforms for these and other HR glycoforms was much more complicated with multiple fragment ions that could be assigned to several different possible combinations of GalNAc-Gal and GalNAc attachments. To assess these various PSD-MALDI fragment possibilities arising from the same precursor mass, a computational approach was developed, as described in the section 3.5 below. All MS/MS spectra referring to the O-glycoforms listed in Table 1 are provided in Supplementary Fig. 3.
3.5. Defining overall microheterogeneity of IgA1 HR O-glycans
The MS/MS data revealed a very complex heterogeneity for most pIgA1 (Ale) O-glycosylation sites (Thr225, Thr228, Ser230, Ser232, Thr233 and Thr236), in agreement with previous publication that used LC-FT MS/MS approach to study O-glycosylation in pIgA (Mce1) myeloma protein and serum IgA1 [3]. For the most common HR O-glycoforms of pIgA1 (Ale), the overall microheterogeneity is shown in Fig 5. The sites at Thr225, Thr228 and Ser232 are each modified predominantly with a GalNAcGal disaccharide. However, we observed a glycopeptide population, where Thr225 is not occupied by a carbohydrate. Moreover, Ser230 and Thr236 are the dominant sites of Gal-deficiency on this IgA1 myeloma protein. Based on the estimation of abundance using areas under the peaks, the two glycoforms (5–3, 4–3) with unambiguous monosaccharide assigned at Ser230 represent a substantial part of the studied sample (see Table 1) and match the previous analysis of this IgA1 myeloma protein by use of ECD MS/MS [6].
Figure 5. O-glycoforms of pIgA1 (Ale) that were deduced from manual inspection of MS/MS spectra of tryptic O-glycopeptides.
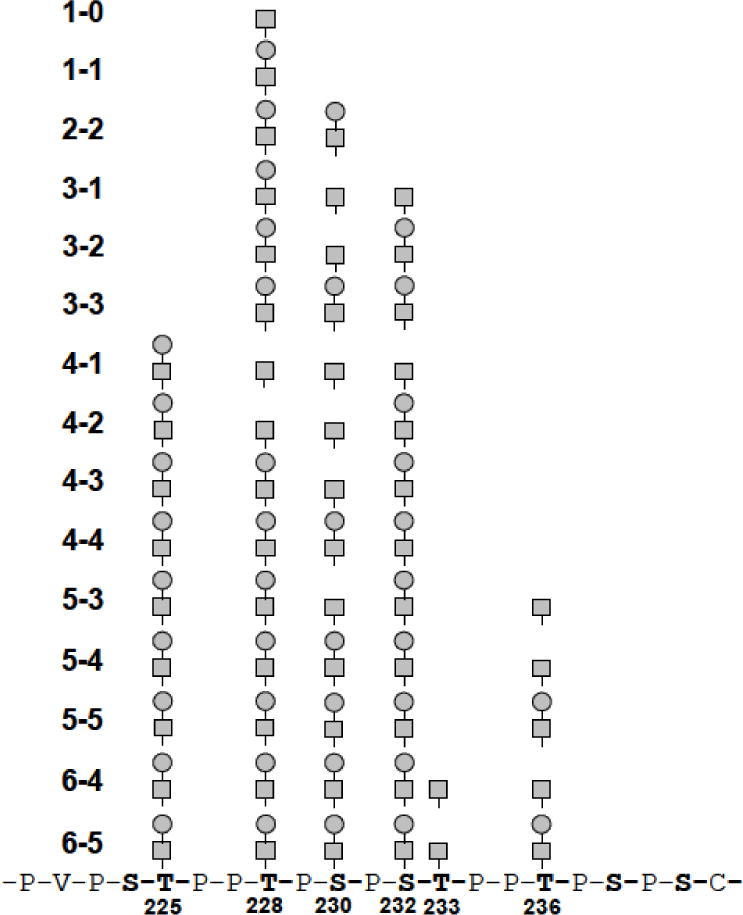
The HR tryptic peptide 208-HYTNPSQDVTVPCPVPSTPPTPSPSTPPTPSPSCCHPR-245 carrying O-glycosylation is shown only in part (underlined) for clarity. Three of the 15 IgA1 O-glycoforms that underwent PSD-MALDI TOF/TOF MS/MS fragmentation are shown in Fig. 4. The MS/MS data for remaining 12 glycoforms are provided in Supplementary Fig. 3.
The complete set of MS/MS spectra (see in Supplementary Fig. 3) showed a notable feature: in addition to the intense y-series fragments that allowed direct assigning of the binding sites of O-glycans with a high probability, there were additional fragment ions in the MS/MS spectra, which complicated unambiguous elucidation. Based on the previously documented [3] and now confirmed existence of six O-glycosylation sites in the HR of IgA1 (see above) and the assumption that there are three to six GalNAc residues with or without Gal, one could consider multiple potential combinations. Moreover, a possible presence of numerous isomeric O-glycoforms and the potential for some loss of sugar residues off of individual fragments complicate the interpretation and straightforward conclusions.
To tackle this problem, we used a computational approach with the idea that there is a group of typical y-series fragment ions, which allow assigning of individual O-glycosylation sites (y12, y13, y15, y17, y20 and y21). A computer script was written to generate all possible O-glycoforms covering the level of O-glycosylation from 3–1 up to 6–5 (Fig. 5). The number of combinations was 262 at the given setup, providing the same number of virtual MS/MS spectra comprising all typical fragment peaks, which may occur when considering that each of the O-glycosylation sites in an isomeric form may carry no carbohydrate, GalNAc, or GalNAc-Gal.
Twelve selected experimental MS/MS spectra were individually compared with the set of virtual spectra using the software BIOSPEAN. The agreement level in every single comparison was assessed by a score value derived from the number of overlapping peaks (considering a preset mass tolerance of 0.5 Da) with a S/N ratio of 3:1 for peak picking; see Materials and methods. Using another script, a large matrix of score values (262 rows × 12 columns) was generated, as shown on example in Table 2. For isomeric O-glycopeptide forms, the combinations showing a score value above 80 (green and yellow color in Table 2) would be considered as highly probable (under a condition that there is an agreement in precursor ion mass between the experimental and virtual spectrum). However, we cannot exclude the presence of other isoforms, with lower but still high enough score values (e.g., around 60–70). By decreasing S/N ratio, the number of matching pairs increases. Supplementary Table shows a complete data set obtained with a S/N of 2.25:1. Fig. 6 summarizes the isomeric species which scored high in our method for the most abundant Gal-deficient O-glycoforms (see Table 1). There were 2 isomeric species identified for each of the O-glycoforms 5–4 and 5–3 (for the latter case, compare with Fig. 4a). Three isomeric molecules were implicated for the O-glycoform 4–3 and evidence of six possible isomers were found in the PSD-MALDI MS/MS for the O-glycoform 4–2. Still, in the absence of separation, these identifications are based on interpretations of PSD-MALDI-TOF/TOF MS/MS spectra and would need further confirmation by higher resolution methods for LC separation and MS resolution or by use of standards of HR isomeric glycoforms. However, based on previous reports of isomeric IgA1 HR O-glycoforms, our custom matching of theoretical and observed MS/MS spectra provides targeted series of possible isomers that could be present in a ranked order.
Table 2. An excerpt from software calculation results for assigning MS/MS spectra to O-glycoforms.
Peak lists from individual experimental spectra were searched against a database of virtual spectra generated by the program BIOSPEAN using theoretical masses of y-series fragments reflecting particular O-glycoforms. Numbers in the first column refer to the virtual spectra and indicate the presence of GalNAc-Gal (2), GalNAc (1) and no sugar (0) at the following glycosylation sites: Thr225, Thr228, Ser230, Ser232, Thr233 and Thr236 (in the order given); the total numbers of GalNAc and Gal residues for each virtual spectrum are provided in the second and third column, respectively. Experimental spectra are labeled with GalNAc-Gal codes (i.e., 3–1, 3–2 etc.) reflecting precursor-ion masses. Score values reflect the number of identical peak positions a color coding differentiates similarity levels. Green color represents the highest agreement, followed by yellow, orange, blue and white (in a descending way).
| Virtual specra | Score values for individual experimental spectra | |||||||||||||
|---|---|---|---|---|---|---|---|---|---|---|---|---|---|---|
| Isoform code | GalNAc | Gal | 3–1 | 3–2 | 3–3 | 4–1 | 4–2 | 4–3 | 4–4 | 5–3 | 5–4 | 5–5 | 6–4 | 6–5 |
| 2.1.1.2.0.0 | 4 | 2 | 42.86 | 71.43 | 57.14 | 51.43 | 100 | 82.86 | 65.71 | 42.86 | 28.57 | 28.57 | 28.57 | 0 |
| 2.1.1.2.0.2 | 5 | 3 | 14.29 | 14.29 | 14.29 | 14.29 | 14.29 | 14.29 | 14.29 | 40 | 65.71 | 57.14 | 28.57 | 14.29 |
| 2.1.1.2.2.0 | 5 | 3 | 28.57 | 28.57 | 28.57 | 28.57 | 28.57 | 28.57 | 28.57 | 54.29 | 65.71 | 57.14 | 28.57 | 0 |
| 2.1.1.2.2.2 | 6 | 4 | 14.29 | 22.86 | 14.29 | 20 | 14.29 | 14.29 | 14.29 | 14.29 | 28.57 | 28.57 | 42.86 | 14.29 |
| 2.1.2.0.0.0 | 3 | 2 | 28.57 | 62.86 | 42.86 | 42.86 | 42.86 | 54.29 | 42.86 | 28.57 | 42.86 | 28.57 | 28.57 | 0 |
| 2.1.2.0.1.0 | 4 | 2 | 42.86 | 42.86 | 42.86 | 37.14 | 100 | 68.57 | 51.43 | 42.86 | 42.86 | 28.57 | 28.57 | 0 |
| 2.1.2.0.1.2 | 5 | 3 | 14.29 | 14.29 | 14.29 | 14.29 | 14.29 | 28.57 | 14.29 | 54.29 | 68.57 | 28.57 | 28.57 | 14.29 |
| 2.1.2.0.2.0 | 4 | 3 | 28.57 | 57.14 | 57.14 | 28.57 | 42.86 | 82.86 | 68.57 | 42.86 | 42.86 | 42.86 | 28.57 | 0 |
| 2.1.2.0.2.1 | 5 | 3 | 14.29 | 14.29 | 14.29 | 14.29 | 14.29 | 28.57 | 14.29 | 68.57 | 68.57 | 28.57 | 28.57 | 14.29 |
| 2.1.2.0.2.2 | 5 | 4 | 14.29 | 14.29 | 17.14 | 14.29 | 14.29 | 14.29 | 14.29 | 14.29 | 68.57 | 57.14 | 28.57 | 14.29 |
| 2.1.2.1.0.0 | 4 | 2 | 42.86 | 57.14 | 42.86 | 51.43 | 100 | 68.57 | 51.43 | 28.57 | 28.57 | 28.57 | 28.57 | 0 |
| 2.1.2.1.0.2 | 5 | 3 | 14.29 | 14.29 | 14.29 | 14.29 | 14.29 | 28.57 | 14.29 | 54.29 | 68.57 | 42.86 | 28.57 | 14.29 |
| 2.1.2.1.2.0 | 5 | 3 | 28.57 | 28.57 | 28.57 | 28.57 | 28.57 | 42.86 | 28.57 | 68.57 | 68.57 | 42.86 | 28.57 | 0 |
| 2.1.2.1.2.2 | 6 | 4 | 14.29 | 22.86 | 14.29 | 14.29 | 14.29 | 14.29 | 14.29 | 14.29 | 28.57 | 28.57 | 42.86 | 14.29 |
| 2.1.2.2.0.0 | 4 | 3 | 28.57 | 71.43 | 71.43 | 42.86 | 57.14 | 97.14 | 82.86 | 42.86 | 42.86 | 28.57 | 28.57 | 0 |
| 2.2.1.2.0.1 | 5 | 3 | 14.29 | 14.29 | 28.57 | 14.29 | 28.57 | 42.86 | 28.57 | 97.14 | 68.57 | 28.57 | 28.57 | 14.29 |
| 2.2.1.2.0.2 | 5 | 4 | 14.29 | 14.29 | 17.14 | 14.29 | 14.29 | 14.29 | 14.29 | 14.29 | 82.86 | 57.14 | 28.57 | 14.29 |
| 2.2.1.2.1.0 | 5 | 3 | 28.57 | 28.57 | 42.86 | 28.57 | 42.86 | 57.14 | 42.86 | 97.14 | 68.57 | 28.57 | 28.57 | 0 |
Figure 6. Some of the isomericO-glycoforms of pIgA1 (Ale) identified by computational analysis of MS/MS spectra of trypticO-glycopeptides using BIOSPEAN software.
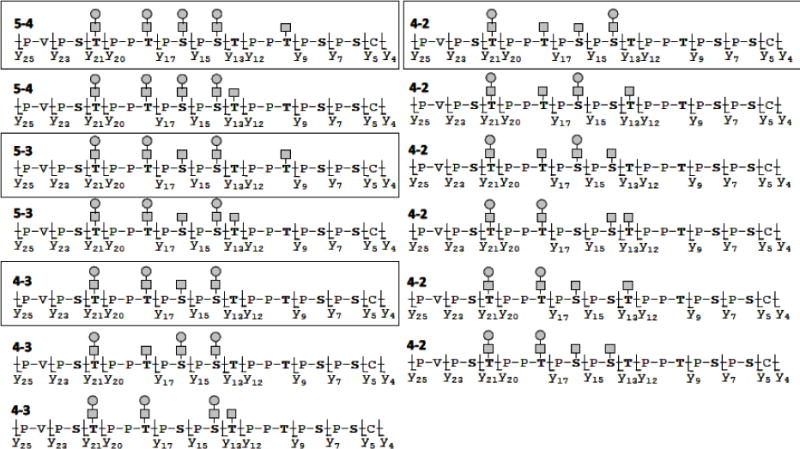
Experimental MS/MS spectra were individually compared with the set of virtual spectra using the software BIOSPEAN (see Materials and methods). The results are based on the number of overlapping peaks and allowed identification of many potential isomeric O-glycoforms based on peaks identified in the PSD-MALDI TOF/TOF MS/MS spectra for each predominant precursor ion species (see Table 2). Isomers of highest confidence are highlighted by frames.
4. Discussion
Approximately half of all proteins have glycosylation as a post-translational modification and thus studies of glycoprotein structures are important [47]. The aim of this work was to perform by the use of PSD-MALDI FOF/TOF MS identification and direct localization of O-glycosylation in the HR of polymeric IgA1 myeloma protein (Ale) that has served as a model of Gal-deficient IgA1 in IgAN [20,24,48]. For a deeper understanding and determination of O-glycoforms that are involved in the pathogenesis of IgAN, it is necessary to identify all sites with Gal-deficiency. Defining both macro- and micro heterogeneity of O-glycosylation in the HR is one of the biggest analytical challenges in the analysis of IgA1. A recent study of pIgA1 myeloma protein (Ale) reported that ECD/ETD fragmentation combined with an IgA-specific protease digestion can define the distribution and specific sites of Gal-deficiency for a majority of the O-glycoforms within a single sample of IgA1. In that study, five O-glycosylation sites were identified at Thr225, Thr228, Ser230, Ser232 and Thr236. The most frequent Gal-deficient positions were localized at Ser230 and Thr236 [6]. In a more recent study, another IgA1 myeloma protein (Mce) and IgA1 from normal human sera were analyzed. The authors have reported the discovery of isoforms of HR glycopeptides and a sixth native site of O-glycosylation at Thr233 [3].
Inflammatory responses triggered by IgA1 or IgA2 are primarily mediated by the IgA-specific Fc receptor, FcαRI, which is a transmembrane glycoprotein expressed on cells of the myeloid lineage including eosinophils, neutrophils, monocytes, and macrophages. In a complex with FcαRI, IgA1 binds in such a way that the CH2 N-glycans of IgA1 may directly contact FcαRI and play a role in the FcαRI-IgA1 interaction [49]. The hinge-region O-glycans clearly do not participate in such an interaction as they are too distant from the site of contact between the two proteins. Aberrant O-glycosylation of IgA1 is involved in the pathogenesis of IgAN and the closely related Henoch-Schönlein purpura nephritis. Interestingly, the aberrantly glycosylated molecules are recognized by the immune system as evidenced by formation of specific antibodies [48] and, consequently, circulating immune complexes are formed that can deposit in the glomerular mesangium. Alternatively glycosylated forms of IgA1 thus generate a different immune response. Whether different glycoforms are better suited to particular immune functions at particular immune sites is not clear [50].
In this work, we confirmed all of the five sites in pIgA1 (Ale) and additionally localized the sixth O-glycosylation site at Thr233 for the first time in this model protein. Our strategy relied on MALDI-TOF/TOF instrument and a key point in the procedure of sample preparation. SDS-PAGE was used for the separation of the heavy chain of pIgA1. This step allowed purification of the sample from impurities and reducing complexity of peptides after the subsequent digestion with trypsin as seen with previous reports [25]. However, a problem arose during sample modification by IAM. When we performed reduction/alkylation of the sample according to a protocol by Shevchenko et al. [42], unspecific modifications of tryptic peptides by IAM were observed suggesting an “overalkylation” because of side reactions. This was probably caused by an insufficient washing of gel pieces after aspirating IAM solution. IAM is a very powerful modification agent. Its reaction with Cys under suitable conditions is very specific. If used in excess, IAM might become nonspecific. Then amino acids undergo N- as well as S-carbamidomethylation and even O-alkylation was detected [51]. For that reason we have included a repeated washing of the gel pieces with 0.1 M NH4HCO3 after the alkylation step. As a result, O-glycopeptides became readily detectable, although each of them was still split into a group of peaks, which reduced intensity of possible precursor ions for MS/MS analysis (Fig. 2b). This effect was due to the differential modification by free acrylamide in the polyacrylamide gels of reduced Cys residues in the HR region of IgA1 during the electrophoresis. The subsequent targeted modification by IAM generated differentially modified variants of each O-glycopeptide (theoretically there are 4 variants for three modified cysteines: 3xCAM, 2xCAM+1xPAM, 1xCAM+2PAM and 3xPAM; Fig. 2b). There were two possible ways of correcting this problem: either by performing reduction/alkylation prior to SDS-PAGE or using acrylamide as a modification agent after SDS-PAGE. As alkylation with acrylamide is pH and time dependent and usually proceeds for several hours [52], we selected the first approach. MALDI-TOF/TOF mass spectra of HR O-glycopeptides after optimization of Cys modification exhibited well-defined ion peaks (Fig. 2c). The complete modification of cysteines by IAM was found critical for successful MS/MS analyses on the way to deciphering the microheterogeneity of O-glycosylation in pIgA1 (Ale). Similarly, removal of the excess of the reagent was equally important.
After optimizing the sample preparation for MALDI-TOF/TOF MS, profiling of the O-glycopeptide pattern of pIgA1 (Ale) was reproducible (Fig. 3). After a pre-fractionation of tryptic digest on POROS Oligo R3 sorbent and subsequent MALDI-TOF/TOF MS analysis, reading the m/z values of O-glycopeptide peaks allow determination of the overall glycan composition (Table 1). As some of the detected peaks displayed remarkably high intensities when compared with the others in the O-glycopeptide profile, we attempted to estimate their relative abundance. The most abundant O-glycoforms were with 4–4, 4–3, 5–4, 5–3, 4–2, and 3–3 GalNAc-Gal residues (given in the descending order of abundance). The glycoforms with 4 attached O-glycans represented about 70% of the detected O-glycopeptides followed by those with 5 occupied glycosylation sites – 24%).
Previously published data obtained for the same protein (although different sample preparation) by use of RPLC-FT-ICR MS, showed the following descending abundance series: 4–4, 5–4, 4–3, 5–3, 5–5, 4–2, and HR glycoforms with 5 attached glycans represented about 40% of total HR content, whereas the O-glycoforms with 4 occupied sites represented ~55% [6]. While the rank orders are similar the difference in relative abundance is likely due to the different ionization techniques (MALDI vs. electrospray ionization). Moreover, MALDI is not a quantitative technique, although it can be used to some extent for semi-quantitative comparisons based on the relative abundance of molecules within a spectrum [53]. Overall, when evaluating summarized percentage numbers from this work and the study by RPLC-FT-ICR MS, they are comparable.
The application of a microgradient separation of the IgA1 digests using RPLC on capillary columns within the off-line resulted in suitable precursor ions for PSD-MALDI-TOF/TOF MS/MS, which enabled us to decipher the microheterogeneity of O-glycosylation in pIgA1 (Ale). Fig. 5 and Supplementary Fig. 2 show a comprehensive picture of the results. Fifteen unique ion species corresponding to HR O-glycopeptides were subjected to a fragmentation analysis to localize O-glycosylation sites. Fig. 5 indicates that the major sites of microheterogeneity appear between Thr225 up to Thr236, which is in accordance with previous findings [6]. Ser232 is almost exclusively occupied by a disaccharide as seen with a different IgA1 myeloma protein [3]. Only three O-glycoforms of low abundance (1–0, 1–1, 2–2) have no sugar attached at Ser232. The second site which is predominantly occupied with a disaccharide is Thr225. Nevertheless, we observed a population of low abundant position isomers of O-glycoforms (1–0, 1–1, 2–2, 3–1, 3–2 and 3–3) where Thr225 is not occupied. Manual inspection of the MS/MS spectra resulted in completing a list of the most obvious O-glycoforms (Fig. 5). However, the complexity of results is largely increased by the existence of isomeric O-glycoforms having the same level of O-glycosylation but a different occupancy at particular amino-acid sites. Because of the presence of more y-series fragment ions related to a single fragmentation site in the given O-glycopeptide (Fig. 4), the manual inspection becomes almost impossible and we suggested using a computational approach, which proved to be helpful for getting the highest possible information content from our data (Table 2 and Fig. 6). Based on this analysis, the most frequent Gal-deficient sites seem those at Ser230 and Thr236 in agreement with previous reports [6]. In 2010, Takahashi et al. [6] reported the existence of a mixture of isomeric and differently glycosylated O-glycopeptides based on results from ECD/ETD analyses of the most abundant pIgA1 (Ale) O-glycoforms. However, the authors have not analyzed the variable attachment sites and did not perform a quantification study, which would provide relative abundance data for the isomers. Later on, Takahashi et al. [3] described a detailed investigation of isomeric O-glycoforms in pIgA (Mce1) protein as well as in IgA1 from a normal human serum. The quantification of relative abundance was based on chromatographic data (peak areas) and the glycan attachment sites were determined by interpretation of MS/MS spectra. Nevertheless, the range of the detected isomeric O-glycoforms is significantly higher in the present study, where also the O-glycoforms 4–2, 4–3, 4–4, 5–3 and 5–4 were found to exist in many isomeric variants.
Takahashi et al. (2010) proposed that the distribution of IgA1 (Ale) myeloma protein O-glycosylation is dominated by a group of IgA1 O-glycoforms that may originate from a semi-ordered carbohydrate additions that proceed from Thr225 to Thr236. However, they also proposed the existence of a smaller subpopulation of IgA1 O-glycoforms that does not follow this semi-ordered process, giving rise to differentially O-glycosylated isomeric species [6]. These findings are in a slight contrast with our data. Here the MS/MS experiments revealed that the process of O-glycosylation in IgA1 HR is probably initiated not only at Thr225 but also at Thr228 in a population of positional isomers. Lectin domains of different GalNAc-transferases can recognize the same substrate (GalNAc-glycopeptides) and this could result in different sites or order of GalNAc attachment, catalyzed by several GalNAc transferases [54]. In more recent work, the same group that suggested Thr225 has performed in vitro GalNAc-transferase reactions that suggests that Thr228 is the more likely originating site of glycosylation (unpublished data). This matches an alternative explanation by Takahashi et al. (2010) for the existence of O-glycoforms that does not follow the semi-ordered mechanism of carbohydrate addition due to a low-level natural occurrence of Thr225 being “skipped” by the GalNAc-transferase [6]. This hypothesis seems to be more appropriate in the light of our results. There is a population of positional isomers, which probably follows the semi-ordered mechanism proceeding from Thr228. Our current results would suggest that Thr225 is not initially glycosylated by GalNAc-transferase but is as low as fourth in rank order out of the six confirmed glycosylation sites (Thr225 is not occupied in some positional isomers of the O-glycoforms 1–0, 1–1, 2–2, 3–1, 3–2 and 3–3; Fig. 5, Supplementary Fig. 3).
Similar to previous results [6,7,35], the distribution of HR glycoforms for pIgA1 (Ale) focuses around O-glycopeptides comprising GalNAc4Gal3 (4–3), GalNAc4Gal4 (4–4) and GalNAc5Gal4 (5–4). We hypothesize that the species 4–4 represents a product of the addition of a Gal residue to the GalNAc monosaccharide at Ser230 of the O-glycoform 4–3. Alternatively, but to a lesser extent, GalNAc-transferase can add a single GalNAc monosaccharide to Ser236 giving rise to the less abundant O-glycoform 5–3. The O-glycoform 4–3 may arise from the addition of a Gal residue to at least two different positional isomers of the O-glycoform 4–2 (Figs. 5 and 6). The structure of the O-glycoform 3–3 might indicate that it is produced by a minor mechanism of galactosylation. The other mechanism would prefer adding Gal to GalNAc at Thr228 and Ser230 after adding GalNAc at Thr225. The GalNAc at Thr225 is then galactosylated to provide the O-glycoform 4–2, which could be the major substrate for GalNAc-tranferase in the production of the most abundant O-glycoform with two Gal-deficient sites (5–3). These similar findings in this study using a different IgA1 myeloma protein preparation and different MS platform provide strong corroborating evidence for the proposed semi-ordered addition of Gal for these dominant O-glycoforms of IgA1 [6].
5. Conclusions
In this work, we have introduced a modified approach for analyzing the microheterogeneity of O-glycosylation in human IgA1 at the level of glycosylation sites and O-glycan composition. The sample preparation procedure used involved in-gel digestion of a polymeric IgA1 model and relied on a key step of optimized cysteine alkylation prior to SDS-PAGE, which allowed to avoid future signal splitting of O-glycopeptides in MALDI-TOF/TOF MS. Mass spectrometric profiling of O-glycopeptides (after separation of the digests by RPLC on capillary columns using a microgradient device) was completed by MS/MS. Based on the acquired MS/MS spectra and their interpretation, which utilized a manual reading as well as computational processing to decipher the fragmentation patterns, we may conclude that the most abundant O-glycoforms in the model protein are those containing GalNAc-Gal levels of 4–4, 4–3, 5–4, 5–3, 4–2 and 3–3, which exist in isomeric variants with differentially occupied O-glycosylation sites. The most frequent Gal-deficient sites were localized at Ser230 and Thr236.
We show that our simplified approach is efficient and has a high potential to provide a method for the rapid assessment of IgA1 heterogeneity that is a less expensive and yet corroborating alternative to LC-(high-resolution)-MS protocols. The novelty and biological significance resides in demonstration, for the first time, of the distribution of the most abundant isoforms of HR O-glycopeptides of IgA1. Our data also allow a direct comparison of MALDI MS and FT MS results [3,6] and evaluation of advantages of individual approaches. Notably, the present procedure is based on a tryptic peptide, which may be difficult to fragment by ECD/ETD. As another new feature, we introduce a software solution for interpretation of MS/MS data of O-glycopeptide isoforms, which provides the possibility of fast and easier data processing.
Supplementary Material
Highlights.
This work focuses on the O-glycosylation of immunoglobulin A1 (IgA1)
IgA1 hinge-region glycopeptides were chromatographed using a microgradient device
MALDI-TOF/TOF tandem mass spectrometry allowed assigning O-glycosylation sites
The most frequent galactose-deficient sites were at Ser230 and/or Thr236
The distribution of isomeric O-glycoforms is demonstrated using a new software
Significance.
In this work, we studied the O-glycosylation in the hinge region of human immunoglobulin A1 (IgA1). Aberrant glycosylation of the protein plays a key role in the pathogenesis of IgA nephropathy. Thus identification of the O-glycan composition of IgA1 is important for a deeper understanding of the disease mechanism, biomarker discovery and validation, and implementation and monitoring of disease-specific therapies. We developed a new procedure for elucidating heterogeneity of IgA1 O-glycosylation. After running a polyacrylamide gel electrophoresis under denaturing conditions, the heavy chain of IgA1 was subjected to in-gel digestion by trypsin. O-glycopeptides were separated from the digest on capillary columns using a microgradient chromatographic device (replacing commonly used liquid chromatographs) and subjected to MALDI-TOF/TOF mass spectrometry (MS) and tandem mass spectrometry (MS/MS) involving post-source decay fragmentation. We show that the complete modification of cysteines by iodoacetamide prior to electrophoresis is critical for successful MS/MS analyses on the way to deciphering the microheterogeneity of O-glycosylation in IgA1. Similarly, removal of the excess of the reagent is equally important. The acquired MS/MS allowed assigning up to six O-glycosylation sites and identification of isomeric O-glycoforms. We show that our simplified approach is efficient and has a high potential to provide a method for the rapid assessment of IgA1 heterogeneity that is a less expensive and yet corroborating alternative to LC-(high-resolution)-MS protocols. The novelty and biological significance resides in demonstration, for the first time, of the distribution of the most abundant isoforms of HR O-glycopeptides of IgA1. As another new feature, we introduce a software solution for interpretation of MS/MS data of O-glycopeptide isoforms, which provides the possibility of fast and easier data processing.
Acknowledgments
This work was supported by OP RD&I grant no. ED0007/01/01 (Centre of the Region Haná for Biotechnological and Agricultural Research) and OP EC grant CZ.1.07/2.4.00/31.0130 (ChemPharmNet) from the Ministry of Education Youth and Sports, Czech Republic, plus a long-term organization development plan no. 1011 from the Faculty of Military Health Sciences, University of Defence, CZ. JN and MBR were supported in part by grants from the National Institutes of Health DK082753, DK078244, DK083663, and GM098539. The authors appreciate technical assistance of Mrs. Stacy Hall and Rhubell Brown with the isolation of pIgA1 (Ale).
Abbreviations
- ACN
acetonitrile
- CHCA
α-cyano-4-hydroxycinnamic acid
- DTT
dithiothreitol
- ECD
electron capture dissociation
- ETD
electron transfer dissociation
- FEP
fluorinated ethylene propylene
- FT-ICR
Fourier transform ion cyclotron resonance
- IAM
iodoacetamide
- IgA
immunoglobulin A
- IgAN
IgA nephropathy
- HR
hinge region
- LC
liquid chromatography
- MALDI-TOF
matrix-assisted laser desorption/ionization time-of-flight
- MS
mass spectrometry
- MS/MS
tandem mass spectrometry
- PSD
post-source decay
- RPLC
reversed-phase liquid chromatography
- TFA
trifluoroacetic acid
Footnotes
Publisher's Disclaimer: This is a PDF file of an unedited manuscript that has been accepted for publication. As a service to our customers we are providing this early version of the manuscript. The manuscript will undergo copyediting, typesetting, and review of the resulting proof before it is published in its final citable form. Please note that during the production process errors may be discovered which could affect the content, and all legal disclaimers that apply to the journal pertain.
Contributor Information
Pavel Řehulka, Email: rehulka@pmfhk.cz.
Jan Novak, Email: jannovak@uab.edu.
Marek Šebela, Email: marek.sebela@upol.cz.
References
- 1.Mestecky J. Immunobiology of IgA. Am J Kidney Dis. 1988;12:378–83. doi: 10.1016/s0272-6386(88)80029-5. [DOI] [PubMed] [Google Scholar]
- 2.Frangione B, Wolfenstein-Todel C. Partial duplication in the “hinge” region of IgA1 myeloma proteins. Proc Natl Acad Sci USA. 1972;69:3673–6. doi: 10.1073/pnas.69.12.3673. [DOI] [PMC free article] [PubMed] [Google Scholar]
- 3.Takahashi K, Smith AD, Poulsen K, Kilian M, Julian BA, Mestecky J, et al. Naturally occurring structural isomers in serum IgA1 O-glycosylation. J Prot Res. 2012;11:692–702. doi: 10.1021/pr200608q. [DOI] [PMC free article] [PubMed] [Google Scholar]
- 4.Tarelli E, Smith AC, Hendry BM, Challacombe SJ, Pouria S. Human serum IgA1 is substituted with up to six O-glycans as shown by matrix assisted laser desorption ionisation time-of-flight mass spectrometry. Carbohydrate Res. 2004;339:2329–35. doi: 10.1016/j.carres.2004.07.011. [DOI] [PubMed] [Google Scholar]
- 5.Baenziger B, Kornfeld S. Structure of the carbohydrate units of IgA1 immunoglobulin. II. Structure of the O-glycosidically linked oligosaccharide units. J Biol Chem. 1974;249:7270–81. [PubMed] [Google Scholar]
- 6.Takahashi K, Wall SB, Suzuki H, Smith AD, Hall S, Poulsen K, et al. Clustered O-glycans of IgA1: defining macro- and microheterogeneity by use of electron capture/transfer dissociation. Mol Cel Proteomics. 2010;9:2545–57. doi: 10.1074/mcp.M110.001834. [DOI] [PMC free article] [PubMed] [Google Scholar]
- 7.Novak J, Tomana M, Kilian M, Coward L, Kulhavy R, Barnes S, et al. Heterogeneity of O-glycosylation in the hinge region of human IgA1. Mol Immunol. 2000;37:1047–56. doi: 10.1016/s0161-5890(01)00019-0. [DOI] [PubMed] [Google Scholar]
- 8.Field MC, Dwek RA, Edge CJ, Rademacher TW. O-linked oligosaccharides from human serum immunoglobulin A1. Biochem Soc Trans. 1989;17:1034–5. doi: 10.1042/bst0171034. [DOI] [PubMed] [Google Scholar]
- 9.Mattu TS, Pleass RJ, Willis AC, Kilian M, Wormald MR, Lellouch AC, et al. The glycosylation and structure of human serum IgA1, Fab, and Fc regions and the role of N-glycosylation on Fcα receptor interactions. J Biol Chem. 1998;273:2260–72. doi: 10.1074/jbc.273.4.2260. [DOI] [PubMed] [Google Scholar]
- 10.Mestecky J, Tomana M, Crowley-Nowick PA, Moldoveanu Z, Julian BA, Jackson S. Defective galactosylation and clearance of IgA1 molecules as a possible etiopathogenic factor in IgA nephropathy. Contrib Nephrol. 1993;104:172–82. doi: 10.1159/000422410. [DOI] [PubMed] [Google Scholar]
- 11.Moore JS, Wu X, Kulhavy R, Tomana M, Novak J, Moldoveanu Z, et al. Increased levels of galactose-deficient IgG in sera of HIV-1-infected individuals. AIDS. 2005;19:381–9. doi: 10.1097/01.aids.0000161767.21405.68. [DOI] [PubMed] [Google Scholar]
- 12.Rademacher TW, Williams P, Dwek RA. Agalactosyl glycoforms of IgG autoantibodies are pathogenic. Proc Natl Acad Sci USA. 1994;91:6123–7. doi: 10.1073/pnas.91.13.6123. [DOI] [PMC free article] [PubMed] [Google Scholar]
- 13.Springer GF. Immunoreactive T and Tn epitopes in cancer diagnosis, prognosis, and immunotherapy. J Mol Med. 1997;75:594–602. doi: 10.1007/s001090050144. [DOI] [PubMed] [Google Scholar]
- 14.Troelsen LN, Garred P, Madsen HO, Jacobsen S. Genetically determined high serum levels of mannose-binding lectin and agalactosyl IgG are associated with ischemic heart disease in rheumatoid arthritis. Arthritis Rheum. 2007;56:21–9. doi: 10.1002/art.22302. [DOI] [PubMed] [Google Scholar]
- 15.Stuchlová Horynová M, Raška M, Clausen H, Novak J. Aberrant O-glycosylation and anti-glycan antibodies in an autoimmune disease IgA nephropathy and breast adenocarcinoma. Cell Mol Life Sci. 2013;70:829–39. doi: 10.1007/s00018-012-1082-6. [DOI] [PMC free article] [PubMed] [Google Scholar]
- 16.Berger J, Hinglais N. Intercapillary deposits of IgA-IgG. J Urol Nephrol (Paris) 1968;74:694–5. [PubMed] [Google Scholar]
- 17.Gharavi AG, Yan Y, Scolari F, Schena FP, Frasca GM, Ghiggeri GM, et al. IgA nephropathy, the most common cause of glomerulonephritis, is linked to 6q22–23. Nat Genetics. 2000;26:354–7. doi: 10.1038/81677. [DOI] [PubMed] [Google Scholar]
- 18.Julian BA, Waldo FB, Rifai A, Mestecky J. IgA nephropathy, the most common glomerulonephritis worldwide: a neglected disease in the United States? Am J Med. 1988;84:129–32. doi: 10.1016/0002-9343(88)90019-8. [DOI] [PubMed] [Google Scholar]
- 19.D’Amico G. The commonest glomerulonephritis in the world: IgA nephropathy. Quart J Med. 1987;64:709–27. [PubMed] [Google Scholar]
- 20.Novak J, Moldoveanu Z, Renfrow MB, Yanagihara T, Suzuki H, Raska M, et al. IgA nephropathy and Henoch-Schoenlein purpura nephritis: aberrant glycosylation of IgA1, formation of IgA1-containing immune complexes, and activation of mesangial cells. Contrib Nephrol. 2007;157:134–8. doi: 10.1159/000102455. [DOI] [PubMed] [Google Scholar]
- 21.Tomino Y, Suzuki S, Imai H, Saito T, Kawamura T, Yorioka N, et al. Measurement of serum IgA and C3 may predict the diagnosis of patients with IgA nephropathy prior to renal biopsy. J Clin Lab Anal. 2000;14:220–3. doi: 10.1002/1098-2825(2000)14:5<220::AID-JCLA4>3.0.CO;2-2. [DOI] [PMC free article] [PubMed] [Google Scholar]
- 22.Novak J, Julian BA, Mestecky J, Renfrow MB. Glycosylation of IgA1 and pathogenesis of IgA nephropathy. Semin Imunopathol. 2012;34:365–82. doi: 10.1007/s00281-012-0306-z. [DOI] [PubMed] [Google Scholar]
- 23.Suzuki H, Kiryluk K, Novak J, Moldoveanu Z, Herr AB, Renfrow MB, et al. The pathophysiology of IgA nephropathy. J Am Soc Nephrol. 2011;22:1795–803. doi: 10.1681/ASN.2011050464. [DOI] [PMC free article] [PubMed] [Google Scholar]
- 24.Novak J, Julian BA, Tomana M, Mestecky J. IgA glycosylation and IgA immune complexes in the pathogenesis of IgA nephropathy. Semin Nephrol. 2008;28:78–87. doi: 10.1016/j.semnephrol.2007.10.009. [DOI] [PMC free article] [PubMed] [Google Scholar]
- 25.Renfrow MB, Mackay CL, Chalmers MJ, Julian BA, Mestecky J, Kilian M, et al. Analysis of O-glycan heterogeneity in IgA1 myeloma proteins by Fourier transform ion cyclotron resonance mass spectrometry: implications for IgA nephropathy. Anal Bioanal Chem. 2007;389:1397–407. doi: 10.1007/s00216-007-1500-z. [DOI] [PubMed] [Google Scholar]
- 26.Allen AC. Methodological approaches to the analysis of IgA1 O-glycosylation in IgA nephropathy. J Nephrol. 1999;12:76–84. [PubMed] [Google Scholar]
- 27.Wada Y, Azadi P, Costello CE, Dell A, Dwek RA, Geyer H, et al. Comparison of the methods for profiling glycoprotein glycans – HUPO Human Disease Glycomics/Proteome Initiative multi-institutional study. Glycobiology. 2007;17:411–22. doi: 10.1093/glycob/cwl086. [DOI] [PubMed] [Google Scholar]
- 28.Wada Y, Dell A, Haslam SM, Tissot B, Canis K, Azadi P, et al. Comparison of methods for profiling O-glycosylation: Human Proteome Organisation Human Disease Glycomics/Proteome Initiative multi-institutional study of IgA1. Mol Cell Proteomics. 2010;9:719–27. doi: 10.1074/mcp.M900450-MCP200. [DOI] [PMC free article] [PubMed] [Google Scholar]
- 29.Renfrow MB, Cooper HJ, Tomana M, Kulhavy R, Hiki Y, Toma K, et al. Determination of aberrant O-glycosylation in the IgA1 hinge region by electron capture dissociation Fourier transformion cyclotron resonance mass spectrometry. J Biol Chem. 2005;280:19136–45. doi: 10.1074/jbc.M411368200. [DOI] [PubMed] [Google Scholar]
- 30.Mirgorodskaya EP, Roepstorff R, Zubarev RA. Localization of O-glycosylation sites in peptides by electron capture dissociation in a Fourier transform mass spectrometer. Anal Chem. 1999;71:4431–6. doi: 10.1021/ac990578v. [DOI] [PubMed] [Google Scholar]
- 31.Mormann M, Paulsen H, Peter-Katalinic J. Electron capture dissociation of O-glycosylated peptides: radical site-induced fragmentation of glycosidic bonds. Eur J Mass Spectrom (Chichester, Eng) 2005;11:497–511. doi: 10.1255/ejms.738. [DOI] [PubMed] [Google Scholar]
- 32.Tomana M, Novak J, Julian BA, Matousovic K, Konecny K, Mestecky J. Circulating immune complexes in IgA nephropathy consist of IgA1 with galactose-deficient hinge region and antiglycan antibodies. J Clin Inves. 1999;104:73–81. doi: 10.1172/JCI5535. [DOI] [PMC free article] [PubMed] [Google Scholar]
- 33.Novak J, Julian BA, Tomana M, Mestecky J. Progress in molecular and genetic studies of IgA nephropathy. J Clin Immunol. 2001;21:310–27. doi: 10.1023/a:1012284402054. [DOI] [PubMed] [Google Scholar]
- 34.Novak J, Vu HL, Novak L, Julian BA, Mestecky J, Tomana M. Interactions of human mesangial cells with IgA and IgA-containing immune complexes. Kidney Int. 2002;62:465–75. doi: 10.1046/j.1523-1755.2002.00477.x. [DOI] [PubMed] [Google Scholar]
- 35.Hiki Y, Odani H, Takahashi M, Yasuda Y, Nishimoto A, Iwase H, et al. Mass spectrometry proves under-O-glycosylation of glomerular IgA1 in IgA nephropathy. Kidney Int. 2001;59:1077–85. doi: 10.1046/j.1523-1755.2001.0590031077.x. [DOI] [PubMed] [Google Scholar]
- 36.Hiki Y, Tanaka A, Kokubo T, Iwase H, Nishikido J, Hotta K, et al. Analyses of IgA1 hinge glycopeptides in IgA nephropathy by matrix-assisted laser desorption/ionization time-of-flight mass spectrometry. J Am Soc Nephrol. 1998;9:577–82. doi: 10.1681/ASN.V94577. [DOI] [PubMed] [Google Scholar]
- 37.Kussmann M, Nordhoff E, Rahbek-Nielsen H, Haebel S, Rossel-Larsen M, Jakobsen L, et al. Matrix-assisted laser desorption/ionization mass spectrometry sample preparation techniques designed for various peptide and protein analytes. J Mass Spectrom. 1997;32:593–601. [Google Scholar]
- 38.Ishihama Y, Rappsilber J, Mann M. Modular stop and go extraction tips with stacked disks for parallel and multidimensional peptide fractionation in proteomics. J Proteome Res. 2006;5:988–94. doi: 10.1021/pr050385q. [DOI] [PubMed] [Google Scholar]
- 39.Rappsilber J, Mann M, Ishihama Y. Protocol for micro-purification, enrichment, pre-fractionation and storage of peptides for proteomics using StageTips. Nat Protoc. 2007;2:1896–1906. doi: 10.1038/nprot.2007.261. [DOI] [PubMed] [Google Scholar]
- 40.Moravcová D, Kahle V, Řehulková H, Chmelík J, Řehulka P. Short monolithic columns for purification and fractionation of peptide samples for matrix-assisted laser desorption/ionization time-of-flight/time-of-flight mass spectrometry analysis in proteomics. J Chromatogr A. 2009;1216:3629–36. doi: 10.1016/j.chroma.2009.01.075. [DOI] [PubMed] [Google Scholar]
- 41.Laemmli UK. Cleavage of structural proteins during the assembly of the head of bacteriophage T4. Nature. 1970;227:680–5. doi: 10.1038/227680a0. [DOI] [PubMed] [Google Scholar]
- 42.Shevchenko A, Tomas H, Havlis J, Olsen JV, Mann M. In-gel digestion for mass spectrometric characterization of proteins and proteomes. Nat Protoc. 2007;1:2856–60. doi: 10.1038/nprot.2006.468. [DOI] [PubMed] [Google Scholar]
- 43.Franc V, Šebela M, Řehulka P, Končitíková R, Lenobel R, Madzak C, et al. Analysis of N-glycosylation in maize cytokinin oxidase/dehydrogenase 1 using a manual microgradient chromatographic separation coupled offline to MALDI-TOF/TOF mass spectrometry. J Proteomics. 2012;75:4027–37. doi: 10.1016/j.jprot.2012.05.013. [DOI] [PubMed] [Google Scholar]
- 44.Kahle V, Vázlerová M, Welsch T. Automated microgradient system for capillary electrochromatography. J Chromatogr A. 2003;990:3–9. doi: 10.1016/s0021-9673(02)01806-x. [DOI] [PubMed] [Google Scholar]
- 45.Spengler B. Post-source decay analysis in matrix-assisted laser desorption/ionization mass spectrometry of biomolecules. J Mass Spectrom. 1997;32:1019–36. [Google Scholar]
- 46.Müller S, Goletz S, Packer N, Gooley A, Lawson A, Hanisch FG. Localization of O-glycosylation sites on glycopeptide fragments from lactation-associated MUC1: all putative sites within the tandem repeat are glycosylation targets in vivo. J Biol Chem. 1997;272:24780–24793. doi: 10.1074/jbc.272.40.24780. [DOI] [PubMed] [Google Scholar]
- 47.Apweiler R, Hermjakob H, Sharon N. On the frequency of protein glycosylation, as deduced from analysis of the SWISS-PROT database. Biochim Biophys Acta. 2007;1473:4–8. doi: 10.1016/s0304-4165(99)00165-8. [DOI] [PubMed] [Google Scholar]
- 48.Suzuki H, Fan R, Zhang Z, Brown R, Hall S, Julian BA, et al. Aberrantly glycosylated IgA1 in IgA nephropathy patients is recognized by IgG antibodies with restricted heterogeneity. J Clin Inves. 2009;119:1668–77. doi: 10.1172/JCI38468. [DOI] [PMC free article] [PubMed] [Google Scholar]
- 49.Herr AB, Ballister ER, Bjorkman PJ. Insights into IgA-mediated immune responses from the crystal structures of human FcαRI and its complex with IgA1-Fc. Nature. 2003;423:614–20. doi: 10.1038/nature01685. [DOI] [PubMed] [Google Scholar]
- 50.Barratt J, Smith AC, Feehally J. The pathogenic role of IgA1 O-linked glycosylation in the pathogenesis of IgA1 nephropathy. Nephrology (Carlton) 2007;12:275–84. doi: 10.1111/j.1440-1797.2007.00797.x. [DOI] [PubMed] [Google Scholar]
- 51.Boja ES, Fales HM. Overalkylation of a protein digest with iodoacetamide. Anal Chem. 2001;73:3576–82. doi: 10.1021/ac0103423. [DOI] [PubMed] [Google Scholar]
- 52.Luche S, Diemer H, Tastet C, Chevallet M, Van Dorsselaer A, Leize-Wagner E, et al. About thiol derivatization and resolution of basic proteins in two-dimensional electrophoresis. Proteomics. 2004;4:551–61. doi: 10.1002/pmic.200300589. [DOI] [PMC free article] [PubMed] [Google Scholar]
- 53.Alexandrov T. MALDI imaging mass spectrometry: statistical data analysis and current computational challenges. BMC Bioinformatics. 2012;13(Suppl 16):S11. doi: 10.1186/1471-2105-13-S16-S11. [DOI] [PMC free article] [PubMed] [Google Scholar]
- 54.Wandall HH, Irazoqui F, Tarp MA, Bennett EP, Mandel U, Takeuchi H, et al. The lectin domains of polypeptide GalNAc-transferases exhibit carbohydrate-binding specificity for GalNAc: lectin binding to GalNAc-glycopeptide substrates is required for high density GalNAc-O-glycosylation. Glycobiology. 2007;17:374–87. doi: 10.1093/glycob/cwl082. [DOI] [PubMed] [Google Scholar]
Associated Data
This section collects any data citations, data availability statements, or supplementary materials included in this article.