Abstract
Electrical shock has been the one effective treatment for ventricular fibrillation for several decades. With the advancement of electrical and optical mapping techniques, histology, and computer modeling, the mechanisms responsible for defibrillation are now coming to light. In this review, we discuss recent work that demonstrates the various mechanisms responsible for defibrillation. On the cellular level, membrane depolarization and electroporation affect defibrillation outcome. Cell bundles and collagenous septae are secondary sources and cause virtual electrodes at sites far from shocking electrodes. On the whole-heart level, shock field gradient and critical points determine whether a shock is successful or whether reentry causes initiation and continuation of fibrillation.
Keywords: ventricular fibrillation, electrical shock, resuscitation, cardiac mapping, transmembrane potential
Introduction
More than 100 years ago, strong electric shocks were shown to terminate ventricular fibrillation (VF) (1, 2). Electrical defibrillation has been used clinically as the principal effective treatment for VF for more than half a century (3, 4). Implantable cardioverter defibrillators capable of detecting and terminating VF are commonly used in patients at high risk for sudden cardiac death, and the prevalence of automatic external defibrillators has enhanced the availability of life-saving defibrillation therapy to a greater population. Despite increased accessibility to technology to deliver defibrillation shocks, the mechanisms by which shocks terminate VF are still not fully understood.
Early theories of the mechanisms of defibrillation proposed that a defibrillation shock must be strong enough to stun or excite a large majority of the cardiac tissue. If a sufficient portion of the cardiac tissue were made temporarily unexcitable by a shock, the uncoordinated wavefronts of excitation that perpetuate VF would be extinguished, and would allow normal cardiac excitation and contraction to resume (5–7). Although this concept remains the underlying principle of defibrillation, the effects of shocks on the cellular, tissue, and whole-organ levels must be understood to gain an appreciation of the defibrillation process in detail.
As new techniques and technology have evolved, so too has our understanding of the mechanisms of defibrillation. Electrical and optical mapping techniques that permit recording of cardiac activation before, during, and after defibrillation shocks allow for direct observation of the response of cardiac tissue to shocks. Extensive computer modeling of cardiac excitation and its response to defibrillation shocks has provided important insights as well.
In this review, the mechanisms by which defibrillation shocks affect the heart on the cellular and tissue levels are discussed. The responses of single cells and multicellular tissues to electric fields are described. However, the whole-heart responses to defibrillation shocks are more complicated than a simple scaling up of the cellular effects of electrical stimulation. Mechanisms of whole-heart defibrillation are presented, and unresolved questions and future directions of research with respect to defibrillation are discussed.
Cellular Mechanisms of Defibrillation
Single Cell Vm Response to Electric Fields
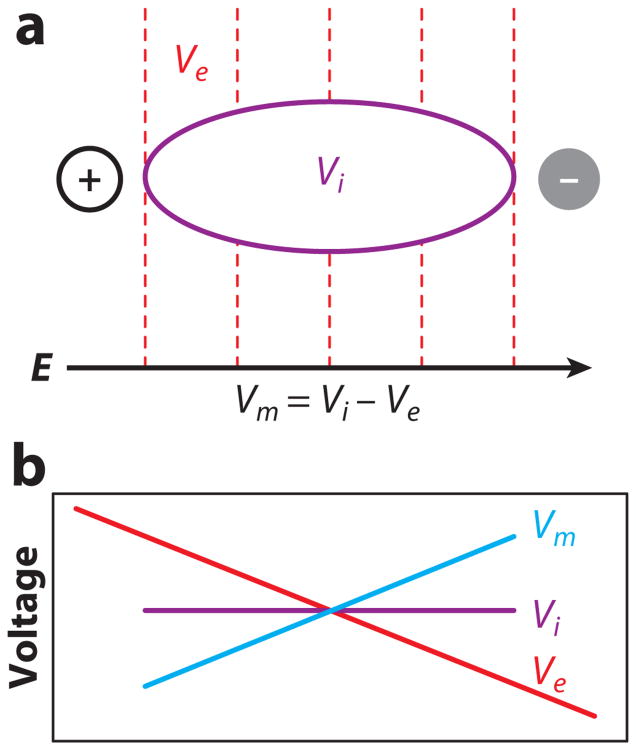
Electrical excitation of cardiac cells requires a stimulus of sufficient strength so that the transmembrane potential (Vm) rises to the activation threshold. When an isolated cell is subjected to an electric field, current flows from one electrode to another along the cell surface. Because of the relatively high impedance of the cell membrane compared with the impedance of the extracellular space and the small cell length [much smaller than the electrotonic space constant of cardiac tissue (8–10)], little current supplied by the shock electrodes enters the cell. Therefore, the intracellular voltage (Vi) does not change appreciably from one end of the cell to the other. On the other hand, the extracellular voltage (Ve) drops linearly over the cell length. As a result, the transmembrane potential (Vm = Vi − Ve) also changes along the cell length as a linear function (Figure 1) with hyperpolarization and depolarization at the cell ends facing the anode and cathode, respectively. When Vm in the depolarized section of the cell reaches the activation threshold, a sufficient number of ion channels are opened to initiate an action potential, which then spreads into the entire cell. These predictions about the distribution of shock-induced Vm changes and activation pattern were confirmed on a qualitative level in measurements from isolated cardiac myocytes using fluorescent Vm-sensitive dyes and optical mapping techniques (11–13).
Figure 1.
Vm response in a single cell to an electric field. (a) Schematic of an elongated cell in an electric field. An electric field (E) creates a gradient of extracellular potential (Ve). Dashed lines indicate isopotential lines. Because of the relatively high impedance of the cell membrane and the short cell length, negligible amounts of current pass through the membrane, and the intracellular voltage (Vi) remains nearly constant throughout the cell. (b) Spatial profiles of Ve, Vi, and transmembrane potential (Vm) along the cell.
The cell response to an electric shock depends on the state of the cell before the shock as well as the strength of the electrical stimulus. Before a shock, a cell may be at rest, in a refractory state, or in a partially refractory state. When extracellular shock potential gradient ∇V) is above diastolic threshold and the cells are in their relatively refractory period, a slight change in the shock timing can significantly alter the cellular response. Figure 2a shows that when such a shock is applied during the relative refractory state, a difference of only a few milliseconds in shock timing can determine whether the shock initiates a new action potential or has almost no effect. When shocks are applied earlier during the refractory phase of the action potential, they produce positive and negative changes in transmembrane potential (ΔVm) that increase nonlinearly with an increase in ∇V (13). The magnitude of ΔVm also depends on the shock polarity, which again indicates a nonlinear behavior of Vm (mechanisms of nonlinear Vm response are discussed below). New action potentials are not generated because sodium channels are inactivated. With larger ∇V, shocks cause varying increases in action potential duration depending on ∇V and the state of the cells (Figure 2b). Depending on the exact shock timing, shocks delivered during repolarization may not only lengthen action potential duration by varying amounts (Figure 2b), but may leave action potentials unchanged, terminate them prematurely, or prevent new action potentials (14–16).
Figure 2.
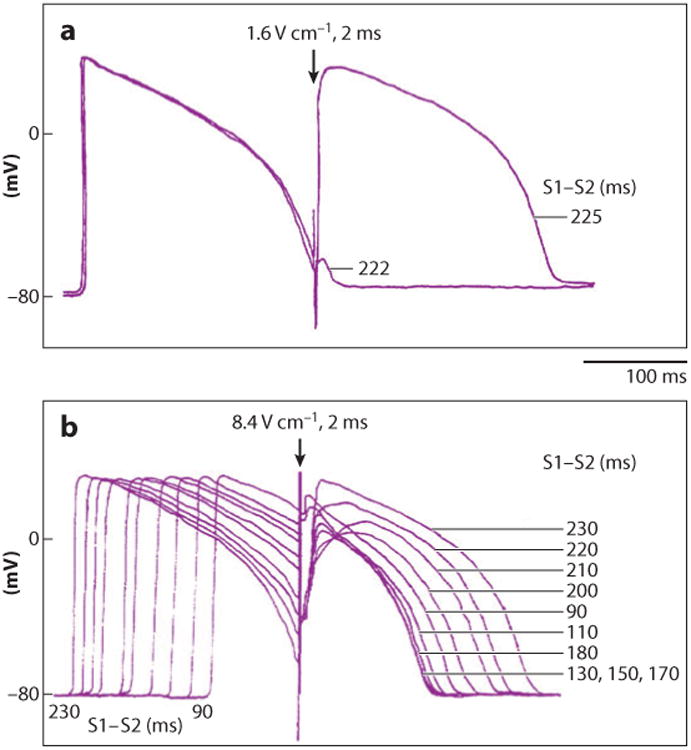
Varying strength and timing of shocks (S2) with respect to the previous electrical stimulus (S1) produce varying responses in recordings of transmembrane potential. (a) With a relatively weak shock field of 1.6 V cm−1, an all-or-nothing response is observed depending on the S1–S2 interval. With an S1–S2 interval of 222 ms, almost no response occurs. With an S1–S2 interval only 3 ms longer, 225 ms, a new action potential occurs. (b) A strong shock field of 8.4 V cm−1 during the plateau of an action potential produces a graded response that varies with the state of the cardiac cell when the shock was delivered. The S1–S2 interval was varied from 90 to 230 ms. The tracings are time aligned with the S2 shock (16).
Vm Response to Electric Fields in Multicellular Tissue
The response of a single cell to an electric field demonstrates many important principles underlying defibrillation. However, cardiac cells are not isolated cells that respond independently from the surrounding tissue. Gap junctions between cells, collagenous septae, tissue orientation, fiber curvature, limited extracellular space resulting from proximity to neighboring structures, and other factors may alter the response of a single cell to an electric field.
Virtual electrodes
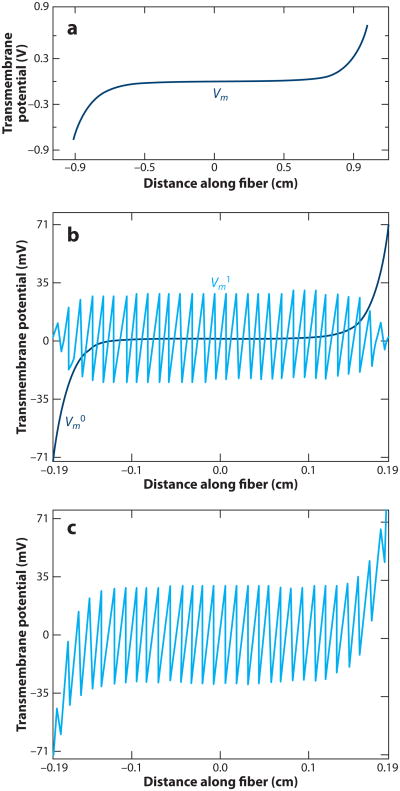
Whereas the pattern of ΔVm caused by a shock in a single, isolated cell is relatively straightforward, the distribution of ΔVm in three-dimensional cardiac tissue is much more complex. One approach to modeling cardiac tissue is to represent it as a syncytium with separate extracellular and intracellular spaces. If a large syncytium of cells behaves as a cable, then classical one-dimensional cable model theory predicts that when a uniform electric field is applied to it, shock-induced ΔVm should be largest at the tissue nearest the shock electrodes and fall off exponentially as the distance from the electrodes increases (Figure 3a) (17). In such a case, the electric field should be sufficient to excite tissue only in the immediate vicinity of the shocking electrodes because ΔVm will be very small in the majority of the cable. However, optical mapping studies have shown that ΔVm occurs at sites located far away from the shocking electrodes (18, 19). Regions of ΔVm that are not near the shocking electrodes are called secondary sources or virtual electrodes.
Figure 3.
Vm responses to uniform electric field predicted by the classical cable model and the sawtooth model. (a) The cable model predicts that Vm effects are limited to a group of cells in the immediate vicinity of the shocking electrodes. (b) The sawtooth model predicts a pattern of alternating positive and negative Vm changes (shown by Vm1) due to abrupt changes in intracellular resistivity across intercellular junctions. The cable model prediction is shown by Vm0. (c) The summed predicted ΔVm from the cable and sawtooth models (17).
Sawtooth model
Such secondary sources of activation may arise either from nonuniformity of the electric field or from nonuniformity of the local resistive properties, which cause redistribution of the current supplied by the shock electrodes between extracellular and intracellular spaces. The first specific mechanism of secondary sources and tissue activation was the cellular sawtooth model (17). This model consists of a chain of cells interconnected by high-resistance gap junctions. The Vm response of each cell in the chain to a shock is qualitatively similar to the response of the isolated cell shown in Figure 1. Each cell is hyperpolarized at one end and depolarized at the other end. For gap junction resistance less than infinity, the magnitudes of maximal hyper- and depolarizations in cell chain are somewhat smaller than in the single cell. The lower the resistance of the gap junction is, the lower is ΔVm for a given ∇V. At the lower limit of zero resistance at the gap junction, the sawtooth completely disappears, leaving the ΔVm predicted by cable theory (Figure 3a). Alternating areas of positive and negative polarizations form the sawtooth pattern (Figure 3b,c). When the electric field is strong enough, Vm in the depolarized areas of all cells reaches the activation threshold, initiating local excitation, which spreads to the hyperpolarized areas. As a result, the whole cell chain is activated nearly simultaneously.
Although cellular sawtooth polarization patterns were observed experimentally in isolated pairs of cardiomyocytes (20), they were not found in multicellular tissues such as cultured cell monolayers (19). Besides the possibility of a low gap-junction resistance, an additional explanation for the discrepancy between the sawtooth model and experiments in cell cultures is the effect of lateral averaging described for microscopic conduction (21) The sawtooth mechanism assumes that axial current is forced to flow through each intercellular junction, resulting in a large voltage drop across this junction. In two-dimensional tissue, however, a portion of axial current can bypass a particular junction and flow through junctions offered by lateral cell connections. In cell cultures, this averaging effect might be especially prominent because of the relatively uniform distribution of gap junctions along the cell perimeter (22). In the intact adult myocardium, the ΔVm at cell borders might be larger due to a larger cell size and a more concentrated distribution of gap junctions at the end-to-end cell connections. However, this effect could be offset by increased numbers of lateral connections in the three-dimensional tissue. Measurements of ΔVm in rabbit papillary muscle using a roving microelectrode displaced in subcellular steps (23) did not reveal significant secondary sources at cell boundaries. High-resolution optical mapping of guinea pig papillary muscle revealed randomly distributed peaks in ΔVm with dimensions in the range of 30 μm to 0.5 mm, rather than a repeating pattern predicted by the sawtooth model (24).
A model of syncytial heterogeneity predicted that a random variation of intracellular to extracellular volume fraction produced ΔVm variation of sufficient size to cause far field excitation (25, 26). A subsequent model incorporated varying cell length, cell diameter, extracellular space, and junctional resistance and demonstrated that random variation of these parameters caused ΔVm peaks 5–6 times larger than sawtooth models with homogeneous cells (27). These models demonstrated that syncytial heterogeneities of even modest size could cause secondary source generation in simulated cardiac tissue.
Tissue structure and secondary sources
In addition to cell boundaries and the syncytial heterogeneities discussed above, cardiac tissue possesses other types of structural discontinuities. One common type of discontinuity is intercellular clefts due to blood vessels and islands or septae of connective tissue (28–30). The effects of such discontinuities on Vm were investigated in cell monolayers with patterned intercellular clefts of variable dimensions (31). Figure 4 demonstrates the effect of an electrical shock on Vm at an intercellular cleft with dimensions of approximately 240 by 60 μm. With one shock polarity (Figure 4a,b), cells were depolarized on one side of the cleft and hyperpolarized on the other side, corresponding to virtual cathodes and anodes, respectively. With the reversed shock polarity, the regions of depolarization and hyperpolarization were reversed (not shown). The magnitude of the ΔVm increased with increasing cleft length. When the mean shock ∇V was 8.5 V cm−1, the estimated threshold level of ΔVm necessary for cell activation in diastole (25 mV) was achieved with a cleft length of 171 ± 7 μm. When this shock strength was given in diastole, it caused direct excitation of cells in the immediate vicinity of the clefts (Figure 4c), where cells were depolarized when shocks were given during the action potential plateau (Figure 4a). On the opposite side of a cleft, cells were initially hyperpolarized by shocks and then depolarized by the spreading excitation wave (Figure 4d).
Figure 4.
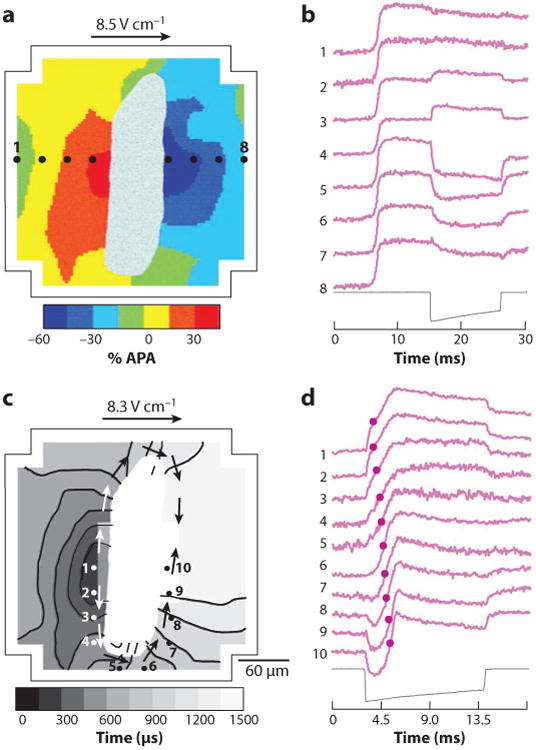
Role of intercellular clefts in shock-induced ΔVm and tissue activation. (a) The shock-induced ΔVm surrounding a cleft in a myocyte monolayer follows the color scale on the bottom of the panel. White areas in the middle depict the intercellular cleft. The outline corresponds to the boundary of the photodiode array. APA, action potential amplitude. (b) Individual pixel recordings from sites 1–8 as shown in panel a with the shock waveform below. (c) Isochronal maps of activation spread initiated from secondary sources during application of shocks in diastole. The gray scale indicates the time of the isochronal lines. Arrows indicate the direction of activation spread. Activation times are determined from the time of earliest activation within the mapping region. (d) Individual pixel recordings from sites 1–10 from panel c. Activation times are shown with circles on the traces (31).
In addition to naturally occurring discontinuities, secondary sources may be also created at sites of artificial discontinuities such as surgical or myocardial infarct scars. A study performed in canine hearts demonstrated that when a myocardial lesion was made approximately 2.5 cm from a stimulating electrode, a sufficiently strong stimulus created activation fronts arising both from the electrode site and from the site of the lesion (32). The same mechanism may be responsible for local tissue activation at scars during application of defibrillation shocks.
Nonlinear response of Vm to extracellular fields
According to histologic studies, the intramural myocardium is organized into sparsely interconnected cell bundles and layers of variable thickness separated by connective tissue septae (33, 34). The boundaries of such structures create obstacles to extracellular current flow surrounding the myocytes, and therefore, they may form a substrate for the formation of secondary sources. To elucidate the basic properties of Vm responses in cell layers, these structures were mimicked in cell culture by growing linear cell strands of variable width (31). Figure 5 illustrates ΔVm induced in cell strands by shocks applied during the action potential plateau. Similar to other secondary sources, positive and negative polarizations were produced on opposite sides of strands facing the cathode and anode, respectively. The shape and the magnitude of ΔVm were strongly dependent on the shock strength and the strand width. Small ΔVm produced by weak shocks in narrow strands had a simple monotonic shape, and they were linear; i.e., ΔVm magnitude was proportional to the shock strength (not shown). The range of ΔVm with a linear membrane response was approximately ±40% of the action potential amplitude (APA) from the plateau level. Larger ΔVm induced in wider strands and/or by stronger shocks were strongly nonlinear. Depending on the shock strength, two types of nonlinear ΔVm could be observed in the same strand. Shocks of intermediate strength induced asymmetric ΔVm distributions in which the negative ΔVm at one strand border was much larger than positive ΔVm at the opposite border (Figure 5b, thin traces). This ΔVm asymmetry was associated with saturation of positive ΔVm as the shock strength increased (Figure 5c). Because of the saturation, positive ΔVm never exceeded 100% of the APA. Similar negatively asymmetric Vm responses were also observed in other preparations, including guinea pig papillary muscle (35, 36) and isolated myocytes (13).
Figure 5.
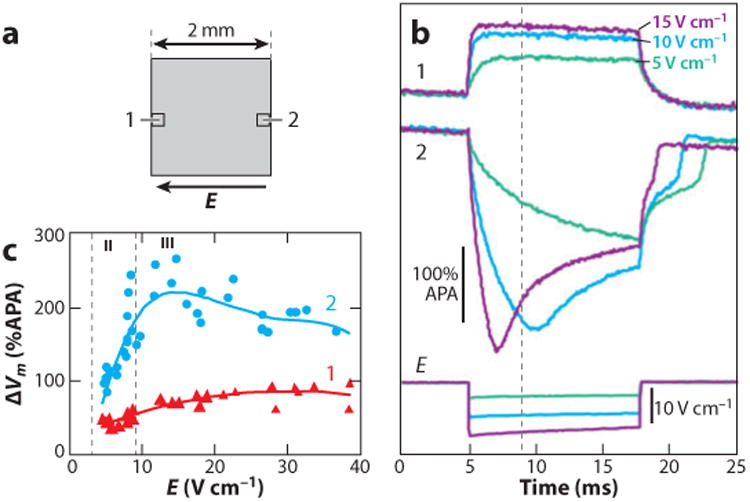
Shock-induced ΔVm in cell strands. (a) Schematic drawing of a cell strand and two photodiodes at opposite strand borders. (b) Recordings of ΔVm at strand border locations 1 and 2 during shocks of approximately 5 V cm−1 (green trace), 10 V cm−1 (blue trace), and 15 V cm−1 (purple trace). The shock field (E) for each shock is shown at the bottom. (c) The dependency of maximal positive and negative ΔVm at the opposite strand borders on the shock strength. Vertical dashed lines separate ranges with simple asymmetric ΔVm (II) from ranges with nonmonotonic ΔVm (III). No responses with symmetric ΔVm (I) are shown in this figure (107). APA, action potential amplitude.
Stronger shocks induced another type of Vm response in cell cultures, with negative ΔVm exhibiting a nonmonotonic time course in which an initial large hyperpolarization was followed by a positive shift of Vm (Figure 5b, gray and thick black traces). As a result of this positive shift, the Vm level at the end of the shock became smaller than during a weaker shock, radically reducing the ΔVm asymmetry. As a result, negative ΔVm exhibited saturation with increasing shock strength at a significantly higher level (∼200% of APA) than saturation of positive ΔVm (Figure 5c). Elevation of diastolic Vm after the shocks as well as the appearance of postshock arrhythmias occurred in parallel with nonmonotonic negative ΔVm in the cell cultures (37). The elevated diastolic Vm suggests that the shock caused electroporation of the cell membrane, as discussed below. The field threshold for postshock arrhythmias was very close to the thresholds for nonmonotonic negative ΔVm. Optical mapping in cell strands with local expansions demonstrated that postshock arrhythmias were focal and that the arrhythmia source was located on the cathodal side of strands in the area of nonmonotonic negative ΔVm (37).
Nonmonotonic ΔVm were also observed in epicardial recordings from isolated rabbit hearts (38). These ΔVm exhibited some differences from polarizations measured in cell cultures. Thus, the nonmonotonic time course in rabbit hearts was observed for both negative and positive ΔVm (Figure 6). Similar to cell cultures, the occurrence of nonmonotonic ΔVm was paralleled by elevation of diastolic Vm. These results indicate that membrane conductance is not constant during a shock application but undergoes Vm- and time-dependent changes. The ionic mechanisms of nonlinear ΔVm are discussed below.
Figure 6.
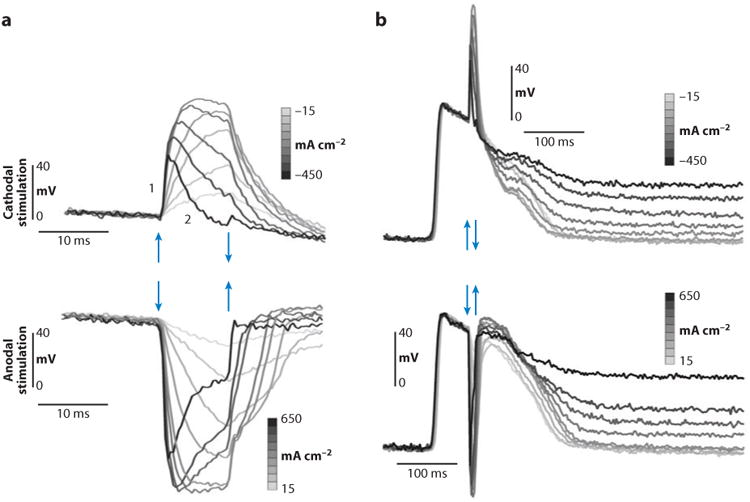
Optical recording of ΔVm under a shocking electrode with different current densities. Arrows mark the beginning and end of the stimulus pulse. (a) Small timescale shows the nonmonotonic response of ΔVm to stimulus amplitude. (b) Large timescale shows elevation of the diastolic potential after the shock (38).
As mentioned above, substrates that form discontinuities in intercellular impedance in myocytes and, hence, secondary sources, are naturally found in the form of collagenous septae between myocyte bundles and around blood vessels. Confocal microscopy of rat ventricular tissue has shown that normal ventricular tissue has abundant collagenous septae and cleavage planes (39–41). Computer simulations using a model of such tissue demonstrated that secondary sources were readily created by these cleavage planes (Figure 7) (39). Such secondary sources resulted in areas of positive and negative ΔVm on a microscopic scale throughout the tissue distant from the stimulating electrodes.
Figure 7.
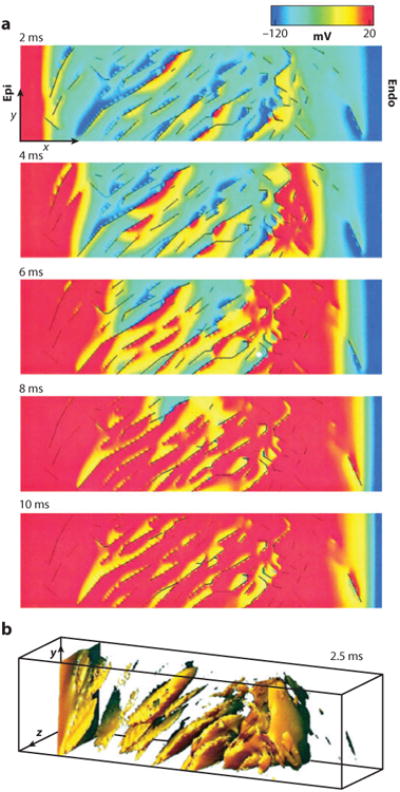
Computer simulation of a shock produces secondary sources in a model based on confocal microscopic images of ventricular rat tissue. (a) Progression of activation during a 10-ms shock. Transmembrane potentials of a single midvolume plane are shown according to the color scale at the top with cleavage plane discontinuities (black lines). Epi, epicardium; Endo, endocardium. (b) A three-dimensional view of secondary sources with transmembrane potentials greater than −60 mV at 2.5 ms into the shock (39).
Macroscopic measurements of shock effects on intramural Vm were carried out in coronary-perfused wedge preparations of porcine left ventricular wall (42–45). These experiments demonstrated that sufficiently strong shocks produced widespread polarizations in intramural tissue layers. When shocks were applied during the action potential plateau, shock-induced ΔVm was negative everywhere across the LV wall, even at the wall edge facing the cathode for shocks of both polarities (Figure 8). This finding can be explained by assuming that shocks produce widely distributed microscopic secondary sources in the intramural myocardium and that the Vm response to the electric field is highly asymmetric, with negative ΔVm exceeding positive ΔVm. The likely anatomic substrate for formation of microscopic sources is the laminar tissue structure (Figure 7). The Vm response of a tissue layer to electric shock should be similar to the response of microscopic cell strands illustrated in Figures 5 and 6. According to this behavior, shocks should induce both positive and negative ΔVm on the opposite sides of individual cell layers. However, because these polarizations were measured on a macroscopic scale, microscopic negative and positive polarizations should be averaged out. If cardiac tissue had a linear Vm response to electric field, the net result would be zero or a negligible macroscopic polarization. Sufficiently strong shocks applied during the action potential plateau, however, induce asymmetric ΔVm with a strong negative bias (ΔV−m > ΔV+m). Because of this asymmetry, spatial averaging of microscopic measurements should yield only negative ΔVm. This can explain globally negative polarizations observed in macroscopic measurements from wedge preparations. In addition to the secondary sources formed by the laminar structure of the heart, the bidomain structure of the myocardium (restricted intracellular and extracellular domains) with different anisotropy ratios also affects how ΔVm responds to electric stimuli (17, 46–48).
Figure 8.
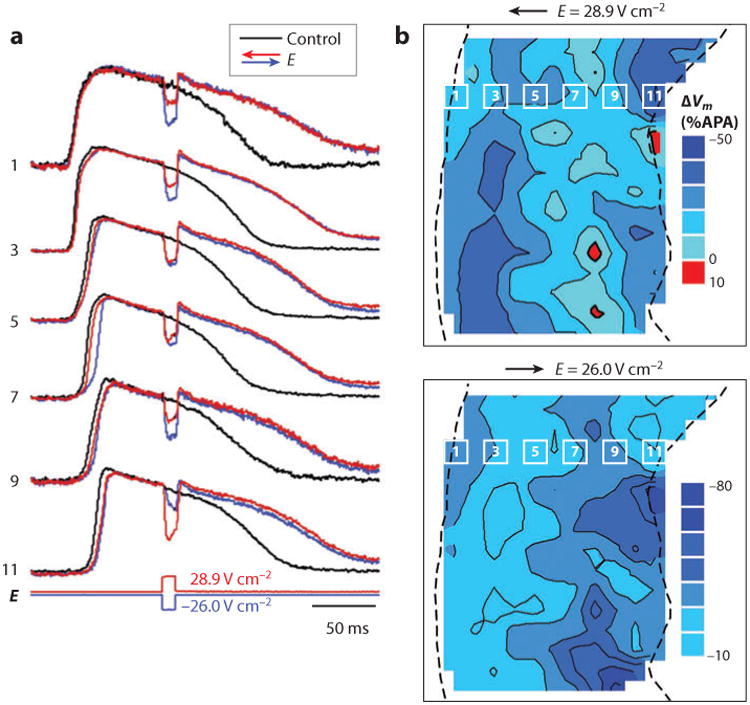
Effects of shocks on intramural Vm in a porcine LV wedge preparation. (a) Optical recordings of Vm in control action potentials and during shock application. E, shock strength. The numbers correspond to the photodiodes indicated in panel b. (b) Isopotential maps of shock-induced ΔVm distribution measured at 9 ms after shock onset. The dashed lines indicate the epicardium on the left and the endocardium on the right (42). APA, action potential amplitude.
Ionic mechanisms of nonlinear ΔVm
The ΔVm asymmetry with larger negative than positive ΔVm for shocks during the action potential plateau reflects an outward shift in the balance of membrane currents. Therefore, it could be expected that ΔVm asymmetry is related to the flow of an outward potassium current, and application of potassium channel blockers should reduce the degree of the ΔVm asymmetry. Contrary to this expectation, however, application of the potassium channel inhibitors barium chloride (inward rectifier current), and 4-aminopyridine (transient outward current) did not reduce the ΔVm asymmetry (37, 49), indicating that neither of these outward currents was responsible for the ΔVm asymmetry.
Unexpectedly, it was found that the asymmetric behavior of ΔVm was reversed by application of a calcium channel blocker. Figure 9 shows the effect of nifedipine on shock-induced ΔVm in linear cell strands. In the control, the maximal ΔV−m was 2.52 ± 0.5 (mean ± standard deviation) times larger than the maximal ΔV+m (Figure 9d). Application of nifedipine caused a strong increase of the maximal ΔV+m, whereas ΔV−m changed only slightly (Figure 9a,b). This caused a reduction of the average asymmetry ratio to 1.62 ± 0.2 (P < 0.001) (Figure 9d).
Figure 9.
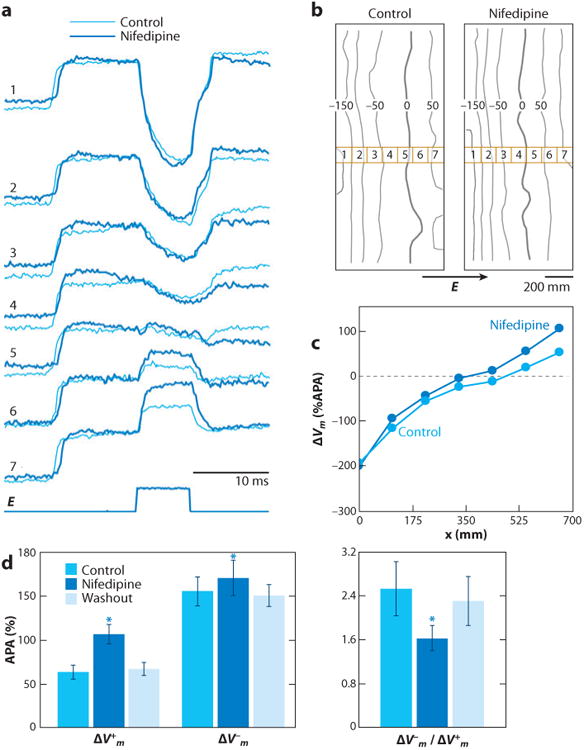
The role of Cai2+ current in asymmetric ΔVm during the action potential plateau. (a) Optical recordings of Vm from selected diodes and shock waveform taken in control and during nifedipine application in a strand with a width of 0.8 mm. The corresponding shock field strengths were 10.8 and 10.6 V cm−1. (b) Isopotential maps of ΔVm distribution 5 ms after the shock onset. Thick lines depict the zero isoline, which separates areas of depolarization and hyperpolarization. The seven numbered squares indicate the location of the diodes from which the recordings in panel a were made. (c) Spatial profiles of ΔVm across the strand. (d) Effect of nifedipine on optical ΔV+m, ΔV−m, and the asymmetry ratio of ΔV−m/ΔV+m in eight strands at a shock field strength of 9.3 ± 0.8 V cm−1 (49). APA, action potential amplitude.
The effect of nifedipine on ΔVm indicates that the ΔVm asymmetry is caused by the outward flow of ICa in the depolarized portions of strands. In the physiologic range of Vm, ICa is inward, but it changes direction when Vm exceeds the reversal potential for ICa. According to patch-clamp studies, the ICa reversal potential in rat and rabbit myocytes is 45 to 50 mV (50, 51). Therefore, positive ΔVm with magnitudes larger than 45 to 50 mV should be reduced by the outward flow of ICa, which explains the effect of nifedipine on ΔV+m.
Simultaneous optical mapping of ΔVm and ΔCai2+ in myocyte cultures has provided further evidence for the importance of ICa in determining ΔVm asymmetry (52). It was found that shocks caused transient Cai2+ decreases at sites of both negative and positive ΔVm. Application of nifedipine eliminated the Cai2+ decrease at ΔV+m sites. These results indicate that ICa indeed flows in the outward direction in the areas of positive polarization, thus reducing the ΔV+m magnitude.
The effect of ΔVm asymmetry might have important implications for defibrillation in the whole heart. During early VF, most of the myocardium is in the plateau of the action potential (53). Therefore, the effects of defibrillation shocks on Vm are predicted to be asymmetric, with a larger portion of myocardium undergoing negative rather than positive Vm changes. As is discussed later in this chapter, an interaction between areas of hyper- and depolarization can lead to the formation of wave breaks and defibrillation failure (54). Because the asymmetry in ΔVm determines the size and the shape of the areas of hyper- and depolarization, it could affect the outcome of a defibrillation shock.
The other type of nonlinear shock-induced polarization, nonmonotonic negative ΔVm, could be due to either activation of a hyperpolarization-induced inward ionic current or flow of a nonspecific inward current caused by membrane electroporation. There are two ionic inward currents operating at large negative Vm: the inward rectifier current, Ik1, and the hyperpolarization-induced If current (55), which was previously implicated in anodal break excitation (56). The roles of If and Ik1 currents in ΔVm were examined in cell cultures using channel blockers (57). Application of either cesium chloride (If blocker) or barium chloride (Ik1 blocker) caused no change in the negative ΔVm, indicating that these currents are not responsible for the nonmonotonic Vm response.
An alternative explanation for nonmonotonic ΔV−m is that it could be due to membrane electroporation. A direct method to detect electroporation is to expose cells to membrane-impermeable dye during shock application and to measure cell uptake of the dye. This method was used in two recent studies performed on cell cultures (37) and rabbit hearts (38) using the fluorescent dye propidium iodide. In cell cultures, application of a series of shocks of a strength similar to that inducing nonmonotonic ΔV−m caused cell uptake of propidium iodide in the hyperpolarized region at the anodal side of cell strands but not on the cathodal side (57). In rabbit hearts, strong shocks of either polarity caused increased fluorescence and nuclear staining of subepicardial tissue layers with propidium iodide, whereas weaker shocks did not (Figure 10). When the propidium iodide passed into the cells, the observed fluorescence increase took place over the course of several minutes, which suggests that damage from electroporation persisted for several minutes rather than seconds.
Figure 10.
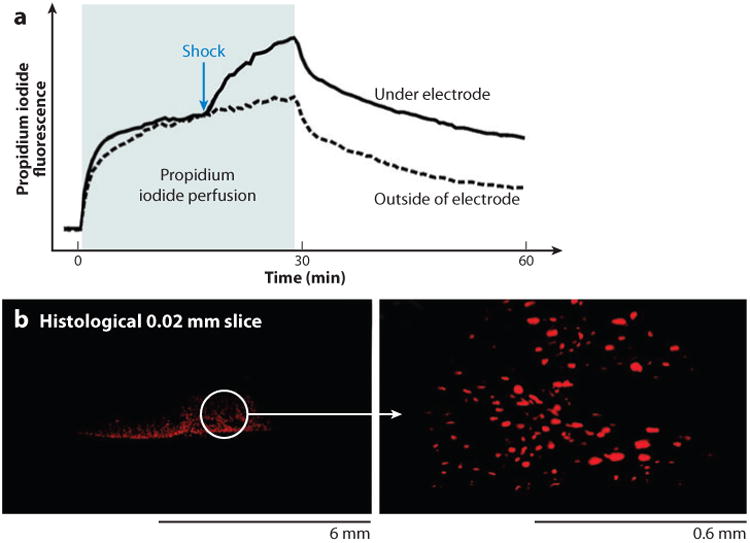
Uptake of membrane-impermeable propidium iodide after a strong shock showing evidence of electroporation. (a) Propidium iodide fluorescence increased after a strong shock (1.6 A cm−2, 20 ms). (b) Fluorescence images made in the stimulation area show propidium iodide stained nuclei (38).
Global Mechanisms of Defibrillation
Computer simulations and experimental observations with catheter electrodes in close contact with cardiac tissue showed that areas close to shocking electrodes produce virtual electrodes that either hyperpolarize or depolarize the surrounding tissue (58, 59). Monophasic shocks may be strong enough to terminate the wavefronts of VF, but fail to defibrillate because the shocks create virtual electrodes, which generate new wavefronts that reinitiate VF (60, 61). Figure 11 shows the development of a virtual cathode and anode on the anterior epicardium of an optically mapped rabbit heart (62). The numerous small areas of depolarization and hyperpolarization shown in Figure 8 are not seen, probably because of the large size of the pixels and because, as shown in Figure 7, the collagenous septae do not extend all the way to the epicardium. After the shock, an activation front arises near the boundary of the virtual cathode and spreads rapidly through the hyperpolarized tissue in the virtual anode, and a reentrant circuit is formed that causes the shock to fail.
Figure 11.
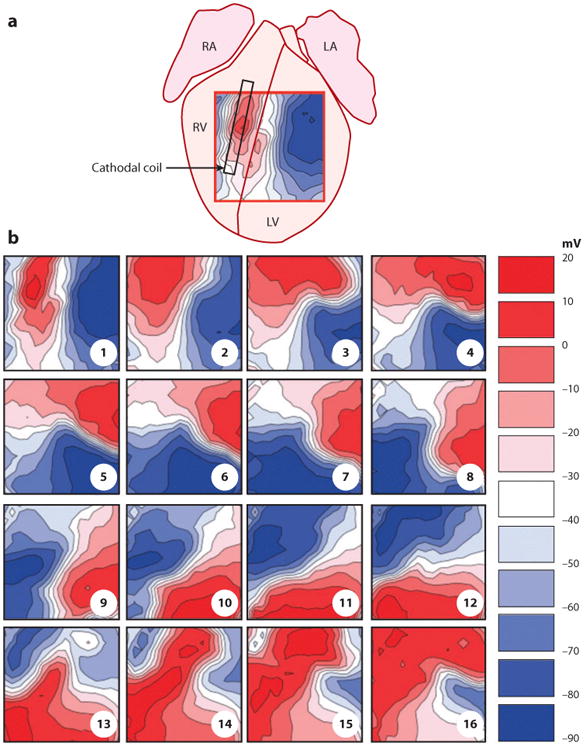
Transmembrane voltage after a failed defibrillation shock demonstrates the development of a virtual anode and cathode. (a) Approximate location of mapped area on the anterior surface of an optically mapped rabbit heart. RA, right atrium; LA, left atrium; RV, right ventricle; LV, left ventricle. (b) Each frame is 10 ms apart, starting from the first sample recorded after the end of the −100 V monophasic defibrillation shock. The virtual cathode (red) creates a wavefront that rapidly travels through the virtual anode (blue), which then reenters and reactivates the area originally occupied by the virtual cathode (62).
Critical Points
Electrical shocks delivered during a critical repolarization portion of the cardiac cycle termed the vulnerable period can lead to VF (63). More than 100 years ago, it was observed that there is an upper limit of stimulus strength above which VF will not be induced, also known as the upper limit of vulnerability (ULV) (64). Subsequent experiments demonstrated that the ULV and the defibrillation threshold (DFT) are closely related and that many of the mechanisms responsible for the initiation of VF by a shock in the vulnerable period are also active during defibrillation shocks (65–70). These considerations led to the ULV hypothesis, which states that for a shock to successfully terminate VF, it must alter the transmembrane potential throughout the myocardium in such a way that the wavefronts of VF are halted, yet new wavefronts that can reinitiate VF are not induced (69). These realizations led to the development of the critical point theory of defibrillation, which suggested that reentry was initiated at the intersection of critical points of local field strength and tissue with critical levels of recovery (68, 71).
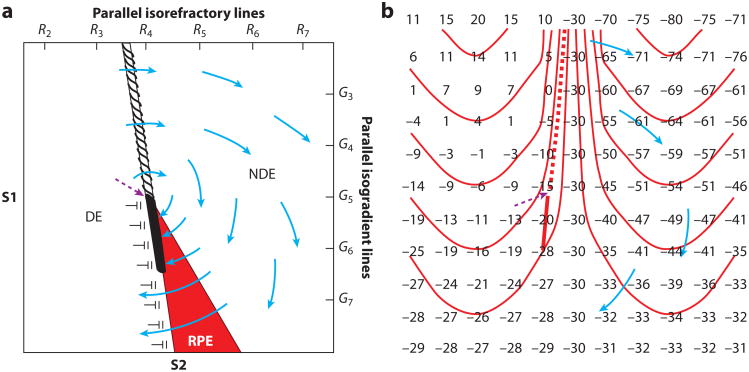
In many of the optical and electrical mapping studies that have attempted to determine the mechanism by which shocks give rise to action potentials that reinitiate VF, the shocks were not given during VF but during phase 2 or phase 3 of the action potential of paced rhythm (54, 71–74). These shocks were observed to induce reentry that degenerated into VF by the creation of a critical point (Figure 12). One type of critical point was formed during phase 3 of the action potential by the intersection of a spatial gradation of refractoriness with a spatial gradation of the extracellular ∇V field created by the shock (Figure 12a) (71, 75). Electrical mapping revealed that an activation front after the shock formed a rotor whose core was at this critical point. This rotor either terminated after a few cycles or was sustained long enough that secondary reentry occurred and led to degeneration into VF. The critical values of the ∇V and refractoriness are different for different waveforms (76). The waveforms with the lowest DFT are those with critical points in which the critical values of both the shock ∇V and the degree of refractoriness are low. It was hypothesized that the advantage of the low ∇V is that it can be obtained with a smaller shock, whereas the advantage of the lower degree of refractoriness is that the reentry core is in more recovered tissue, perhaps increasing the likelihood that the rotor will halt spontaneously before VF develops (76). Of all the waveforms tested, the one that best met both of these criteria was a biphasic waveform in which each phase is 4 ms long.
Figure 12.
Two types of hypothesized critical points. (a) An idealized diagram is shown with a critical point (dashed purple arrow) formed at the intersection of a critical shock ∇V of G5 and a critical tissue refractoriness of R4. S1 pacing is performed from the left to cause a dispersion of refractoriness at the time of the S2 shock with R2 representing less and R7 more refractoriness. The S2 shock is given during the vulnerable period from the bottom of the region with large gradient G7 at the bottom and small gradient G3 at the top. The area on the left is sufficiently recovered so that it is directly excited (DE) by the gradient field. The area in the red region, although exposed to a higher gradient, is more refractory and undergoes refractory period extension (RPE), such that unidirectional block occurs from DE to RPE and activation in the DE tissue cannot propagate through this region. The region on the right is too refractory to be affected even with a large gradient and is not directly excited (NDE). Thus, propagation conducts unidirectionally from the DE to the NDE region at the top, encircling the critical point in a clockwise direction and reentering the DE region to create a reentrant circuit. (b) An idealized diagram is shown of a critical point (dashed purple arrow) caused by adjacent regions of depolarized and hyperpolarized transmembrane potential changes caused by the shock. Numbers represent transmembrane potentials at the end of the shock with isolines spaced every 10 mV beginning at −45 mV. The depolarized region (upper left) and the hyperpolarized region (upper right) are separated by a zone with a large gradient of membrane polarization, as indicated by the closely spaced isolines. The depolarized tissue in this zone is able to activate the adjacent hyperpolarized tissue to launch an activation front (dashed line) that propagates through the hyperpolarized region (blue arrows). Below, where the gradient in transmembrane potential is smaller, propagation cannot occur. A critical point is formed at the intersection of the frame and block lines where one end of the propagating activation front terminates in both panels. In both panels, the solid line represents the site of conduction block, and the dashed line indicates the location of the region from which an activation front is launched after the shock (108).
The important variable in the other type of critical point is the pattern of the virtual electrodes of hyperpolarization and depolarization caused by the shock, not the strength of the shock ∇V or the degree of refractoriness as in the first type of critical point (54, 74). Within the hyperpolarized region, even though it is in phase 2 of the action potential and so is in its absolute refractory period, the myocardium is “deexcited” so that its action potential is truncated and excitability is restored. This restoration of excitability allows the adjacent depolarized region to activate the hyperpolarized tissue, giving rise to an activation front that forms a rotor around a critical point formed where the adjacent hyperpolarization and depolarization decrease to the point that a postshock activation front is not initiated (Figure 12b). Thus, although the virtual electrodes are necessary to halt the fibrillatory activation fronts present at the time of the shock, the activation front formed in the deexcited region after the shock can lead to the reinitiation of reentry and the failure of the shock to defibrillate (54, 74). Efimov and coworkers (54) proposed that a biphasic waveform is better able to defibrillate because the second phase of the shock restores the ΔVm back toward the transmembrane potential levels before the shock, thus obliterating the virtual electrodes and preventing the launch of an activation front after the shock in the hyperpolarized region (Figure 13) (54).
Figure 13.
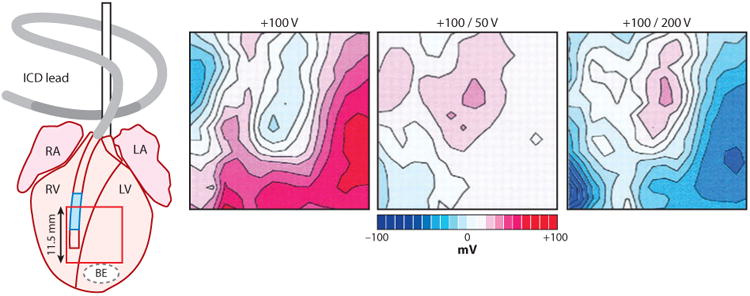
The spatial pattern of polarization at the end of the shock produced by a monophasic shock (+100 V, seventh ms of an 8-ms shock), optimal biphasic shock with more charge in the first than in the second phase (+100/−50 V, fifteenth ms of a 16-ms shock), and nonoptimal biphasic shock with less charge in the first than in the second phase (+100/−200 V, fifteenth ms of a 16-ms shock). The shocking electrodes were in the RV and above the right atrium, labeled ICD lead. The area from which the optical recordings were made is shown by the red box on the rabbit heart diagram. Values of polarization are shown relative to the preshock transmembrane voltage, with various gray levels assigned to positive and negative polarization, and white to areas of no polarization. RA, right atrium; LA, left atrium; RV, right ventricle; LV, left ventricle; BE, bipolar electrode (109).
With one exception (54), epicardial and intramural electrical and optical mapping studies in which shocks of a strength near the DFT were given during VF did not observe either of the types of critical points that were seen with shocks of a strength near the VF threshold during paced rhythm (77–80). Instead, activation arose focally and spread away in all directions to activate the entire myocardium (Figure 14). In those episodes when the shock failed to defibrillate, these foci arose rapidly and repetitively for more than three cycles, after which activation fronts degenerated back into VF. If the foci only lasted for one or two cycles, VF was not reinitiated and the shock succeeded.
Figure 14.
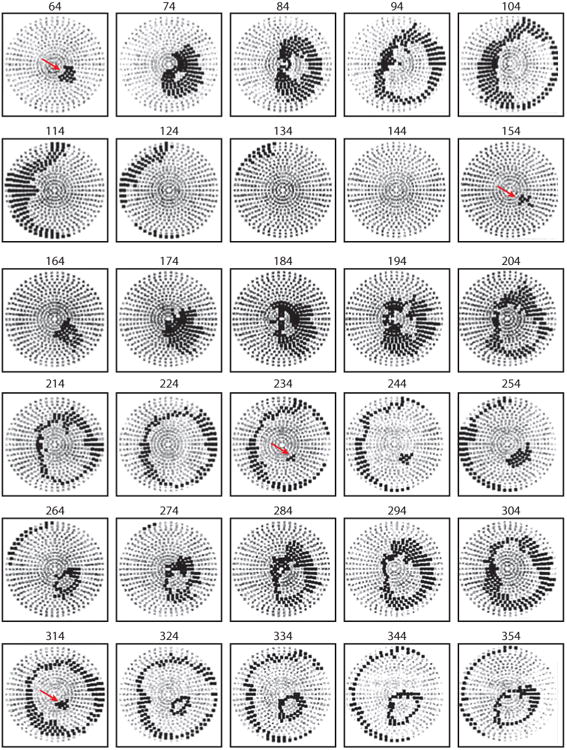
Example of postshock cycles after a failed shock of a strength near the DFT delivered from electrodes in the RV apex and the superior vena cava. Recordings were made simultaneously from 504 electrodes distributed globally over the ventricular epicardium of a pig. Electrode sites are indicated in gray on a polar projection with the atrioventricular groove at the periphery and the LV apex in the center. Anterior is at the bottom of the projection, and the LV is to the right. Each panel shows in black the electrode sites at which an activation occurred at any time during a 10-ms interval. Numbers above the panels indicate the start of each 10-ms interval relative to the shock onset. Red arrows indicate the site of earliest recorded activation from each cycle. The first cycle appeared on the epicardium 64 ms after the shock at the anteroapical left ventricle. The second cycle (154 ms) arose on the epicardium in the same region as the first cycle and also propagated away in a focal pattern. The third (235-ms) and fourth (315-ms) cycles arose before the activation front from the previous cycle disappeared (78).
In summary, critical points are formed by a combination of the field gradients and the underlying refractoriness of the tissue. Reentry and refibrillation may occur at sites far from electrodes if the appropriate conditions are met.
Isoelectric Window
Although the earliest activation appears almost immediately after the shock for the two types of critical points shown in Figure 12, the first postshock focus is not observed by epicardial electrical or optical mapping techniques for approximately 50 to 90 ms after the shock (Figure 14) (78, 81). To eliminate the possibility that intramural reentry or activation could be occurring during this epicardial isoelectric window, transmural activation was mapped following near-DFT strength shocks (79). Transmural mapping confirmed that there was a period of 58 ± 23 ms (mean ± standard deviation) before the first postshock activation and that these activations proceeded from a focus. It is possible that this focus arose either from a propagated graded response or from triggered activity. Because of the long interval from the shock until the first focal activity is observed, it has been hypothesized that this triggered activity is a delayed afterdepolarization (80). However, a study using pinacidil (early afterdepolarization inhibitor) and flunarizine (delayed afterdepolarization inhibitor) showed no significant change in DFT, isoelectric window, or first activation location (82). Also, some data suggest that these delayed foci arise from a slow propagated graded response (83, 84). However, if these foci do arise from a delayed afterdepolarization, then the mechanism by which a biphasic waveform has a lower DFT than a monophasic waveform may be that it causes less postshock action potential prolongation, because an increased action potential duration increases the likelihood of delayed afterdepolarizations (85).
Recent modeling work has suggested that the first postshock activation initiates deep within the ventricular wall due to virtual electrodes (86, 87). This activation then “tunnels” through an excitable pathway and eventually blocks or emerges as and epicardial focus. The isoelectric window is therefore an artifact of the inability to record activation transmurally throughout much of the heart.
Another possible source for the isoelectric window is that activation is present in the specialized conduction system during this time of propagation through the Purkinje-muscle junction into the working myocardium at the end of the isoelectric window. A recent study demonstrated that the Purkinje system is active during the first postshock cycle, but the authors were unable to determine if activation initiated within the specialized conduction system or propagated retrogradely into it from the working myocardium (88). A subsequent study demonstrated that the first postshock activation typically initiated in the working myocardium following periods of short duration VF (<1 min), while the first postshock activation initiated in the Purkinje system following a period of long duration VF (>1 min) (89). Recent evidence has shown that VF evolves as it progresses over several minutes (90, 91), so that the mechanisms of maintenance for short-duration VF (SDVF) and for VF lasting longer than 1 min (long-duration VF, or LDVF) may differ (92–94). This difference in first postshock activation activity suggests that there may be important differences in the mechanisms of defibrillation as well after periods of prolonged VF. Further studies are warranted into the mechanisms of defibrillation in periods of prolonged VF (5–10 min), as seen clinically in patients with sudden cardiac arrest and death.
Alternative Strategies for Terminating Ventricular Fibrillation
The most effective strategy for terminating VF is with a large electric shock. Rapid pacing is often used to terminate ventricular tachycardias so that a shock is not necessary. Rapid pacing in fibrillating canine (95, 96) and human atria (97, 98) and in porcine ventricles (99, 100) has not been shown to terminate fibrillation but has demonstrated capture and entrainment of fibrillating tissue in the region around the pacing site. These studies involved fixed pacing algorithms that were not adapted to the characteristics of the fibrillating tissue. Other studies have attempted to use adaptive pacing techniques. Chaos-control feedback has been proposed and tested with limited success to suppress arrhythmias in small pieces of rabbit ventricle (101) and human atria (102, 103). A variety of adaptive pacing algorithms have been tested in fibrillating porcine ventricles, but the choice of algorithm had little bearing on the amount of capture that was achievable (104). Pace termination of VF would increase device battery life and cause less tissue damage. However, success with this technique to halt VF or to lower the DFT for a shock has been minimal.
Future Challenges
Questions remain regarding the source of the first postshock activation and the isoelectric window. There is also disagreement in the literature as to whether debrillation shocks themselves damage the heart. There are limited studies that investigate the mechanisms of defibrillation following long-duration VF, and there may be significant changes in the mechanisms of VF during the global ischemia in long-duration VF.
Time preceding a defibrillation shock is one of the greatest determinants of patient outcome. The probability of survival from an episode of VF decreases by approximately 10% per minute, with few patients surviving episodes of VF that last more than 10 min. Consequently, minimizing time to defibrillation through community awareness and access to defibrillators will likely lead to increased survival in VF patients.
There has been debate as to whether patients with VF should receive chest compressions preceding defibrillation shocks or whether shocks should be delivered as soon as possible. Refibrillation following successful defibrillation is common and is negatively associated with VF survival (105).
Lower-energy defibrillation for implantable cardioverter defibrillators continues to be an area of research aiming to prolong battery life and to reduce possible damage from the high current density immediately surrounding shocking coils. Low-threshold atrial DFTs may possibly reopen the door to device therapy for atrial defibrillation, although current device configurations have proven still too painful to be well tolerated by unsedated patients (106).
Conclusion
Optical and electrical mapping techniques have improved our understanding of the cellular, tissue, and whole-organ mechanisms responsible for defibrillation. Shocks induce a change in transmembrane potential in myocytes that leads to termination of VF wavefronts. Microscopic tissue-level discontinuities such as myocyte bundles, collagenous septae, and blood vessels create secondary sources that allow shocks to activate cardiac tissue distant from the electrodes. Critical points of shock strength and recovering tissue created by shocks and critical points of virtual electrodes may determine if and how shocks cause new activation fronts that reinitiate VF.
Acknowledgments
This work has in part been supported by National Institutes of Health Research Grants HL42760, HL85370, K99HL091138, and HL67748. Jack Rogers provided valuable expert advice during the preparation of this review.
Glossary
- VF
ventricular fibrillation
- Vm
transmembrane potential
- APA
action potential amplitude
- DFT
defibrillation threshold
Footnotes
Disclosure Statement: The authors are not aware of any affiliations, memberships, funding, or financial holdings that might be perceived as affecting the objectivity of this review.
Literature Cited
- 1.Hoffa M, Ludwig C. Einige neue Versuche über Herzebewegung. Z Ration Med. 1850;9:107–44. [Google Scholar]
- 2.Prevost JL, Battelli F. Sur quelques effets des décharges électriques sur le coeur des Mammifères. C R Acad Sci. 1899;129:1267–68. [Google Scholar]
- 3.Beck CS, Pritchard WH, Feil HS. Ventricular fibrillation of long duration abolished by electric shock. JAMA. 1947;135:985–86. doi: 10.1001/jama.1947.62890150005007a. [DOI] [PubMed] [Google Scholar]
- 4.Zoll PM, Linenthal AJ, Gibson W, Paul MH, Norman LR. Termination of ventricular fibrillation in man by externally applied electric countershock. N Engl J Med. 1956;254:727–32. doi: 10.1056/NEJM195604192541601. [DOI] [PubMed] [Google Scholar]
- 5.Zipes DP, Fischer J, King RM, Nicoll A, Jolly WW. Termination of ventricular fibrillation in dogs by depolarizing a critical amount of myocardium. Am J Cardiol. 1975;36:37–44. doi: 10.1016/0002-9149(75)90865-6. [DOI] [PubMed] [Google Scholar]
- 6.Dudel J. Elektrophysiologische Grundlagen der Defibrillation und künstlichen Stimulation des Herzens. Med Klin. 1968;63:2089–91. [PubMed] [Google Scholar]
- 7.Mower MM, Mirowski M, Spear JF, Moore EN. Patterns of ventricular activity during catheter defibrillation. Circulation. 1974;49:858–61. doi: 10.1161/01.cir.49.5.858. [DOI] [PubMed] [Google Scholar]
- 8.Weidmann S. Electrical constants of trabecular muscle from mammalian heart. J Physiol. 1970;210:1041–54. doi: 10.1113/jphysiol.1970.sp009256. [DOI] [PMC free article] [PubMed] [Google Scholar]
- 9.Weidmann S. The electrical constants of Purkinje fibres. J Physiol. 1952;118:348–60. doi: 10.1113/jphysiol.1952.sp004799. [DOI] [PMC free article] [PubMed] [Google Scholar]
- 10.Akar FG, Roth BJ, Rosenbaum DS. Optical measurement of cell-to-cell coupling in intact heart using subthreshold electrical stimulation. Am J Physiol Heart Circ Physiol. 2001;281:H533–42. doi: 10.1152/ajpheart.2001.281.2.H533. [DOI] [PubMed] [Google Scholar]
- 11.Knisley SB, Blitchington TF, Hill BC, Grant AO, Smith WM, et al. Optical measurements of transmembrane potential changes during electric field stimulation of ventricular cells. Circ Res. 1993;72:255–70. doi: 10.1161/01.res.72.2.255. [DOI] [PubMed] [Google Scholar]
- 12.Windisch H, Ahammer H, Schaffer P, et al. Optical multisite monitoring of cell excitation phenomenon in isolated cardiomyocytes. Pflüg Arch. 1995;430:508–18. doi: 10.1007/BF00373887. [DOI] [PubMed] [Google Scholar]
- 13.Cheng DK, Tung L, Sobie EA. Nonuniform responses of transmembrane potential during electric field stimulation of single cardiac cells. Am J Physiol. 1999;277:H351–62. doi: 10.1152/ajpheart.1999.277.1.H351. [DOI] [PubMed] [Google Scholar]
- 14.Evans FG, Ideker RE, Gray RA. Effect of shock-induced changes in transmembrane potential on reentrant waves and outcome during cardioversion of isolated rabbit hearts. J Cardiovasc Electrophysiol. 2002;13:1118–27. doi: 10.1046/j.1540-8167.2002.01118.x. [DOI] [PubMed] [Google Scholar]
- 15.Efimov IR, Gray RA, Roth BJ. Virtual electrodes and deexcitation: new insights into fibrillation induction and defibrillation. J Cardiovasc Electrophysiol. 2000;11:339–53. doi: 10.1111/j.1540-8167.2000.tb01805.x. [DOI] [PubMed] [Google Scholar]
- 16.Knisley SB, Smith WM, Ideker RE. Effect of field stimulation on cellular repolarization in rabbit myocardium. Implications for reentry induction. Circ Res. 1992;70:707–15. doi: 10.1161/01.res.70.4.707. [DOI] [PubMed] [Google Scholar]
- 17.Newton JC, Knisley SB, Zhou X, Pollard AE, Ideker RE. Review of mechanisms by which electrical stimulation alters the transmembrane potential. J Cardiovasc Electrophysiol. 1999;10:234–43. doi: 10.1111/j.1540-8167.1999.tb00666.x. [DOI] [PubMed] [Google Scholar]
- 18.Gillis AM, Fast VG, Rohr S, Kleber AG. Mechanism of ventricular defibrillation. The role of tissue geometry in the changes in transmembrane potential in patterned myocyte cultures. Circulation. 2000;101:2438–45. doi: 10.1161/01.cir.101.20.2438. [DOI] [PubMed] [Google Scholar]
- 19.Gillis AM, Fast VG, Rohr S, Kleber AG. Spatial changes in transmembrane potential during extracellular electrical shocks in cultured monolayers of neonatal rat ventricular myocytes. Circ Res. 1996;79:676–90. doi: 10.1161/01.res.79.4.676. [DOI] [PubMed] [Google Scholar]
- 20.Sharma V, Tung L. Theoretical and experimental study of sawtooth effect in isolated cardiac cell-pairs. J Cardiovasc Electrophysiol. 2001;12:1164–73. doi: 10.1046/j.1540-8167.2001.01164.x. [DOI] [PubMed] [Google Scholar]
- 21.Fast VG, Kléber AG. Microscopic conduction in cultured strands of neonatal rat heart cells measured with voltage-sensitive dyes. Circ Res. 1993;73:914–25. doi: 10.1161/01.res.73.5.914. [DOI] [PubMed] [Google Scholar]
- 22.Fast VG, Darrow BJ, Saffitz JE, Kleber AG. Anisotropic activation spread in heart cell monolayers assessed by high-resolution optical mapping. Role of tissue discontinuities. Circ Res. 1996;79:115–27. doi: 10.1161/01.res.79.1.115. [DOI] [PubMed] [Google Scholar]
- 23.Zhou X, Knisley SB, Smith WM, Rollins D, Pollard AE, Ideker RE. Spatial changes in the transmembrane potential during extracellular electrical stimulation. Circ Res. 1998;83:1003–14. doi: 10.1161/01.res.83.10.1003. [DOI] [PubMed] [Google Scholar]
- 24.Windisch H, Platzer D, Bilgici E. Quantification of shock-induced microscopic virtual electrodes assessed by subcellular resolution optical potential mapping in guinea pig papillary muscle. J Cardiovasc Electrophysiol. 2007;18:1086–94. doi: 10.1111/j.1540-8167.2007.00908.x. [DOI] [PubMed] [Google Scholar]
- 25.Fishler MG. Syncytial heterogeneity as a mechanism underlying cardiac far-field stimulation during defibrillation-level shocks. J Cardiovasc Electrophysiol. 1998;9:384–94. doi: 10.1111/j.1540-8167.1998.tb00926.x. [DOI] [PubMed] [Google Scholar]
- 26.Fishler MG, Vepa K. Spatiotemporal effects of syncytial heterogeneities on cardiac far-field excitations during monophasic and biphasic shocks. J Cardiovasc Electrophysiol. 1998;9:1310–24. doi: 10.1111/j.1540-8167.1998.tb00107.x. [DOI] [PubMed] [Google Scholar]
- 27.Krassowska W. Field stimulation of cardiac fibers with random spatial structure. IEEE Trans Biomed Eng. 2003;50:33–40. doi: 10.1109/TBME.2002.807324. [DOI] [PubMed] [Google Scholar]
- 28.Spach MS, Miller WT, III, Geselowitz DB, Barr RC, Kootsey JM, Johnson EA. The discontinuous nature of propagation in normal canine cardiac muscle. Evidence for recurrent discontinuities of intracellular resistance that affect the membrane currents. Circ Res. 1981;48:39–54. doi: 10.1161/01.res.48.1.39. [DOI] [PubMed] [Google Scholar]
- 29.Spach MS, Heidlage JF, Dolber PC, Barr RC. Extracellular discontinuities in cardiac muscle: evidence for capillary effects on the action potential foot. Circ Res. 1998;83:1144–64. doi: 10.1161/01.res.83.11.1144. [DOI] [PubMed] [Google Scholar]
- 30.Pertsov A. Scale of geometric structures responsible for discontinuous propagation in myocardial tissue. In: Spooner PM, Joyner RW, Jalife J, editors. Discontinuous Conduction in the Heart. Armonk, NY: Futura Publ; 1997. pp. 273–93. [Google Scholar]
- 31.Fast VG, Rohr S, Gillis AM, Kleber AG. Activation of cardiac tissue by extracellular electrical shocks: formation of ‘secondary sources’ at intercellular clefts in monolayers of cultured myocytes. Circ Res. 1998;82:375–85. doi: 10.1161/01.res.82.3.375. [DOI] [PubMed] [Google Scholar]
- 32.White JB, Walcott GP, Pollard AE, Ideker RE. Myocardial discontinuities: a substrate for producing virtual electrodes to increase directly excited areas of the myocardium by shocks. Circulation. 1998;97:1738–45. doi: 10.1161/01.cir.97.17.1738. [DOI] [PubMed] [Google Scholar]
- 33.Sommer JR, Scherer B. Geometry of cell and bundle appositions in cardiac muscle: light microscopy. Am J Physiol. 1985;248:H792–803. doi: 10.1152/ajpheart.1985.248.6.H792. [DOI] [PubMed] [Google Scholar]
- 34.LeGrice IJ, Smaill BH, Chai LZ, Edgar SG, Gavin JB, Hunter PJ. Laminar structure of the heart ventricular myocyte arrangement and connective tissue architecture in the dog. Am J Physiol. 1995;269:H571–82. doi: 10.1152/ajpheart.1995.269.2.H571. [DOI] [PubMed] [Google Scholar]
- 35.Zhou X, Rollins DL, Smith WM, Ideker RE. Responses of the transmembrane potential of myocardial cells during a shock. J Cardiovasc Electrophysiol. 1995;6:252–63. doi: 10.1111/j.1540-8167.1995.tb00397.x. [DOI] [PubMed] [Google Scholar]
- 36.Zhou X, Smith WM, Rollins DL, Ideker RE. Transmembrane potential changes caused by shocks in guinea pig papillary muscle. Am J Physiol. 1996;271:H2536–46. doi: 10.1152/ajpheart.1996.271.6.H2536. [DOI] [PubMed] [Google Scholar]
- 37.Fast VG, Cheek ER. Optical mapping of arrhythmias induced by strong electrical shocks in myocyte cultures. Circ Res. 2002;90:664–70. doi: 10.1161/01.res.0000013403.24495.cc. [DOI] [PubMed] [Google Scholar]
- 38.Nikolski VP, Sambelashvili AT, Krinsky VI, Efimov IR. Effects of electroporation on optically recorded transmembrane potential responses to high-intensity electrical shocks. Am J Physiol Heart Circ Physiol. 2004;286:H412–18. doi: 10.1152/ajpheart.00689.2003. [DOI] [PubMed] [Google Scholar]
- 39.Hooks DA, Tomlinson KA, Marsden SG, LeGrice IJ, Smaill BH, et al. Cardiac microstructure: implications for electrical propagation and defibrillation in the heart. Circ Res. 2002;91:331–38. doi: 10.1161/01.res.0000031957.70034.89. [DOI] [PubMed] [Google Scholar]
- 40.Sobie EA, Susil RC, Tung L. A generalized activating function for predicting virtual electrodes in cardiac tissue. Biophys J. 1997;73:1410–23. doi: 10.1016/S0006-3495(97)78173-6. [DOI] [PMC free article] [PubMed] [Google Scholar]
- 41.Young AA, Legrice IJ, Young MA, Smaill BH. Extended confocal microscopy of myocardial laminae and collagen network. J Microsc. 1998;192:139–50. doi: 10.1046/j.1365-2818.1998.00414.x. [DOI] [PubMed] [Google Scholar]
- 42.Fast VG, Sharifov OF, Cheek ER, Newton JC, Ideker RE. Intramural virtual electrodes during de-fibrillation shocks in left ventricular wall assessed by optical mapping of membrane potential. Circulation. 2002;106:1007–14. doi: 10.1161/01.cir.0000027103.54792.9c. [DOI] [PubMed] [Google Scholar]
- 43.Sharifov OF, Fast VG. Optical mapping of transmural activation induced by electrical shocks in isolated left ventricular wall wedge preparations. J Cardiovasc Electrophysiol. 2003;14:1215–22. doi: 10.1046/j.1540-8167.2003.03188.x. [DOI] [PubMed] [Google Scholar]
- 44.Sharifov OF, Ideker RE, Fast VG. High-resolution optical mapping of intramural virtual electrodes in porcine left ventricular wall. Cardiovasc Res. 2004;64:448–56. doi: 10.1016/j.cardiores.2004.07.016. [DOI] [PubMed] [Google Scholar]
- 45.Sharifov OF, Fast VG. Intramural virtual electrodes in ventricular wall: effects on epicardial polarizations. Circulation. 2004;109:2349–56. doi: 10.1161/01.CIR.0000127962.74368.D9. [DOI] [PubMed] [Google Scholar]
- 46.Trayanova N, Roth BJ. Presented at Comput Cardiol. Los Alamitos, CA: 1992. Cardiac tissue in an electric field: a study of electrical stimulation. [Google Scholar]
- 47.Trayanova NA, Roth BJ, Malden LJ. The response of a spherical heart to a uniform electric field: a bidomain analysis of cardiac stimulation. IEEE Trans Biomed Eng. 1993;40:899–908. doi: 10.1109/10.245611. [DOI] [PubMed] [Google Scholar]
- 48.Trayanova N, Plank G, Rodriguez B. What have we learned from mathematical models of defibrillation and postshock arrhythmogenesis? Application of bidomain simulations. Heart Rhythm. 2006;3:1232–35. doi: 10.1016/j.hrthm.2006.04.015. [DOI] [PMC free article] [PubMed] [Google Scholar]
- 49.Cheek ER, Ideker RE, Fast VG. Nonlinear changes of transmembrane potential during defibrillation shocks: role of Ca2+ current. Circ Res. 2000;87:453–59. doi: 10.1161/01.res.87.6.453. [DOI] [PubMed] [Google Scholar]
- 50.Yuan W, Ginsburg KS, Bers DM. Comparison of sarcolemmal calcium channel current in rabbit and rat ventricular myocytes. J Physiol. 1996;493(Part 3):733–46. doi: 10.1113/jphysiol.1996.sp021418. [DOI] [PMC free article] [PubMed] [Google Scholar]
- 51.Gomez JP, Potreau D, Branka JE, Raymond G. Developmental changes in Ca2+ currents from newborn rat cardiomyocytes in primary culture. Pflüg Arch. 1994;428:241–49. doi: 10.1007/BF00724503. [DOI] [PubMed] [Google Scholar]
- 52.Fast V, Cheek ER, Pollard A, Ideker R. Effects of electrical shocks on Cai2+ and Vm in myocyte cultures. Circ Res. 2004;94:1589–97. doi: 10.1161/01.RES.0000132746.94360.8b. [DOI] [PubMed] [Google Scholar]
- 53.Huizar JF, Warren MD, Shvedko AG, Kalifa J, Moreno J, et al. Three distinct phases of VF during global ischemia in the isolated blood-perfused pig heart. Am J Physiol Heart Circ Physiol. 2007;293:H1617–28. doi: 10.1152/ajpheart.00130.2007. [DOI] [PubMed] [Google Scholar]
- 54.Efimov IR, Cheng Y, Van Wagoner DR, Mazgalev T, Tchou PJ. Virtual electrode-induced phase singularity: a basic mechanism of defibrillation failure. Circ Res. 1998;82:918–25. doi: 10.1161/01.res.82.8.918. [DOI] [PubMed] [Google Scholar]
- 55.Yu H, Chang F, Cohen IS. Pacemaker current i(f) in adult canine cardiac ventricular myocytes. J Physiol. 1995;485(Part 2):469–83. doi: 10.1113/jphysiol.1995.sp020743. [DOI] [PMC free article] [PubMed] [Google Scholar]
- 56.Ranjan R, Chiamvimonvat N, Thakor NV, Tomaselli GF, Marban E. Mechanism of anode break stimulation in the heart. Biophys J. 1998;74:1850–63. doi: 10.1016/S0006-3495(98)77895-6. [DOI] [PMC free article] [PubMed] [Google Scholar]
- 57.Cheek ER, Fast VG. Nonlinear changes of transmembrane potential during electrical shocks: role of membrane electroporation. Circ Res. 2004;94:208–14. doi: 10.1161/01.RES.0000111526.69133.DE. [DOI] [PubMed] [Google Scholar]
- 58.Roth BJ. A mathematical model of make and break electrical stimulation of cardiac tissue by a unipolar anode or cathode. IEEE Trans Biomed Eng. 1995;42:1174–84. doi: 10.1109/10.476124. [DOI] [PubMed] [Google Scholar]
- 59.Wikswo JP, Jr, Lin SF, Abbas RA. Virtual electrodes in cardiac tissue: a common mechanism for anodal and cathodal stimulation. Biophys J. 1995;69:2195–210. doi: 10.1016/S0006-3495(95)80115-3. [DOI] [PMC free article] [PubMed] [Google Scholar]
- 60.Efimov IR, Cheng Y, Yamanouchi Y, Tchou PJ. Direct evidence of the role of virtual electrode-induced phase singularity in success and failure of defibrillation. J Cardiovasc Electrophysiol. 2000;11:861–68. doi: 10.1111/j.1540-8167.2000.tb00065.x. [DOI] [PubMed] [Google Scholar]
- 61.Chen PS, Shibata N, Dixon EG, Wolf PD, Danieley ND, et al. Activation during ventricular defibrillation in open-chest dogs. Evidence of complete cessation and regeneration of ventricular fibrillation after unsuccessful shocks. J Clin Investig. 1986;77:810–23. doi: 10.1172/JCI112378. [DOI] [PMC free article] [PubMed] [Google Scholar]
- 62.Kroll MW, Efimov IR, Tchou PJ. Present understanding of shock polarity for internal defibrillation: the obvious and nonobvious clinical implications. Pacing Clin Electrophysiol. 2006;29:885–91. doi: 10.1111/j.1540-8159.2006.00456.x. [DOI] [PubMed] [Google Scholar]
- 63.Wiggers CJ, Wégria R. Ventricular fibrillation due to single, localized induction and condenser shocks applied during the vulnerable phase of ventricular systole. Am J Physiol. 1940;128:500–5. [Google Scholar]
- 64.Battelli F. Le mécanisme de la mort par les courants électriques chez l'homme. Rev Méd Suisse Romande. 1899;10:605–18. [Google Scholar]
- 65.Chen PS, Shibata N, Dixon EG, Martin RO, Ideker RE. Comparison of the defibrillation threshold and the upper limit of ventricular vulnerability. Circulation. 1986;73:1022–28. doi: 10.1161/01.cir.73.5.1022. [DOI] [PubMed] [Google Scholar]
- 66.Souza JJ, Malkin RA, Ideker RE. Comparison of upper limit of vulnerability and and defibrillation probability of success curves using a nonthoracotomy lead system. Circulation. 1995;91:1247–52. doi: 10.1161/01.cir.91.4.1247. [DOI] [PubMed] [Google Scholar]
- 67.Malkin RA, Souza JJ, Ideker RE. The ventricular defibrillation and upper limit of vulnerability dose-response curves. J Cardiovasc Electrophysiol. 1997;8:895–903. doi: 10.1111/j.1540-8167.1997.tb00851.x. [DOI] [PubMed] [Google Scholar]
- 68.Walcott GP, Walcott KT, Ideker RE. Mechanisms of defibrillation. Critical points and the upper limit of vulnerability. J Electrocardiol. 1995;28(Suppl):1–6. doi: 10.1016/s0022-0736(95)80001-8. [DOI] [PubMed] [Google Scholar]
- 69.Fabiato A, Coumel P, Gourgon R, Saumont R. Le seuil de réponse synchrone des fibres myocardiques. Application à la comparaison expérimentale de l';efficacité des différentes formes de chocs électriques de défibrillation. ARCHMAL. 1967;60:527–44. [PubMed] [Google Scholar]
- 70.Chen PS, Feld GK, Kriett JM, Mower MM, Tarazi RY, et al. Relation between upper limit of vulnerability and defibrillation threshold in humans. Circulation. 1993;88:186–92. doi: 10.1161/01.cir.88.1.186. [DOI] [PubMed] [Google Scholar]
- 71.Frazier DW, Wolf PD, Wharton JM, Tang ASL, Smith WM, Ideker RE. Stimulus-induced critical point: mechanism for electrical initiation of reentry in normal canine myocardium. J Clin Investig. 1989;83:1039–52. doi: 10.1172/JCI113945. [DOI] [PMC free article] [PubMed] [Google Scholar]
- 72.Idriss SF, Wolf PD, Smith WM, Ideker RE. Effect of pacing site on ventricular fibrillation initiation by shocks during the vulnerable period. Am J Physiol Heart Circ Physiol. 1999;277:H2065–82. doi: 10.1152/ajpheart.1999.277.5.H2065. [DOI] [PubMed] [Google Scholar]
- 73.Chattipakorn N, Rogers JM, Ideker RE. Influence of postshock epicardial activation patterns on initiation of ventricular fibrillation by upper limit of vulnerability shocks. Circulation. 2000;101:1329–36. doi: 10.1161/01.cir.101.11.1329. [DOI] [PubMed] [Google Scholar]
- 74.Efimov IR, Cheng YN, Biermann M, Van Wagoner DR, Mazgalev TN, Tchou PJ. Transmembrane voltage changes produced by real and virtual electrodes during monophasic defibrillation shocks delivered by an implantable electrode. J Cardiovasc Electrophysiol. 1997;8:1031–45. doi: 10.1111/j.1540-8167.1997.tb00627.x. [DOI] [PubMed] [Google Scholar]
- 75.Winfree AT. When Time Breaks Down: The Three-Dimensional Dynamics of Electrochemical Waves and Cardiac Arrhythmias. Princeton, NJ: Princeton Univ. Press; 1987. pp. 1–153. [Google Scholar]
- 76.Ideker RE, Alferness C, Melnick S, Sreenan KM, Johnson E, Smith WM. Reentry site during fibrillation induction in relation to defibrillation efficacy for different shock waveforms. J Cardiovasc Electrophysiol. 2001;12:581–91. doi: 10.1046/j.1540-8167.2001.00581.x. [DOI] [PubMed] [Google Scholar]
- 77.Usui M, Callihan RL, Walker RG, Walcott GP, Rollins DL, et al. Epicardial sock mapping following monophasic and biphasic shocks of equal voltage with an endocardial lead system. J Cardiovasc Electrophysiol. 1996;7:322–34. doi: 10.1111/j.1540-8167.1996.tb00533.x. [DOI] [PubMed] [Google Scholar]
- 78.Chattipakorn N, Fotuhi PC, Ideker RE. Prediction of defibrillation outcome by epicardial activation patterns following shocks near the defibrillation threshold. J Cardiovasc Electrophysiol. 2000;11:1014–21. doi: 10.1111/j.1540-8167.2000.tb00174.x. [DOI] [PubMed] [Google Scholar]
- 79.Chattipakorn N, Fotuhi PC, Chattipakorn SC, Ideker RE. Three-dimensional mapping of earliest activation after near-threshold ventricular defibrillation shocks. J Cardiovasc Electrophysiol. 2003;14:65–69. doi: 10.1046/j.1540-8167.2003.02397.x. [DOI] [PubMed] [Google Scholar]
- 80.Chattipakorn N, Banville I, Gray RA, Ideker RE. Mechanism of ventricular defibrillation for near-defibrillation threshold shocks: a whole heart optical mapping study in swine. Circulation. 2001;104:1313–19. doi: 10.1161/hc3601.094295. [DOI] [PubMed] [Google Scholar]
- 81.Chattipakorn N, Banville I, Gray RA, Ideker RE. Mechanisms of VF reinitiation after failed defibrillation shocks: an optical mapping study in isolated swine hearts. J Am Coll Cardiol. 2001;37:135A. doi: 10.1161/hc3601.094295. [DOI] [PubMed] [Google Scholar]
- 82.Zheng X, Walcott GP, Smith WM, Ideker RE. Evidence that activation following failed defibrillation is not caused by triggered activity. J Cardiovasc Electrophysiol. 2005;16:1200–5. doi: 10.1111/j.1540-8167.2005.50045.x. [DOI] [PubMed] [Google Scholar]
- 83.Gotoh M, Uchida T, Mandel WJ, Fishbein MC, Chen PS, Karaguezian HS. Cellular graded responses and ventricular vulnerability to reentry by a premature stimulus in isolated canine ventricle. Circulation. 1997;95:2141–54. doi: 10.1161/01.cir.95.8.2141. [DOI] [PubMed] [Google Scholar]
- 84.Eason J, Hillebrenner M, Campbell C, Trayanova N. Assessing shock efficacy as a function of arrhythmia complexity in a slab of the canine heart. Presented at Jt EMBS/BMES Conf., 2nd.; Houston, TX. 2002. [Google Scholar]
- 85.Henning B, Wit AL. The time course of action potential repolarization affects delayed afterdepolarization amplitude in atrial fibers of the canine coronary sinus. Circ Res. 1984;55:110–15. doi: 10.1161/01.res.55.1.110. [DOI] [PubMed] [Google Scholar]
- 86.Ashihara T, Constantino J, Trayanova NA. Tunnel propagation of postshock activations as a hypothesis for fibrillation induction and isoelectric window. Circ Res. 2008;102:737–45. doi: 10.1161/CIRCRESAHA.107.168112. [DOI] [PMC free article] [PubMed] [Google Scholar]
- 87.Constantino J, Long Y, Ashihara T, Trayanova NA. Tunnel propagation following defibrillation with ICD shocks: hidden postshock activations in the left ventricular wall underlie isoelectric window. Heart Rhythm. 2010 doi: 10.1016/j.hrthm.2010.03.026. In press. [DOI] [PMC free article] [PubMed] [Google Scholar]
- 88.Dosdall DJ, Cheng KA, Huang J, Allison JS, Allred JD, et al. Transmural and endocardial Purkinje activation in pigs before local myocardial activation after defibrillation shocks. Heart Rhythm. 2007;4:758–65. doi: 10.1016/j.hrthm.2007.02.017. [DOI] [PMC free article] [PubMed] [Google Scholar]
- 89.Dosdall DJ, Osorio J, Robichaux RP, Huang J, Li L, Ideker RE. Purkinje activation precedes myocardial activation following defibrillation after long-duration ventricular fibrillation. Heart Rhythm. 2010;7:405–12. doi: 10.1016/j.hrthm.2009.11.025. [DOI] [PMC free article] [PubMed] [Google Scholar]
- 90.Huang J, Rogers JM, Killingsworth CR, Singh KP, Smith WM, Ideker RE. Evolution of activation patterns during long-duration ventricular fibrillation in dogs. Am J Physiol Heart Circ Physiol. 2004;286:H1193–200. doi: 10.1152/ajpheart.00773.2003. [DOI] [PubMed] [Google Scholar]
- 91.Tovar OH, Jones JL. Electrophysiological deterioration during long-duration ventricular fibrillation. Circulation. 2000;102:2886–91. doi: 10.1161/01.cir.102.23.2886. [DOI] [PubMed] [Google Scholar]
- 92.Li L, Jin Q, Huang J, Cheng KA, Ideker RE. Intramural foci during long duration fibrillation in the pig ventricle. Circ Res. 2008;102:1256–64. doi: 10.1161/CIRCRESAHA.107.170399. [DOI] [PMC free article] [PubMed] [Google Scholar]
- 93.Ideker RE. Ventricular fibrillation: How do we put the genie back in the bottle? Heart Rhythm. 2007;4:665–74. doi: 10.1016/j.hrthm.2007.02.004. [DOI] [PubMed] [Google Scholar]
- 94.Tabereaux PB, Dosdall DJ, Ideker RE. Mechanisms of VF maintenance: wandering wavelets, mother rotors, or foci. Heart Rhythm. 2009;6:405–15. doi: 10.1016/j.hrthm.2008.11.005. [DOI] [PMC free article] [PubMed] [Google Scholar]
- 95.Allessie M, Kirchhof C, Scheffer GJ, Chorro F, Brugada J. Regional control of atrial fibrillation by rapid pacing in conscious dogs. Circulation. 1991;84:1689–97. doi: 10.1161/01.cir.84.4.1689. [DOI] [PubMed] [Google Scholar]
- 96.Kirchhof C, Chorro F, Scheffer GJ, Brugada J, Konings K, et al. Regional entrainment of atrial fibrillation studied by high-resolution mapping in open-chest dogs. Circulation. 1993;88:736–49. doi: 10.1161/01.cir.88.2.736. [DOI] [PubMed] [Google Scholar]
- 97.Daoud EG, Pariseau B, Niebauer M, Bogun F, Goyal R, et al. Response of type I atrial fibrillation to atrial pacing in humans. Circulation. 1996;94:1036–40. doi: 10.1161/01.cir.94.5.1036. [DOI] [PubMed] [Google Scholar]
- 98.Capucci A, Ravelli F, Nollo G, Montenero AS, Biffi M, Villani GQ. Capture window in human atrial fibrillation: evidence of an excitable gap. J Cardiovasc Electrophysiol. 1999;10:319–27. doi: 10.1111/j.1540-8167.1999.tb00678.x. [DOI] [PubMed] [Google Scholar]
- 99.KenKnight BH, Bayly PV, Gerstle RJ, Rollins DL, Wolf PD, et al. Regional capture of fibrillating ventricular myocardium. Evidence of an excitable gap. Circulation Res. 1995;77:849–55. doi: 10.1161/01.res.77.4.849. [DOI] [PubMed] [Google Scholar]
- 100.Newton JC, Huang J, Rogers JM, Rollins DL, Walcott GP, et al. Pacing during ventricular fibrillation: factors influencing the ability to capture. J Cardiovasc Electrophysiol. 2001;12:76–84. doi: 10.1046/j.1540-8167.2001.00076.x. [DOI] [PubMed] [Google Scholar]
- 101.Garfinkel A, Spano ML, Ditto WL, Weiss JN. Controlling cardiac chaos. Science. 1992;257:1230–35. doi: 10.1126/science.1519060. [DOI] [PubMed] [Google Scholar]
- 102.Ditto WL, Spano ML, In V, Neff J, Meadows B, et al. Control of human atrial fibrillation. Int J Bifurc Chaos Appl Sci Eng. 2000;10:593–601. [Google Scholar]
- 103.Gauthier DJ, Hall GM, Oliver RA, Dixon-Tulloch EG, Wolf PD, Bahar S. Progress toward controlling in vivo fibrillating sheep atria using a nonlinear-dynamics-based closed-loop feedback method. Chaos. 2002;12:952–61. doi: 10.1063/1.1494155. [DOI] [PubMed] [Google Scholar]
- 104.Johnson PL, Newton JC, Rollins DL, Smith WM, Ideker RE. Adaptive pacing during ventricular fibrillation. Pacing Clin Electrophysiol. 2003;26:1824–36. doi: 10.1046/j.1460-9592.2003.t01-1-00276.x. [DOI] [PubMed] [Google Scholar]
- 105.van Alem AP, Post J, Koster RW. VF recurrence: characteristics and patient outcome in out-of-hospital cardiac arrest. Resuscitation. 2003;59(2):181–88. doi: 10.1016/s0300-9572(03)00208-9. [DOI] [PubMed] [Google Scholar]
- 106.Dosdall DJ, Ideker RE. Intracardiac atrial defibrillation. Heart Rhythm. 2007;4(3 Suppl):S51–56. doi: 10.1016/j.hrthm.2006.12.030. [DOI] [PMC free article] [PubMed] [Google Scholar]
- 107.Fast VG, Rohr S, Ideker RE. Nonlinear changes of transmembrane potential caused by defibrillation shocks in strands of cultured myocytes. Am J Physiol Heart Circ Physiol. 2000;278:H688–97. doi: 10.1152/ajpheart.2000.278.3.H688. [DOI] [PubMed] [Google Scholar]
- 108.Chattipakorn N, Ideker RE. Mechanism of defibrillation. In: Aliot E, Clémenty J, Prystowsky EN, editors. Fighting Sudden Cardiac Death: A Worldwide Challenge. Armonk, NY: Futura Publ; 2000. pp. 593–615. [Google Scholar]
- 109.Efimov IR, Cheng Y, Van Wagoner DR, Mazgalev T, Tchou PJ. Virtual electrode-induced phase singularity: a basic mechanism of defibrillation failure. Circ Res. 1998;82:918–25. doi: 10.1161/01.res.82.8.918. [DOI] [PubMed] [Google Scholar]


