

Abstract
Mice with a deletion of the hypothalamic basic helix-loop-helix transcription factor Nhlh2 display adult onset obesity. We have previously shown that Nhlh2 expression is induced by leptin. In this study, we identify a small proximal leptin-responsive promoter region in the Nhlh2 gene. This 163 bp promoter contains five putative binding sites for the leptin-activated Stat3 transcription factor, and two putative binding sites for the NFκB transcription factor. Results of mutagenesis studies reveal that deletion of the NFκB sites have little effect, mutagenesis of the third Stat3 site eliminates both leptin-induced and basal expression of Nhlh2. Mutagenesis of the 4th and 5th sites eliminates leptin-induced expression, and increases basal expression above the WT promoter. Stat3 can be preferentially pulled down from leptin-treated mouse hypothalamic chromatin extracts. This study identifies leptin-induced Stat3 transcription factor as the major transcriptional regulator of Nhlh2. As Nhlh2 transcriptionally regulates genes within the melanocortin pathway, these findings have implications for human body weight control.
Keywords: Stat3, Nhlh2, promoter, leptin, transfection, luciferase assay, chromatin immunoprecipitation assay, electrophoretic mobility shift assay, transcription factor, DNA binding
1. Introduction
Over two hundred genes have been implicated in control of body weight (Rankinen et al., 2006), and many of these are differentially-expressed in hypothalamic neurons. One of the most studied pathways in the genetic etiology of obesity is that involving the adipocyte hormone leptin. While it is clear that the leptin pathway is fundamental to the regulation of body weight, the signaling pathways, transcriptional mechanisms, and downstream targets of all of these hypothalamic pathways are not as well characterized.
Peripheral leptin can cross the blood brain barrier, where it binds to leptin receptors found on neurons throughout the hypothalamus (Villanueva and Myers, 2008). Binding of leptin to its receptor starts a cascade of signal transduction activity, including the activation of the Signal Transducer and Activator of Transcription-3 (Stat3) transcription factor via phosphorylation by activated Janus Kinas-2 (JAK2). Phosphorylated Stat3 then homodimerizes, and translocates to the nucleus, where it can transcriptionally regulate gene targets (Villanueva and Myers, 2008). A known target of Stat3 is the hypothalamic neuropeptide, pro-opiomelanocortin (POMC), whose proximal promoter contains Stat3 regulatory binding sites (Munzberg et al., 2003). Leptin-induced Stat3 mediated transcription of the POMC promoter requires a complex interaction between Stat3, specificity protein 1 (Sp1) and forkhead box-containing protein O-1 (FoxO1) (Yang et al., 2009).
As leptin is a cytokine, its signaling pathways in the hypothalamus are likely to involve the inflammatory cytokine pathways previously identified in other tissues. Indeed, the inflammatory transcription factor, nuclear factor kappa B (NFκB), can also be induced following leptin stimulation of hypothalamic neurons (Jang et al., 2010). In its quiescent state, NFκB is found as a cytoplasmic dimer with the inhibitory protein IκB. Following phosphorylation of IκB by IκB kinase (Iκκ), NFκB is released from the dimer with IκB, and translocates to the nucleus where it can transactivate or repress gene expression. POMC is also an NFκB target with two NFκB binding sites in its proximal promoter and first intron (Jang et al., 2010). Chronic over-nutrition causes hypothalamic NFκB activation, possibly starting a cascade that appears to be necessary for further leptinresistance in this physiological state (Zhang et al., 2008). While this activation of NFκB occurs in the arcuate nucleus of the hypothalamus (ARC) during chronic over-nutrition, it is not clear if this occurs exclusively within POMC or within other neuron subtypes in that area as well (Jang et al., 2010, Purkayastha et al., 2011, Zhang et al., 2008).
Our laboratory studies nescient helix-loop-helix-2 (Nhlh2) and its role in hypothalamic gene expression and body weight control. Nhlh2 is a basic helix-loop-helix transcription factor, which is expressed throughout the hypothalamus with the strongest expression in neurons of the arcuate (ARC) and paraventricular (PVN) hypothalamic nuclei (Jing et al., 2004, Vella et al., 2007). Previous work using the Nhlh2 knockout mice (N2KO) has shown that Nhlh2 is necessary for normal body weight control in adults, likely through the maintenance of physical activity levels (Coyle et al., 2002, Good et al., 1997, Good et al., 2008). Furthermore, we have shown that Nhlh2 gene expression is significantly up-regulated by peripheral leptin injection in mice (Vella et al., 2007). While the links between Nhlh2, body weight maintenance and leptin have been established, the molecular mechanisms for leptin-mediated Nhlh2 gene expression were unknown. In this paper we establish a role for leptin-activated Stat3 transcription factor in the regulation of hypothalamic Nhlh2 gene expression thereby linking a signaling pathway between leptin, Stat3, Nhlh2 and melanocortin pathway genes, including PC1/3 and MC4R.
2. Methods and Materials
2.1 Plasmid reporter constructs
Plasmids with varying sizes of the Nhlh2 promoter were used for transfection to determine the minimal promoter that stimulated by leptin. Plasmids containing Nhlh2 promoter fragments of 63, 373, 819 and 950 bp were created from a larger genomic DNA fragment using Erase-A-Base system (Promega Corp, Madison WI). These fragments were then cloned into Luciferase reporter plasmid pGL3-basic (Promega Corp., Madison). Large-scale plasmid preparation was performed using a Qiagen Midi Plasmid kit (Qiagen Ltd., Valencia, CA). The plasmid construct containing Stat3 was a generous gift from Dr. James Darnell, The Rockefeller University, New York, NY, and was modified to have an improved translational start site (Fox and Good, 2008). The leptin receptor (ObRB) plasmid was a generous gift from, Christian Bjørbæk, Harvard Medical School, Boston, MA.
2.2 Site Directed Mutagenesis
A minimal promoter construct containing the flanking sequence between −1 base pair (bp) and −163 bp of the mouse Nhlh2 promoter (NC_000069.5) was used for the all mutagenesis studies. PCR reactions were carried out using the iProof High fidelity DNA polymerase (BioRad Inc, Hercules, CA), A 5 minutes elongation time was used for all reactions. The WT construct was used to create each of the different constructs with substitution mutations in the NFκB binding sites (1st and 2nd sites). Other constructs with substitution mutations in the Stat3 binding site were also created using the Nhlh2 promoter construct as a template. The oligonucleotides for creating these mutations have been listed in Table 1.
Table 1.
Oligonucleotides used for site directed mutagenesis, EMSA and ChIP
| PRIMER | SEQUENCE 5’—3’ |
|---|---|
| NFκB 1st site (Mutant), forward | 5’ TGGGCTGTGAAAACTTAAACACTGTGACAGATG 3’ |
| NFκB 1st site (Mutant), reverse | 5 ‘CATCTGTCACAGTGTTTAAGTTTTCACAGCCCA 3’ |
| NFκB 2nd site (Mutant), forward | 5 ‘AGGTTTCTGTCCAATAATATTTCCCATTAAATAT 3’ |
| NfκB 2nd site (Mutant), reverse | 5 ‘ATATTTAATGGGAAATATTATTGGACAGAAACCT 3’ |
| 3rd Stat3 (Mutant), forward | 5’ TAAGTGACTCGTGTCCAGGTGCGTGTCCAATAGGATTTCCCAT |
| 3rd Stat3 (Mutant), reverse | 5’ ATGGGAAATCCTATTGGACACGCACCTGGACACGAGTCACTTA |
| 4th Stat3 (Mutant), forward | 5’ TAGGATTTCCCATTGGATATCAATTTAGGG 3’ |
| 4th Stat3 (Mutant), reverse | 5’ CCCTAAATTGATATCCAATGGGAAATCCTA 3’ |
| 5th Stat3 site (Mutant), forward | 5’ ATTAAATATCAATGCAGGGGGAAAAAAT 3’ |
| 5th Stat3 site (Mutant), reverse | 5’ ATTTTTTCCCCCTGCATTGATATTTAAT 3’ |
| 4th and 5th Stat3 (Mutant), forward | 5’ ATTGGATATCAATGCAGGGGGAAAAAAT-3’ |
| 4th and 5th Stat3 (Mutant), reverse | 5’ ATTTTTTCCCCCTGCATTGATATCCAAT 3’ |
| ChIP amplification, forward | 5’ ATCATGGGCTGCTTTCAACT 3’ |
| ChIP amplification, reverse | 5’TAGCCTGGAGATGGTGGAAG 3’ |
| 3rd Stat3 site, forward, EMSA | GTCCAGGTTTCTGTCCAATAGGATTT |
| 3rd Stat3 site, reverse, EMSA | AAATCCTATTGGACAGAAACCTGGAC |
| 4th Stat3 site, forward, EMSA | AGGATTTCCCATTAAATATCAA |
| 4th Stat3 site, reverse, EMSA | TTGATATTTAATGGGAAATCCT |
| 5th Stat3 site, forward, EMSA | 5’ AATATCAATTAGGGGGAAAAAATTCC 3’ |
| 5th Stat3 site, reverse, EMSA | 5’ GGAATTTTTTCCCCCTAATTGATATT 3’ |
| 3rd and 4th Stat3 and 2nd NFκB | 5’ AGGTTTCTGTCCAATAGGATTTCCCATTAAATAT 3’ |
| 3rd and 4th Stat3 and 2nd NFκB | 5’ ATATTTAATGGGAAATCCTATTGGACAGAAACCT 3’ |
| Mouse Nhlh2, forward | 5’ GTGTCGGACCTAGAGCCAGT3 ’ |
| Mouse Nhlh2, reverse | 5’ GAGGCAGCGTGGGTAGTAGT 3’ |
| Mouse β actin, forward | 5’ GGAATCCTGTGGCATCCAT 3’ |
| Mouse β actin, reserse | 5’ GGAGGAGCAATGATCTTGATCT 3’ |
The PCR was carried out in 50 µl using 5 ng of template. The first cycle was performed at 98°C for 3 min, and then followed by 35 cycles at 98°C for 10 s, 55°C for 30 s, and 72°C for 5 minutes. The reaction was terminated at 72°C for 10 min. The PCR product was stained with Ethidium Bromide (EtBr) and run on 1% agarose gel to detect the success of amplification. The PCR product was digested with DpnI enzyme to cut the template DNA and keep only the PCR product. The DpnI-digested PCR product was transformed into E-coli and cultured to extract plasmids. Plasmids were sequenced to ensure that the correct mutations were introduced and that there were no PCR errors.
2.3 Cell culture and transfections
The N29/2 cells (Cellutions Biosystems Inc, Toronto, ON, Canada), a mouse hypothalamic cell line (Belsham et al., 2004), were grown in DMEM-high glucose (4.5 g/liter) medium containing 4.5 g/liter Sodium pyruvate and 10% fetal bovine serum, 100 units/ml penicillin, and 10µg/ml streptomycin (HyClone, Logan, UT). Cells were incubated at 37°C in 5% CO2. The WT and each one of the mutagenized plasmids was transfected into N29/2 cells using Effectene transfection reagent (Qiagen, Valencia, CA) following the manufacturer protocol. Cells were trypsinized, collected, and plated in 12-well plates 24 hours prior to the transfection day. Each well had 1–2 × 10⁵ cells plated 24 hours prior to the transfection such that there would be 40–60% confluency at the start of the transfection. Cells were transfected with 435 ng of DNA per well (200 ng reporter Nhlh2 plasmid or empty vector (pGL3-basic) as a control, 35 ng of CMV-β-gal plasmid, and 100 ng each of Stat3 and Leptin receptor constructs). The β gal plasmid was used as the internal control for the efficiency of transfection.
2.4 Luciferase and β-galactosidase Assays
N29/2 Cells were incubated at 37°C for 24 hrs after transfection. Cells were then subjected to serum deprivation for 12 hours followed by treatment with either 100 pM leptin (National Hormone & Peptide Program (NHPP), NIDDK, and Dr. Parlow) or vehicle (PBS) for 2 hrs in serum-free media. Cells were lysed 2 hours after leptin stimulation, in 400 µl 1× Reporter Lysis Buffer (Promega, Madison, WI)). The luciferase assay was performed using 5 µl of cell lysate (Luciferase Assay System Promega, Madison, WI). As an internal control for the efficiency of transfection, the β-galactosidase (β-gal) activities were measured using 25 µl of lysate (Promega, Madison, WI). In order to obtain the standardized luciferase activity, the luciferase activity of each sample was divided by the corresponding relative β-gal activity. For each assay, the basal WT promoter total luciferase activity (no leptin treatment), normalized against β-galactosidase activity was taken to be 1, and results were expressed as fold activation over the control value. The data presented are means ± SE of triplicates for a single representative experiment. Transfection analysis for each construct was done a minimum of three times (and in triplicate for each independent test) to confirm the result. An alpha level of 0.05 was used to determine significance for all analyses.
2.5 Quantitative Polymerase Chain Reaction (QPCR) for Nhlh2 expression
For analysis of Nhlh2 expression following leptin stimulation, N29/2 cells were grown to 70% confluency in 6 well plates, and serum was removed from the culture place by replacing the media with fresh media containing glucose, but no serum. Twelve hours following serum starvation, cells were treated with media containing mouse leptin 1 ug/ml of media, rmLEPT, National Hormone and Peptide Program [NHPP], NIDDK) for 15, 30, 60, 120 and 240 minutes. Total RNA was extracted using the Trizol™ (Invitrogen, Grand Island, NY) extraction protocol. The RNA used to synthesize cDNA, using standard methods. Nhlh2 mRNA levels were measured using the iTaq SYBR Green Supermix with ROX PCR master mix (Bio-Rad, Hercules, California), using oligonucleotide primers (Table 1). The Nhlh2 mRNA expression levels were normalized to the level of the β actin reference gene (Table 1), and relative expression level calculated to the level of serum starved untreated cells. Real-Time PCR experiments were performed on a 7900 HT Fast Real-Time PCR System (Applied Biosystems, Foster City, California). Normalized levels of mRNA were measured in triplicate per individual cell culture well, from which sample means were calculated for each sample. A total of 3 separate ChIP experiments were done, each in triplicate, to confirm the results. No template control wells were run for all reactions to confirm the absence of contamination and primer-dimer formation. All primer sets are analyzed for primer-dimer formation, specificity of target (sequencing of the amplicon), and melting curve analysis. Data are reported as the fold-difference from beads (ChIP QPCR experiments) or no leptin (Nhlh2 endogenous expression). Student’s t test between pairs was used with an alpha level of 0.05 to determine significance for all analyses. The data presented are means ± SE with *p<0.05, **p<0.01.
2.6 Chromatin Immunoprecipitation Assay (ChIP)
Preparation of chromatin-DNA and ChIP assays were performed using Upstate Biotechnology Chromatin Immunoprecipitation kit (Upstate, Charlottesville, VA) according to the protocol supplied by the manufacturer. Mice were starved for 24 hours followed by leptin (3 mg/kg body weight in PBS) injection. Mice were euthanized two hours after leptin treatment and dissected to isolate the hypothalamus. The hypothalamus was minced and subjected to cross-linking reactions using formaldehyde at a final concentration of 1% for 15 minutes at room temperature. The hypothalamus was washed twice with phosphate buffered saline containing protease inhibitors. Hypothalamus tissues were lysed, and chromatin was sonicated to share the DNA to get a 500–1000 bp DNA length. Following centrifugation, the chromatin was extracted and diluted 10-fold. Chromatin was precleared with Salmon Sperm DNA/Protein A Agarose-50% Slurry. Chromatin was incubated overnight at 4°C using 2 µg mouse Stat3 (K-15: sc-483) (Santa Cruz Biotechnology) or with no antibody as a negative control. Samples were subjected to immunoprecipitation with Salmon Sperm DNA/Protein A Agarose-50% Slurry. Immunoprecipitated complexes were washed with different buffers according to the manufacturer protocol followed by an elution twice with 250 µl of elution buffer. Protein–DNA cross-links were reversed by adding 20 µl of 5 M NaCl and incubating at 65°C overnight. DNA was recovered using Wizard clean up PCR system (Promega). Five µl of the recovered DNA was used for PCR amplification (20 cycles) with the primer set shown in Table 1, which amplifies the Nhlh2 promoter region between −1 and −226 where two NFκB and three of the Stat3 binding sites were located. For quantification of the pulled down complexes, qPCR on an Applied Biosystems Model ViiA7 QPCR machine was used. For gel electrophoresis, a second PCR amplification reaction was performed using 5 µl of the previous PCR product (20 additional cycles). The samples were electrophoresed using a 1.6% agarose gel, and visualized by ethidium bromide under UV light.
2.7 Electrophoretic Mobility Shift Assay (EMSA)
Double stranded oligonucleotides were annealed and labeled using T4 polynucleotide kinase (Promega, Madison, WI) and [γ-32p] deoxy (d)-ATP (PerkinElmer, Waltham, MA; 3000 Ci/mmol). Labeled oligonucleotides were purified using MicroSpin G-25 columns (GE Healthcare, UK). Five micrograms of nuclear extract were incubated at room temperature in a 20 µl reaction volume for 20 minutes in binding buffer from (Promega). Labeled oligonucleotides, about 35 fmol of [γ-32p] dATP-labeled probe, were added and incubated for another 20 minutes at room temperature. The DNA sequences of the double-stranded oligonucleotides used for this study are listed in Table 1. For competition experiments, a 10-fold molar excess of unlabeled oligonucleotides were added to the binding reaction. Samples were subjected to electrophoresis at a 6% non-denaturing polyacrylamide gel at 250 V for 2–3 hours to separate the DNA-complex from the free oligonucleotides. The gel was pre-run in 5X Tris-borate-EDTA buffer for 30 minutes before loading the samples. Gels were dried by heated vacuum and exposed to film (Eastman Kodak, Rochester, NY) for 4–7 days at −80°C. For supershift assays, polyclonal antibodies against Stat3 (K-15: sc-483) (Santa Cruz Biotechnology) were added to the reaction mixture and incubated for 30 min at room temperature prior to the addition of the radio labeled oligonucleotides.
2.8 Experimental Animals
Mice were housed in a room with automatically controlled temperature, humidity and lighting 12 h: 12 h light:dark cycle with ad libitum access to food and water. For ChIP studies, only male mice were used. Food deprivation was implemented for 24 h and then mice were injected with leptin (3 mg/kg body weight in PBS). All mice were euthanized by CO2 two hours following leptin treatment. Brains were isolated by dissection, and a hypothalamic tissue block was made. For ChIP experiments, the hypothalamic block was minced by razor blade and transferred to PBS and used directly according to the experiment procedure described for ChIP. The Institutional Animal Care and Use Committee at Virginia Tech approved all animal experiments.
3. Results
3.1 Putative binding sites for Stat3 and NFκB are present on the Nhlh2 promoter
Analysis of the DNA sequence between +1 and −3440 of mouse Nhlh2 genomic DNA (NC_000069.5) revealed five putative binding site motifs for Stat3 at −47, −65, −80, −281, and −294, and two putative binding site motifs for NFκB at −67 and −135 (Figure 1A). A comparative Blast analysis between mouse (NC_000069.5) and human (NM_005599.3) Nhlh2/NHLH2 promoters revealed a highly conserved region from −200 to the transcriptional start site. Within this region there were only 3 nucleotide differences between the mouse and human Nhlh2/NHLH2 promoters (Figure 1A). Also within this stretch, a unique motif exists, which contains a region with Stat3 sites (labeled sites 3 and 4) overlapping the second NFκB binding site motifs (Figure 1A). The comparison also revealed that both of the NFκB binding sites at −67 and −135 are identical between human and mouse. In contrast, only the 3rd Stat3 site at −80 and the 4th Stat3 site at −65, which overlaps with the second NFκB site, are identical between the human and mouse promoters.
Figure 1. Identification of the minimal promoter for Nhlh2 expression.


(A.) Mouse (NC_000069.5) and Human (NM_005599.3) Nhlh2 proximal promoter region alignment. Numbering is from −1 position on both promoters. The gray shading represents putative Stat3 binding site motifs while the underlined sequences represent the NFκB binding site motifs. (B.) Luciferase vectors containing differently-sized fragments of the mouse Nhlh2 promoter were used in luciferase assays. The luciferase activity was measured and normalized to the expression of a co-transfected β-gal-encoding plasmid. Luciferase activity, relative to the longest construct (−950) is reported as means, ± SE. The empty luciferase vector with no promoter fragment is indicated at the bottom. * P ≤ 0.05, relative to the longest construct (−950). The cartoon in shows the relative location of the mapped putative transcription factor binding sites, as shown in (A).
3.2 Identification of the minimal promoter for Nhlh2 expression
To identify the minimal promoter region of mouse Nhlh2, a genomic fragment containing 950 base pairs of DNA 5-prime to the transcription start site for Nhlh2 mRNA was used to prepare a luciferase reporter construct. N29/2 hypothalamic cells, which express Nhlh2 and in which endogenous Nhlh2 expression responds to leptin stimulation by 1 hour were used for the study. Comparison of luciferase activity between the full-length construct and multiple serial deletions of this construct revealed that a minimal promoter of 163 base pairs (bp) was sufficient for robust expression of the Nhlh2 promoter (Figure 1B, P < 0.01). Interestingly, a possible negative control region exists between −373 bp and −950 bp, as indicated by the lower level of expression for the longest two constructs, but investigation of this region was outside the scope of this project.
3.3 The minimal promoter is responsive to leptin
In order to use a cell line to study Nhlh2 expression, leptin-responsiveness of the endogenous Nhlh2 promoter was confirmed in N29/2 cells and 2 hours was found to have the maximal expression of the endogenous Nhlh2 gene (Figure 2A). As the minimal identified promoter of 163 bp, containing 3 putative Stat3 sites, and 2 putative NFκB sites was also expressed in N29/2 cells, it was used in all further studies to measure leptin responsiveness in vitro. While leptin stimulation for 2 hrs after 12 hrs of serum deprivation did not affect the cells transfected with empty pGL3-basic vector, there was a significant 2.1-fold (P < 0.01) increase of luciferase expression in N29/2 cells transfected with the Nhlh2 promoter construct containing just 163 bp of Nhlh2 proximal promoter region (Figure 2B).
Figure 2. Both the endogenous and Nhlh2 minimal promoter are leptin-responsive in N29/2 cells.

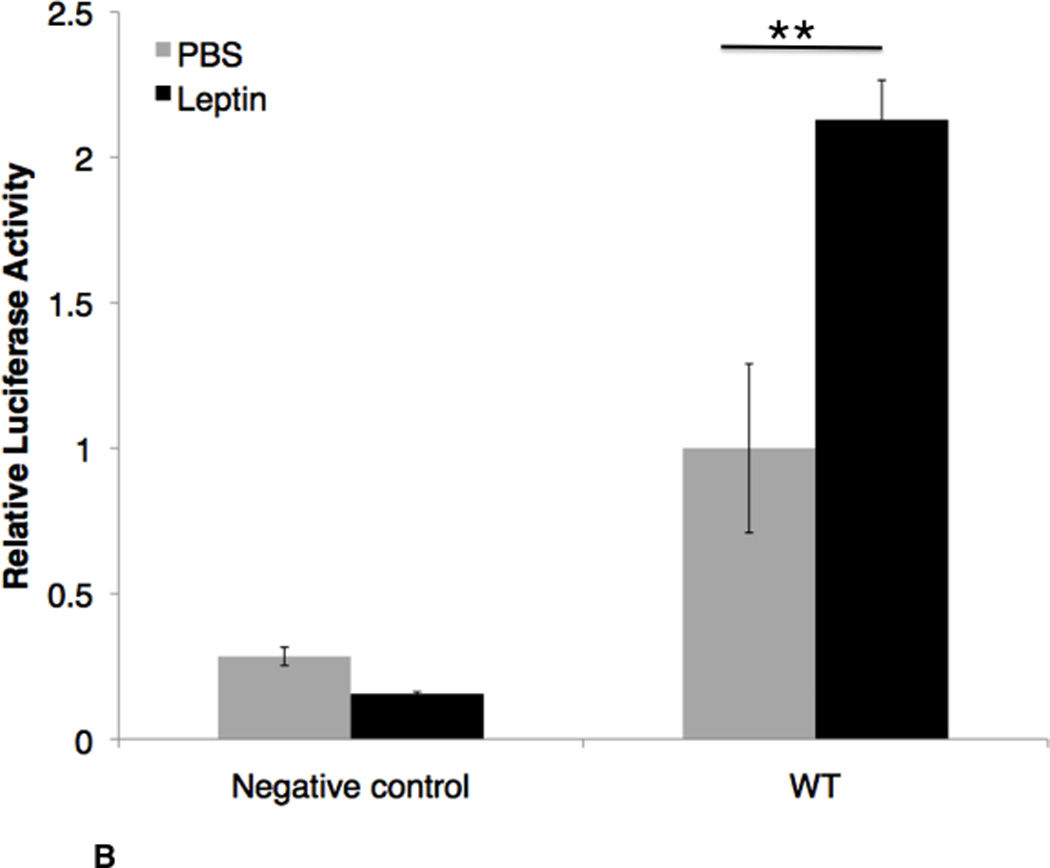
A. QPCR analysis of endogenous Nhlh2 expression, following leptin-treatment of N29/2 cells for 0, 0.25, 0.5, 1 hour, 2 hours and 4 hours. Activity relative to serum starved cells (no leptin) is shown for three independent experiments, nine replicates per time point. B. Activity of Nhlh2 promoter reporter transfected into N29/2 cells and serum deprived for 12 hours (gray bars) or serum deprived and followed by leptin (100 pM) for 2 hours (black bars). Luciferase activity, normalized to co-transfected β-gal, is presented relative to the values obtained in cells transfected with the Nlhlh2-luciferase vector subjected to serum deprivation for 12 hours. The data presented are means ± SE; * P ≤ 0.05 relative to serum deprived; **P ≤ 0.01 relative to WT construct with serum deprivation (B) or serum deprived cells (A).
3.4 Mutagenesis of NFκB sites maintains basal and leptin-stimulated expression of the minimal promoter
To test whether the NFκB binding site motifs affect leptin-induced transcriptional regulation of Nhlh2, various constructs with substitution mutations in each of the NFκB binding sites were created (Figure 3A). These mutations were designed to eliminate NFκB binding and transactivation, as shown for similar NFκB sites (Libermann and Baltimore, 1990).
Figure 3. Mutagenesis analysis of the NFκB sites.

(A.) Sequence of WT and mutated NFκB sites 1 and 2 from the mouse Nhlh2 promoter. Mutations were introduced into plasmids containing the −163 bp promoter luciferase construct. The NFκB consensus sequence (Hiscott et al., 2001, Parry and Mackman, 1994) is shown. (B.) Luciferase activity of Nhlh2 promoter reporter constructs from serum deprived (gray bars) or serum deprived plus leptin (black bars) N29/2 cells. Mutagenized NFκB sites are shown as white boxes. Luciferase activity, normalized to co-transfected β-gal, is presented relative to the values obtained in cells transfected with the WT Nlhlh2-luciferase vector subjected to serum deprivation for 12 hours. The data presented are means ± SE; *P ≤ 0.05 between pairs, “a”, P ≤ 0.05, compared to WT serum deprived, or “b”, P ≤ 0.05, compared to WT serum deprived plus leptin.
The WT promoter showed a modest increase, as expected, with leptin stimulation (P =0.06). Mutation in the 1st NFκB binding site at −135 resulted in a slight, but not significant increase (P=0.07) in basal expression of Nhlh2, and there was a significant increase in leptin-stimulation compared to the WT promoter (P < 0.05). Mutation of the 2nd NFκB binding site at −67 resulted in no effect on basal expression, and a slight, but non-significant increase in transactivation of the mutant Nhlh2 promoter construct following leptin stimulation, similar to the WT promoter results. Substitution mutations in both NFκB binding sites still allowed significant induction of the Nhlh2 promoter construct by leptin, interestingly this induction was greater than the WT construct alone (P < 0.05) (Figure 3B), suggesting that loss of both NFκB binding sites may alleviate some slight inhibition to leptin stimulation. Overall, the putative NFκB binding sites appear to exert modest regulation, which may represent some inhibitory activity, as mutation of these sites results in a slightly higher, yet significant, leptin-stimulation of the Nhlh2 promoter compared to WT.
3.5 The putative Stat3 sites control basal and leptin induced expression of the Nhlh2 promoter
To test whether the putative Stat3 sites were functional for the Nhlh2 promoter, substitution mutations were created in each of the Stat3 binding site motifs (Figure 4A), and were based on other mutations that had been demonstrated by previous work as completely eliminating Stat3 binding (Niu et al., 2002). As shown in Figure 4B, when compared with expression levels of the WT promoter (WT), mutation of the 3rd site of Stat3 at −80 resulted in a complete loss of both basal promoter activity and the promoter response to leptin (P < 0.05). Mutation of the 4th site at −65 increased the basal expression of Nhlh2 (P < 0.05), but also appeared to eliminate leptin stimulation, resulting in no increase over basal expression for that vector construct in cells treated with leptin. Moreover, the mutation of the 5th site of Stat3 at −47 increased the basal expression of Nhlh2, and like the 4th site mutation, resulted in a loss of leptin stimulation, with overall decreased expression compared to basal expression levels (P < 0.05). Combination of the 3rd site mutation with either the 4th or 5th site mutations alone, or with both the 4th and 5th site mutants showed the dominant effect of the 3rd site mutation with elimination of both basal and leptin-induced expression. Together, these results suggest that the 3rd site of Stat3 is required for both basal and leptin stimulated expression levels of Nhlh2. The construct containing both the 4th and 5th site mutations were expressed at a level significantly higher than the WT construct, but like the single 4th and 5th site mutations, a loss of leptin induction was observed. These results suggest that the 4th and 5th Stat3 binding sites may exert a slightly negative effect on basal expression of the Nhlh2 promoter, but are required for the induction of transcription following leptin stimulation.
Figure 4. Mutagenesis analysis of the Stat3 sites.

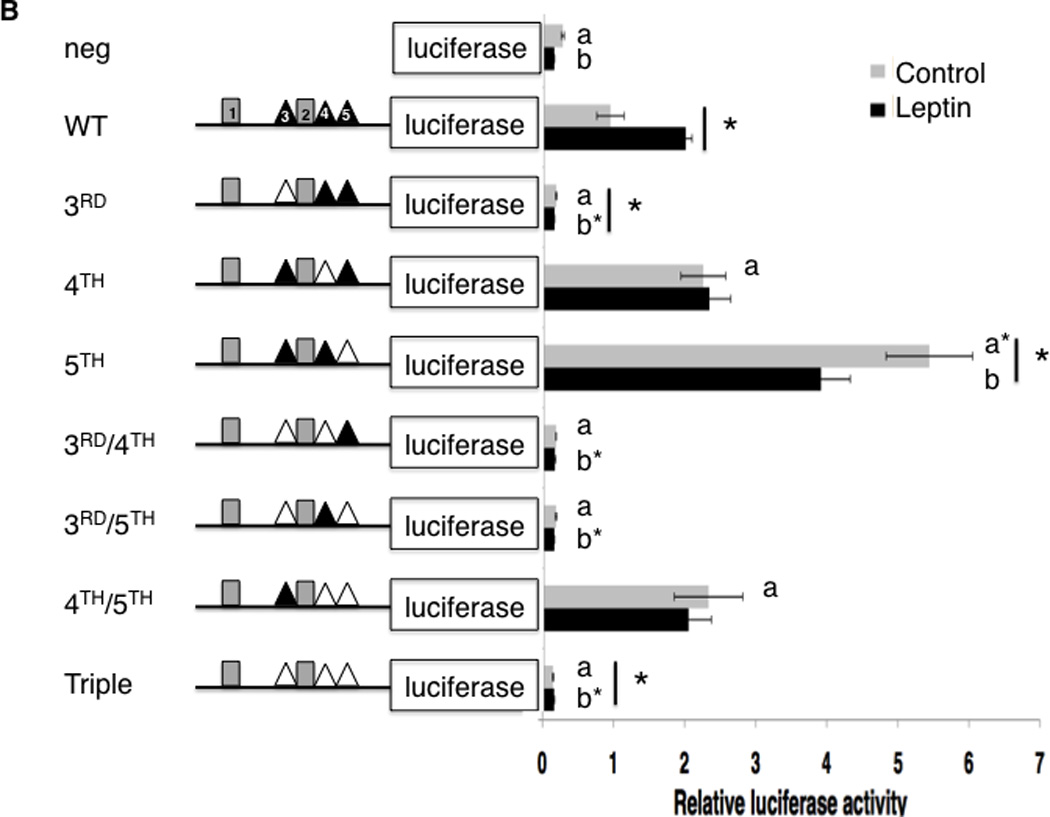
(A.) Sequence of WT and mutated Stat3 sites 3, 4 and 5 from the mouse Nhlh2 promoter. Mutations were introduced into plasmids containing the −163 bp promoter luciferase construct. The Stat3 consensus sequence (Seidel et al., 1995) is shown. (B.) Luciferase activity of Nhlh2 promoter reporter constructs from serum deprived (gray bars) or serum deprived plus leptin (black bars) N29/2 cells. Mutagenized Stat3 sites are shown as white triangles. Luciferase activity, normalized to co-transfected β-gal, is presented relative to the values obtained in cells transfected with the WT Nlhlh2-luciferase vector subjected to serum deprivation for 12 hours. The data presented are means ± SE; *P ≤ 0.05 between pairs, “a”, P ≤ 0.05, or “a*”, P ≤ 0.01, compared to WT serum deprived, “b”, P < 0.05, or “b*”, P ≤ 0.01, compared to WT serum deprived plus leptin.
3.6 EMSA reveals that the Stat3 sites are occupied with Stat3
Electrophoretic gel mobility shift experiments were carried out to examine the Stat3 sites, as mutation of these sites exerted the major effect on leptin stimulation. Oligonucleotides to the single Stat3 sites did not show strong binding (data not shown). However, when oligonucleotides, encoding the 3rd and 4th site (which also has an overlapping NFκB site) were incubated with leptin-stimulated hypothalamic cell nuclear extracts, two major bands were detected (Figure 5A), both of which could be competed away with an unlabeled oligo containing only the 3rd Stat3 motif, although the minor band was competed less effectively than the major (close arrow) band. Only the minor band (open arrow) was competed away using the 4th Stat3 motif (Figure 5A).
Figure 5. Electrophoretic mobility shift assays on individual promoter motifs.

(A.) EMSA competition analysis using an oligonucleotide containing Stat3 sites 3, and 4, and NFκB site 2, competed with control (−), unlabeled site 3 or unlabeled site 4 oligonucleotides. (B.) Supershift EMSA experiment using an oligonucleotide containing Stat3 sites 3, and 4, and NFκB site 2 either alone (−), or co-incubated with an antibody to mouse Stat3. The thick arrows indicate the two shifted bands. The thin arrows indicate the supershifted bands.
To confirm specific Stat3 interaction with this oligonucleotide, complexes from leptin-treated cells were co-incubated with antibodies against either Stat3 or each of the NFκB subunits. The oligonucleotide containing all three sites was used for this study, and thus two major bands were present in the absence of added antibody. Both of these major bands showed supershifts when treated with an antibody to Stat3 (Figure 5B), indicating that both complexes contain Stat3 transcription factor. At this time it is not entirely clear what the two different migrating complexes represent, but EMSA using antibodies to different NFκB subunits also shift both complexes, suggesting that these may represent Stat3-NFκB co-complexes (data not shown). Since there is little effect of the NFκB site 2 mutagenesis on basal or leptin-stimulated expression, compared to the WT promoter, no further investigation of NFκB binding was made.
3.7 Chromatin Immunoprecipitation (ChIP) reveals that Stat3 interacts with the hypothalamic Nhlh2 promoter in leptin-injected mice
To confirm and quantify Stat3 binding to the Nhlh2 promoter in both the hypothalamic cell line N29/2 and in leptin-stimulated mouse hypothalamus, a ChIP assay was used. Primers were designed to amplify an Nhlh2 promoter region contained within the minimal leptin-responsive 163 bp fragment used in the promoter constructs (Table 1). As shown in Figure 6A–B, an antibody against Stat3 pulls down the Nhlh2 promoter region from hypothalamic cell line chromatin. Controls including use of input chromatin (positive control, “input”), and beads only (negative control, “beads”) confirmed the experimental conditions. The leptin stimulation of hypothalamic cells resulted in a significant increase in pull-down, suggesting increased Stat3 binding to the promoter (Figure 6B). Similar results were obtained using chromatin isolated from the hypothalamus of leptin- or PBS injected mice (Figure 6C–D). There is slightly more binding of the Nhlh2 promoter chromatin fragment in non-leptin stimulated hypothalamic chromatin, compared to the cell line, which likely represents the heterogeneous nature of the whole hypothalamic extracts. Together with the results from the transfection, mutation analysis and EMSA experiments, these results support the role for Stat3 as a positive transcriptional regulator of Nhlh2 following leptin stimulation, creating a genetic link between leptin signaling and downstream actions of Nhlh2 in body weight control.
Figure 6. Chromatin immunoprecipitation from leptin-stimulated mouse hypothalamus.

ChIP assay using chromatin from hypothalamic cells (A,B), or mouse hypothalamus (C,D) and an antibody to mouse Stat3 protein which recognizes both phosphorylated and non-phosphorylated protein. (A, C) Gel electrophoresis of PCR amplicons following ChIP of hypothalamic cell lines (A) or hypothalamus (C). a, water control; b, no leptin + anti-Stat3; c, leptin plus anti-Stat3; d, leptin + IgG; e, leptin + Beads; f, input which represents total chromatin from leptin-treated mouse hypothalamic extracts (cells or animals); “Beads” represents pull-down experiments without antibody. (B, D). QPCR results from ChIP experiments using cells (B) or animals (D), with the lanes corresponding to b–d of the PCR gel picture. Relative chromatin levels were calculated using cycle threshold values, and by setting all values relative to the “no template” level. The PCR fragment (226 bp) amplified by the ChIP experiment contains the minimal promoter region of Nhlh2 with all 5 putative binding sites (Table 1 for primers).
4. Discussion
The study presented here extends previous work done in mice, by identifying the possible mechanism and promoter motifs controlling leptin-induced expression of Nhlh2. We show that the proximal promoter region of Nhlh2 contains five putative Stat3 binding motifs, with at least two of these sites necessary for leptin-induced expression. In a previous paper, we showed that hypothalamic Nhlh2 expression was significantly induced following 2 hours of leptin treatment (Vella et al., 2007), and in this study were able to replicate that induction using the N29/2 hypothalamic cell line.
All three of the proximal Stat3 sites identified in the initial promoter analysis matched the predicted consensus sequence for Stat3 (Qian et al., 2006, Seidel et al., 1995). Mutation of the 3rd Stat3 site completely eliminated the both basal and leptin-induced reporter expression. Mutation of either the 4th or 5th site resulted in normal to elevated basal levels, but loss of leptin-induction of the reporter construct. It is possible that these 2 Stat3-bound sites may act as a rheostat with Stat3 either in the bound or unbound configuration to fine-tune Nhlh2 expression. Consistent with the reporter assays and EMSA analysis, Stat3 was present when leptin-induced hypothalamic chromatin was immunoprecipitated from mice or a hypothalamic cell line. While we have previously demonstrated that leptin injection and ad lib feeding after food deprivation significantly increased the expression of Nhlh2 throughout the hypothalamus (Vella et al., 2007), these results identify Stat3 as a key factor in regulating Nhlh2 expression in these regions. We now show that Stat3 activity is required for both basal Nhlh2 expression and leptin induction of Nhlh2 gene transcription following leptin treatment, specifically the third Stat3 site on the proximal Nhlh2 promoter. It has been previously demonstrated that Stat3 regulates the expression of many genes in the hypothalamus, such as PC1/3 and POMC (Munzberg et al., 2003, Sanchez et al., 2004). These results identify another Stat3-regulated gene, and as Nhlh2 is itself a transcription factor, identify a mechanism for induction of many possible Nhlh2-regulated target genes. The PC1/3 gene, for example, requires both Nhlh2 and Stat3 to coordinately control its leptin-induced expression (Fox and Good, 2008). Mechanistically, with these results, leptin is now shown to stimulate hypothalamic Stat3, and within the ARC, this leads to transcriptional regulation of POMC, Nhlh2 and, together with newly synthesized Nhlh2, the enzyme needed to process POMC, PC1/3. Coordinated regulation of all three of these genes, and final synthesis of POMC-derived neuropeptides, such as α-melanocyte stimulating hormone (αMSH) occurs through the transcriptional activities of Stat3 and Nhlh2. Within the PVN, Stat3 activates Nhlh2, which is required for transactivation of the receptor for αMSH, melanocortin-4-receptor (Mc4r) (Wankhade and Good, 2011). This pathway appears to be a required component of leptin- and perhaps nutrient sensing by the hypothlamaus.
Like Nhlh2 and Stat3 on the PC1/3 promoter, Stat3 on the Nhlh2 promoter does not appear to act alone. The 3rd Stat3 site, which is necessary for both basal and leptin-induced expression of Nhlh2, is located in a unique configuration with an NFκB and the 4th Stat3 site. A recent article showed that a similar Stat3: NFκB promoter motif regulated cytokine-induced fascin expression in breast cancer cells (Snyder et al., 2011). In our study, mutation of either of the NFκB sites appears to have little effect on leptin-induced expression, and leptin-stimulation of the Nhlh2 promoter constructs is still detectable in 2 out of the 3 promoter constructs. However, as shown in our results, there is high variability when the construct containing a mutation of the 2nd NFκB sites is used, as indicated by the large standard error bars. To create the mutation in the 2nd NFκB site, without affecting the Stat3 sequence motif in that same area, the 2nd and 3rd nucleotides were changed from GG to AT. While the GG residues are within the canonical motif for NFκB and AT residues are not, it is still possible that this mutation either does not completely abrogate NFκB binding, or affects binding of other co-acting proteins. In addition, using EMSA and ChIP, NFκB subunits can bind to the site containing the 3rd and 4th Stat3 site with the 2nd NFκB but the EMSA results especially appear blurred with the possibility of multiple proteins interactions occurring simultaneously (data not shown). Thus while our results support the conclusion that the 3rd site of Stat3 plays a key role in regulating Nhlh2, they do not rule out the possibility that a second transcription factor, such as NFκB may act to coordinate expression of the Nhlh2 promoter in response to leptin or other signals, especially within this overlapping motif.
Ultimately, the results from this study link over-nutrition/obesity pathways containing both Stat3 and Nhlh2, with nutrient and energy availability sensing by the hypothalamus. As we have previously identified key transcriptional targets for Nhlh2 (PC1/3 and Mc4r, for example (Fox and Good, 2008, Wankhade and Good, 2011)), these studies allow us to begin to piece together the molecular pathways between peripheral increases in leptin and hypothalamic control responses. Obesity can result in both high leptin levels and high levels of inflammatory cytokines such as IL6 (Cancello et al., 2004). It is possible that under normal conditions, leptin and/or other cytokines may signal through hypothalamic Stat3 to control pathways that would ultimately prevent both body weight gain and inflammation, potentially through transcriptional regulation of Nhlh2 and its’ downstream targets. Indeed, deletion of Nhlh2 in mice results in adult-onset obesity and high circulating IL6 levels (Wankhade et al., 2010). Likewise, in obese individuals, where circulating leptin and cytokine levels are high, leptin resistance and inflammation occurs, possibly accompanied by altered regulation of Nhlh2 expression. Nhlh2’s role as a mediator of leptin signals, and as possibly a more global regulation of nutrient sensing deserves further future investigation.
Highlights.
A small 163 bp proximal promoter confers leptin-regulation to the Nhlh2 promoter
Three Stat3 sites mediate leptin-induced and basal Nhlh2 expression
Stat3 interacts with the Nhlh2 promoter in leptin-treated cell lines and mice
The results identify the mechanisms for leptin-responsiveness of the Nhlh2 promoter
Acknowledgements
The authors would like to thank Ms. Johanna Jacob and Ms. Haiyan Zhang for excellent technical assistance, as well as superb maintenance and genotyping of the Nhlh2 knockout colony. We would also like to thank the animal caretaker staff at Virginia Tech for continuing their high quality care of our mice. We thank Dr. Anthony Hollenberg for sharing his protocol on extracting chromatin from mouse hypothalamus. The work was supported in part by funding from the National Institutes of Health (NIH): R01 DK59903 (DJG) and internal departmental and college funds (DJG).
Grant Support: This work was supported by a grant from the National Institute of Diabetes and Digestive Disorders #DK-59903 and departmental funds
Footnotes
Publisher's Disclaimer: This is a PDF file of an unedited manuscript that has been accepted for publication. As a service to our customers we are providing this early version of the manuscript. The manuscript will undergo copyediting, typesetting, and review of the resulting proof before it is published in its final citable form. Please note that during the production process errors may be discovered which could affect the content, and all legal disclaimers that apply to the journal pertain.
Disclosures: The authors have nothing to disclose
Bibliography
- Belsham DD, Cai F, Cui H, Smukler SR, Salapatek AM, Shkreta L. Generation of a phenotypic array of hypothalamic neuronal cell models to study complex neuroendocrine disorders. Endocrinology. 2004;145:393–400. doi: 10.1210/en.2003-0946. [DOI] [PubMed] [Google Scholar]
- Cancello R, Tounian A, Poitou C, Clement K. Adiposity signals, genetic and body weight regulation in humans. Diabetes Metab. 2004;30:215–227. doi: 10.1016/s1262-3636(07)70112-x. [DOI] [PubMed] [Google Scholar]
- Coyle CA, Jing E, Hosmer T, Powers JB, Wade G, Good DJ. Reduced voluntary activity precedes adult-onset obesity in Nhlh2 knockout mice. Physiol Behav. 2002;77:387–402. doi: 10.1016/s0031-9384(02)00885-5. [DOI] [PubMed] [Google Scholar]
- Fox DL, Good DJ. Nhlh2 Interacts with STAT3 to Regulate Transcription of Prohormone Convertase 1/3. Mol Endocrinol. 2008 doi: 10.1210/me.2008-0010. [DOI] [PMC free article] [PubMed] [Google Scholar]
- Good DJ, Porter FD, Mahon KA, Parlow AF, Westphal H, Kirsch IR. Hypogonadism and obesity in mice with a targeted deletion of the Nhlh2 gene. Nat Genet. 1997;15:397–401. doi: 10.1038/ng0497-397. [DOI] [PubMed] [Google Scholar]
- Good DJ, Coyle CA, Fox DL. Nhlh2: a basic helix-loop-helix transcription factor controlling physical activity. Exerc Sport Sci Rev. 2008;36:187–192. doi: 10.1097/JES.0b013e31818782dd. [DOI] [PMC free article] [PubMed] [Google Scholar]
- Hiscott J, Kwon H, Genin P. Hostile takeovers: viral appropriation of the NF-kappaB pathway. J Clin Invest. 2001;107:143–151. doi: 10.1172/JCI11918. [DOI] [PMC free article] [PubMed] [Google Scholar]
- Jang PG, Namkoong C, Kang GM, Hur MW, Kim SW, Kim GH, Kang Y, Jeon MJ, Kim EH, Lee MS, Karin M, Baik JH, Park JY, Lee KU, Kim YB, Kim MS. NF-kappaB activation in hypothalamic pro-opiomelanocortin neurons is essential in illness- and leptin-induced anorexia. J Biol Chem. 2010;285:9706–9715. doi: 10.1074/jbc.M109.070706. [DOI] [PMC free article] [PubMed] [Google Scholar]
- Jing E, Nillni EA, Sanchez VC, Stuart RC, Good DJ. Deletion of the Nhlh2 transcription factor decreases the levels of the anorexigenic peptides alpha melanocyte-stimulating hormone and thyrotropin-releasing hormone and implicates prohormone convertases I and II in obesity. Endocrinology. 2004;145:1503–1513. doi: 10.1210/en.2003-0834. [DOI] [PubMed] [Google Scholar]
- Libermann TA, Baltimore D. Activation of interleukin-6 gene expression through the NF-kappa B transcription factor. Mol Cell Biol. 1990;10:2327–2334. doi: 10.1128/mcb.10.5.2327. [DOI] [PMC free article] [PubMed] [Google Scholar]
- Munzberg H, Huo L, Nillni EA, Hollenberg AN, Bjorbaek C. Role of signal transducer and activator of transcription 3 in regulation of hypothalamic proopiomelanocortin gene expression by leptin. Endocrinology. 2003;144:2121–2131. doi: 10.1210/en.2002-221037. [DOI] [PubMed] [Google Scholar]
- Niu G, Wright KL, Huang M, Song L, Haura E, Turkson J, Zhang S, Wang T, Sinibaldi D, Coppola D, Heller R, Ellis LM, Karras J, Bromberg J, Pardoll D, Jove R, Yu H. Constitutive Stat3 activity up-regulates VEGF expression and tumor angiogenesis. Oncogene. 2002;21:2000–2008. doi: 10.1038/sj.onc.1205260. [DOI] [PubMed] [Google Scholar]
- Parry GC, Mackman N. A set of inducible genes expressed by activated human monocytic and endothelial cells contain kappa B-like sites that specifically bind c-Rel-p65 heterodimers. J Biol Chem. 1994;269:20823–20825. [PubMed] [Google Scholar]
- Purkayastha S, Zhang G, Cai D. Uncoupling the mechanisms of obesity and hypertension by targeting hypothalamic IKK-beta and NF-kappaB. Nat Med. 2011;17:883–887. doi: 10.1038/nm.2372. [DOI] [PMC free article] [PubMed] [Google Scholar]
- Qian L, Chen L, Shi M, Yu M, Jin B, Hu M, Xia Q, Zhang X, Shen B, Guo N. A novel cis-acting element in Her2 promoter regulated by Stat3 in mammary cancer cells. Biochem Biophys Res Commun. 2006;345:660–668. doi: 10.1016/j.bbrc.2006.04.153. [DOI] [PubMed] [Google Scholar]
- Rankinen T, Zuberi A, Chagnon YC, Weisnagel SJ, Argyropoulos G, Walts B, Perusse L, Bouchard C. The human obesity gene map: the 2005 update. Obesity (Silver Spring) 2006;14:529–644. doi: 10.1038/oby.2006.71. [DOI] [PubMed] [Google Scholar]
- Sanchez VC, Goldstein J, Stuart RC, Hovanesian V, Huo L, Munzberg H, Friedman TC, Bjorbaek C, Nillni EA. Regulation of hypothalamic prohormone convertases 1 and 2 and effects on processing of prothyrotropin-releasing hormone. J Clin Invest. 2004;114:357–369. doi: 10.1172/JCI21620. [DOI] [PMC free article] [PubMed] [Google Scholar]
- Seidel HM, Milocco LH, Lamb P, Darnell JE, Jr, Stein RB, Rosen J. Spacing of palindromic half sites as a determinant of selective STAT (signal transducers and activators of transcription) DNA binding and transcriptional activity. Proc Natl Acad Sci U S A. 1995;92:3041–3045. doi: 10.1073/pnas.92.7.3041. [DOI] [PMC free article] [PubMed] [Google Scholar]
- Snyder M, Huang XY, Zhang JJ. Signal transducers and activators of transcription 3 (STAT3) directly regulates cytokine-induced fascin expression and is required for breast cancer cell migration. J Biol Chem. 2011;286:38886–38893. doi: 10.1074/jbc.M111.286245. [DOI] [PMC free article] [PubMed] [Google Scholar]
- Vella KR, Burnside AS, Brennan KM, Good DJ. Expression of the hypothalamic transcription factor Nhlh2 is dependent on energy availability. J Neuroendocrinol. 2007;19:499–510. doi: 10.1111/j.1365-2826.2007.01556.x. [DOI] [PMC free article] [PubMed] [Google Scholar]
- Vella KR, Burnside AS, Brennan KM, Good DJ. Expression of the hypothalamic transcription factor Nhlh2 is dependent on energy availability. Journal of Neuroendocrinology. 2007;19:499–510. doi: 10.1111/j.1365-2826.2007.01556.x. [DOI] [PMC free article] [PubMed] [Google Scholar]
- Villanueva EC, Myers MG., Jr Leptin receptor signaling and the regulation of mammalian physiology. Int J Obes (Lond) 2008;32(Suppl 7):S8–S12. doi: 10.1038/ijo.2008.232. [DOI] [PMC free article] [PubMed] [Google Scholar]
- Wankhade UD, Vella KR, Fox DL, Good DJ. Deletion of Nhlh2 results in a defective torpor response and reduced Beta adrenergic receptor expression in adipose tissue. PLoS One. 2010;5:e12324. doi: 10.1371/journal.pone.0012324. [DOI] [PMC free article] [PubMed] [Google Scholar]
- Wankhade UD, Good DJ. Melanocortin 4 receptor is a transcriptional target of nescient helix-loop-helix-2. Mol Cell Endocrinol. 2011;341:39–47. doi: 10.1016/j.mce.2011.05.022. [DOI] [PMC free article] [PubMed] [Google Scholar]
- Yang G, Lim CY, Li C, Xiao X, Radda GK, Cao X, Han W. FoxO1 inhibits leptin regulation of pro-opiomelanocortin promoter activity by blocking STAT3 interaction with specificity protein 1. J Biol Chem. 2009;284:3719–3727. doi: 10.1074/jbc.M804965200. [DOI] [PubMed] [Google Scholar]
- Zhang X, Zhang G, Zhang H, Karin M, Bai H, Cai D. Hypothalamic IKKbeta/NF-kappaB and ER stress link overnutrition to energy imbalance and obesity. Cell. 2008;135:61–73. doi: 10.1016/j.cell.2008.07.043. [DOI] [PMC free article] [PubMed] [Google Scholar]