Summary
Cyanobacteria are photosynthetic organisms responsible for ~25% of organic carbon fixation on earth. These bacteria began to convert solar energy and carbon dioxide into bioenergy and oxygen billions of years ago. Cyanophages, which infect these bacteria, play an important role in regulating the marine ecosystem by controlling cyanobacteria community organization and mediating lateral gene transfer. Here we visualize the maturation process of cyanophage Syn5 inside its host cell, Synechococcus, using Zernike Phase Contrast (ZPC) electron cryo-tomography (cryoET)1,2. This imaging modality yields significant enhancement of image contrast over conventional cryoET and thus facilitates the direct identification of subcellular components, including thylakoid membranes, carboxysomes and polyribosomes, as well as phages, inside the congested cytosol of the infected cell. By correlating the structural features and relative abundance of viral progeny within cells at different stages of infection, we identified distinct Syn5 assembly intermediates. Our results suggest that the procapsid releases scaffolding proteins and expands its volume at an early stage of genome packaging. Later in assembly, we detected full particles with a tail either with or without an additional horn. The morphogenetic pathway we describe herein is highly conserved and was probably established long before that of double stranded DNA (dsDNA) viruses infecting higher life forms.
Cyanobacteria, and presumably their cyanophages, predate the emergence of enteric bacteria and mammalian viruses by billions of years. Cyanophages containing dsDNA infect a wide range of photosynthetic cyanobacteria. A key question in the assembly of dsDNA viruses is the coordination between protein shell assembly and genome packaging. Here, we use a relatively new electron microscopy approach to follow the maturation process of wild-type cyanophage Syn5 as it occurs inside its host, Synechococcus sp. WH81093,4.
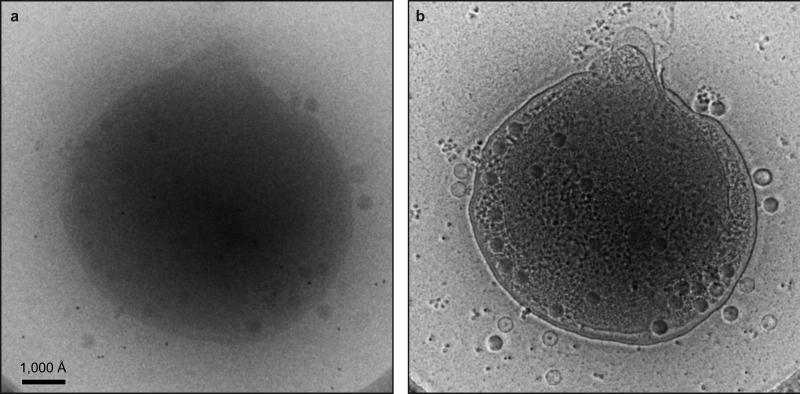
We preserved the native structure of the phage-infected cells by plunge-freezing5 and maintaining them at liquid nitrogen temperature during imaging. The cells were imaged in an electron microscope equipped with a Zernike phase plate, a thin carbon film with a central hole, placed in the back focal plane of the objective lens1,2. It shifts the phase of the scattered electrons by π/2, analogous to an optical phase contrast microscope. This significantly enhances the low-frequency information, allowing for in-focus, high contrast imaging6-8 (Extended Data Fig. 1). Consequently, low-contrast features difficult to detect in conventional cryoET images can be more readily identified.
Extended Data Figure 1. ZPC improves contrast of cryoET images and reveals detailed structural features of Syn5 infected cells.
(a) A conventional EM image of a Syn5-infected WH8109 cell. (b) A ZPC image of the same cell as shown in (a) under the same imaging conditions.
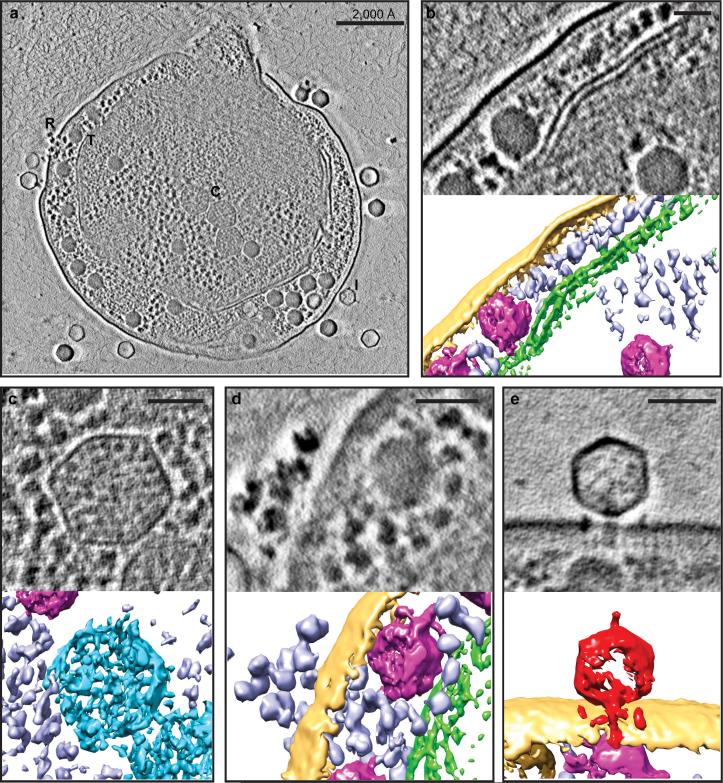
WH8109 cells were imaged before infection and 65-70 minutes post infection. Even at this late infection time, some cells seemed to be newly infected. We reconstructed 58 ZPC tomograms of WH8109 cells (Figs. 1a, 2; Supplementary Videos 1-4 and Methods). The cells range from 0.7 to 1.0μm in diameter. Although the cell envelope and thylakoid membrane (Fig. 1a-b) are roughly concentric, the thylakoid membrane does not fully enclose the inner compartment of the cell, nor does it seem to directly interact with the cell membrane. This differs from the organization seen in other cyanobacteria9,10. Cyanobacteria also contain carboxysomes, polyhedral compartments encapsulating enzymes for carbon fixation11,12. Each WH8109 cell has, on average, four or five carboxysomes, with diameters ranging from 920 to 1160Å (Fig. 1c). Ribosomes are abundant and widespread, forming numerous intracellular patches that contain polyribosomes (Fig. 1d).
Figure 1. Zernike phase contrast cryoET enables direct recognition of cellular components of the Syn5-infected WH8109 cells.
(a) Section view of a Syn5 infected cell at late stage of infection with components labelled, including ribosomes (R), thylakoid membranes (T), carboxysomes (C), and infecting phages (I). Section and 3D annotated view of above cellular components are shown in (b) – (e). (b) Thylakoid membrane (green). (c) Carboxysome (blue). (d) Ribosome (purple). (e) An infecting Syn5 phage (red) positioned normal to the surface of the infected cell. Yellow - cell envelope; magenta - phage progeny. Panels (b) – (e), scale bars = 500Å.
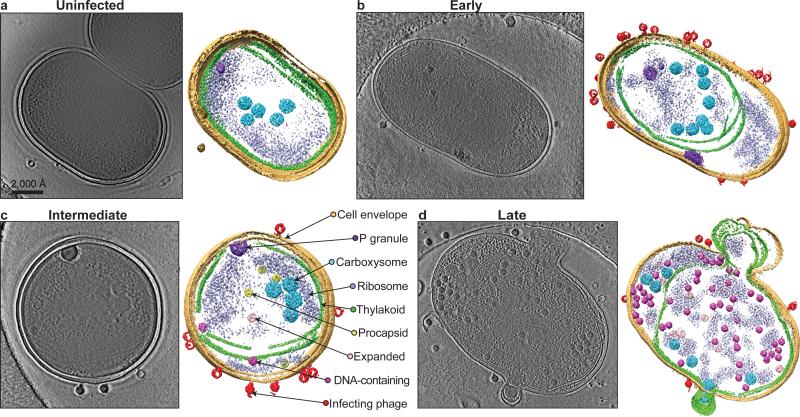
Figure 2. Zernike phase contrast cryoET of WH8109 cells before and after infection with Syn5 phage.
Section (left) and annotated (right) views of (a) an uninfected cell and infected cells at (b) early, (c) intermediate and (d) late stages of infection. Sections shown are 54Å slabs taken from the middle of the tomograms. Cellular components and phages are coloured and labelled in the annotated view in (c). Phage progeny can be separated into three types based on size, shape and internal density: procapsid (yellow); expanded capsid (pink) and DNA-containing capsid (magenta).
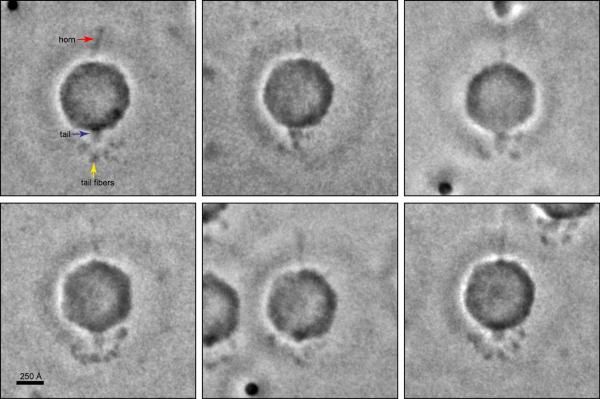
Cyanophage Syn5 that infects WH8109 cells is a short-tailed icosahedral phage with a unique horn appendage at the vertex opposite to the tail13 (Extended Data Fig. 2). Initial segmentation of our tomograms of infected cells identified Syn5 particles on the cell surface, floating in the extracellular medium, and Syn5 progeny inside the cell. Multiple full and empty phage particles are seen attached to the cell surface. Injection of viral DNA occurs at multiple sites on the bacterial envelope and does not appear to be a coordinated process. Fig. 1e shows a tubular density extending from the phage tail through the periplasm to the cytoplasm (Supplementary video 4), similar to observations in other phage-infected bacteria14,15. As infection progresses, increasing numbers of Syn5 phage progeny are observed inside the cells. Late in infection, the cell membrane deforms and ruptures, releasing the phage progeny (Fig. 2).
Extended Data Figure 2. ZPC-cryoEM single particle images of biochemically purified mature Syn5 phage.
The particles are shown with the tail pointing down and the wavy horn pointing up. The tail fibers appear to have variable conformations.
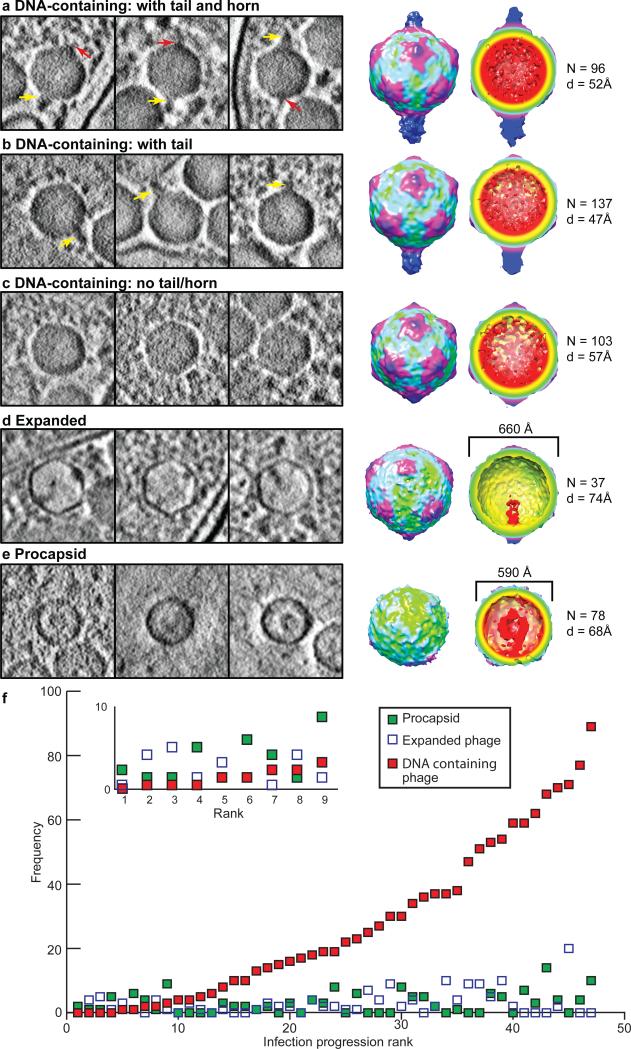
We extracted 470 subvolumes of intracellular Syn5-like particles and classified them into three morphological types based on their shape, size and internal density. The particles were then subjected to template-free alignment and classification16,17 to obtain averages for each type (Methods). The resolutions of the averages range between 70 - 50Å. This level of resolution is sufficient to support our structural interpretations.
The most recognizable type of intracellular capsid appears similar in size (~660Å in diameter) and shape to the mature Syn5 phage13 (Fig. 3a-c). Particles of this type represent the largest population, and are especially abundant in cells at later stages of infection. They have an icosahedral capsid shell with significant internal density attributable to DNA, and are herein referred to as DNA-containing capsids. In contrast to the homogenous population of isolated mature phage, we observed three sub-types of these particles inside infected cells, differing at two opposing vertices. They represent particles with i) a bulky tail and a slim horn appendage on opposing vertices, as in the mature phage (Fig. 3a); ii) a tail at one vertex only (Fig. 3b); and iii) no detectable density protruding from any vertex (Fig. 3c). The averages of the first two sub-types (Fig. 3a-b) show a tail hub of length 190Å; tail fibers are not usually resolved. This could be due to incomplete tail assembly at intermediate stages, inherent flexibility of the tail fibers and/or interference from neighbouring intracellular densities. Our recognition of these three sub-types reveals that the assembly of the tail hub follows DNA encapsulation, but precedes the addition of the horn.
Figure 3. Phage progeny average maps reveal diverse assembly intermediates during phage assembly.
Phage progeny classified as (a-c) DNA-containing capsid, (d) expanded capsid, and (e) procapsid. Left three panels show 54Å slabs containing representative particles. Yellow arrows - tails; red arrows - horns. Right panels show the averaged maps, with the number of subvolumes and resolutions. (f) Number of the three types of phage progeny with progression of infection. Forty-seven tomograms of intact cells were ranked by the number of DNA-containing capsids. The numbers of the phage progeny in each cell were plotted against the cell tomogram ranking. The inset shows an expansion of the first ten ranks.
The second phage progeny type consists of spherical particles that are ~10% smaller than the mature Syn513,18. They have a diameter of 590Å and shell thickness of ~50Å (Fig. 3e). In the subvolume average, there is a density extending inward at one location of the shell, which we interpret to be the Syn5 portal. However, we could not locate the icosahedral symmetry axes in these particles because of their spherical shape, and thus cannot definitively assign the inward pointing portal density to an icosahedral vertex. This putative portal is connected to an inner spherical density (~220Å in diameter) that resembles the scaffolding proteins seen in procapsids of other dsDNA phages19,20. Given these characteristics, we concluded that this particle type represents Syn5 procapsids18.
The third particle type is characterized by an angular shape (Fig. 3d) and has not previously been reported in in vitro structural studies. Fifty-three subvolumes comprise this group. Thirty-seven are quantitatively confirmed to have icosahedral symmetry (Methods). Model-free alignment of the 37 particles produced an average with an icosahedral shell and a ~200Å internally protruding density at one of its 12 vertices. The size of the average (~660Å diameter, 40Å shell thickness) matches that of mature Syn513,18. The internally protruding density could correspond to the full-length portal protein complex, possibly with additional proteins and/or DNA. Although the raw individual particles display internal density of variable contrast, shape, size and distribution, their average appears empty (except for the portal) because the locations of these densities with respect to the capsid and the portal are not uniform and are thus averaged out. In closely examining this subvolume average, we noticed that a flat protruding density (~ 40Å in length) outside the capsid shell is present at the portal vertex. This density cannot correspond to the tail hub, which is assembled after the DNA is fully encapsulated. Though our resolution is insufficient to positively identify the density as being the terminase, this density occurs at the position and stage of assembly expected for the terminase21.
This third particle type may correspond to either an abortive particle or a functional intermediate between the procapsid and DNA-containing capsid types. We carried out the following analysis to resolve this ambiguity. Phage attachment to the outer cell membrane and DNA injection into the host cells are not synchronized under our experimental conditions. Therefore, multiple stages of infection and phage assembly are present in different cells at 65 minutes after phage infection. To investigate the order in which the above phage types occur before maturation, we used the number of DNA-containing particles (type 1) per cell as a proxy for the progression of productive infection (Fig. 3f) - the greater the number of DNA-containing capsids inside a cell, the farther the infection has proceeded. As infection progresses, the total number of phage progeny observed increases from 2 to 84 per cell. In cells at early infection stages, procapsids and expanded capsids are seen before DNA-containing capsids appear (Fig. 3f inset). This indicates that procapsids and expanded progeny are assembled before the DNA-containing capsids. With progression of infection, the numbers of procapsid and expanded capsids increase only slightly. This slow rate of increase suggests that these species are short-lived, and progeny exit these states at almost the same rate as they enter them throughout the infection process. The lack of accumulation of procapsid and expanded capsids is consistent with previous biochemical experiments18, and supports the notion that the expanded particles are assembly intermediates after the capsid shell has expanded and acquired icosahedral angularity.
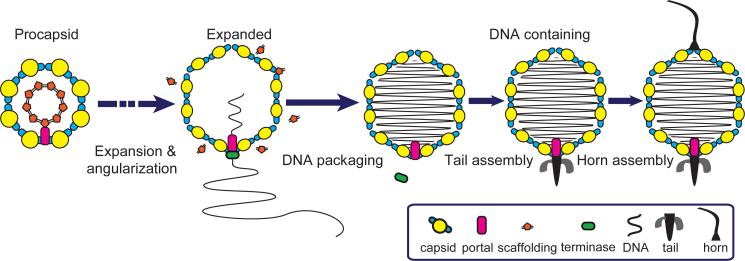
It was not previously known whether shell expansion and DNA encapsulation occur sequentially or simultaneously22,23. Our identification of the expanded intermediates (Fig. 3d) reveals that, in Syn5 and probably some other phages24, the conformational changes of the capsid, the expansion of the shell, and acquisition of angularity, are completed before the full length of viral DNA is packaged (Fig. 4). Those expanded capsids without icosahedral symmetry (16 out of 53, and not included in the average shown in Fig. 3d) may be in the midst of transformation from procapsid to the expanded capsid upon DNA entry.
Figure 4. Phage assembly model revealed by ZPC cryoET.
The phage's pathway to maturation starts with the assembly of the precursor procapsid. Initial insertion of DNA into the capsid induces capsid expansion and angularity. The reorganization of the capsid shell culminates before DNA is fully packaged into it. The tail is then added to the portal vertex after DNA packaging. As the final capsid assembly step, the horn is attached to the vertex opposite to the tail.
The intracellular assembly of many dsDNA phages and viruses – including adenoviruses and Herpesvirus – proceeds through assembly of a precursor procapsid shell, containing scaffolding proteins and a cyclic portal complex defining a unique vertex. Our results show that Syn5 shares the same procapsid-forming pathway as enteric bacteriophages and eukaryotic viruses (Fig. 4). Since cyanobacteria preceded enteric bacteria in evolution, it is reasonable to propose that enteric bacteriophages might have inherited this assembly pathway from cyanophages.
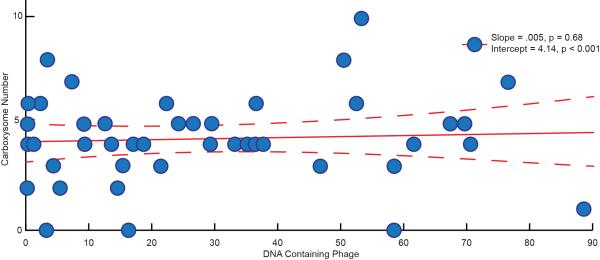
We examined the impact of phage infection on cell physiology by evaluating subcellular components throughout infection. The number of carboxysomes, which often reflects the cellular metabolism level, remained invariant (Extended Data Fig. 3). This observation suggests that phage production does not profoundly perturb the host cell's metabolism until lysis.
Extended Data Figure 3. General linear modelling of cellular carboxysome number with progression of infection.
The number of carboxysomes remains roughly constant as infection progresses, indicating their variation does not correlate with progression of infection.
Our study demonstrates the first application of ZPC cryoET to examine cellular processes without labelling or sectioning. Post-tomographic analyses allowed us to mine the rich trove of spatial and temporal information conveyed by the complex biological process of phage infection and maturation in situ. The value of our imaging approach lies in its ability to study the ancient process of phage assembly in its natural intracellular environment at nanometer resolution, offering the potential to characterize cyanobacterial strains modified for a wide range of applications, including bioenergy development25.
Methods
Host growth and infection
The Syn5 host Synechococcus sp. Strain WH8109 cells were grown in artificial sea water (ASW)13 with continuous aeration in gas dispersion bottles. To make the ASW medium, nine salts (428mM NaCl, 9.8mM MgCl2·6H2O, 6.7mM KCl, 17.8mM NaNO3, 14.2mM MgSO4, 3.4mM CaCl2·2H2O, 0.22mM K2HPO4·3H2O, 5.9mM NaHCO3, 9.1mM Tris) were dissolved in MilliQ water, then pH was adjusted to 8.0 with HCl. After autoclaving and cooling down to room temperature, a trace solution was added to the following final concentrations: 0.77μM ZnSO4·7H2O, 7.0μM MnCl2·4H2O, 0.14μM CoCl2·6H2O, 30μM Na2MoO4·2H2O, 30μM citrate, 5μM ferric citrate. Also, a supplementary salt solution was added to a final concentration of 100μM Na2CO3 and 15μM Na2EDTA·2H2O.
For the infection experiments, cells at exponential phase were infected with Syn5 phage at a multiplicity of infection (MOI) of 5. The cells then were kept in a controlled water bath at 28°C under continuous cool white fluorescent light at intensity of 1200 lux, and a shaking speed of 110rpm. At 65 to 75 minutes post-infection, cells were centrifuged at 8500g for 5 minutes. The cell pellet was gently resuspended in fresh ASW medium and concentrated 100 fold.
Tomographic tilt series acquisition and reconstruction
For cryoET, Syn5 infected WH8109 cell sample was first mixed with 100Å gold fiducial markers to facilitate alignment in data processing. An aliquot of 3.5μl sample was applied to 2.0/1.0μm Quantifoil holey grids (Quantifoil, Germany) and plunge frozen using a Vitrobot (FEI). The frozen, hydrated samples were transferred to a Gatan cryoholder (Gatan, Inc.) and kept at −170°C throughout the imaging session in a JEM2200FS electron microscope (JEOL, Tokyo, Japan). This electron microscope has an in-column energy filter and the slit was set to 15eV. In addition, the microscope was equipped with an airlock system to allow insertion of π/2 Zernike phase plate made of a thin carbon film with a 0.7μm central hole2,6,8. The illumination setting used was: spot size 1; condenser aperture = 70μm; objective aperture = 60μm.
Tilt series of frozen, hydrated samples were collected manually with an electron energy of 200kV under low dose conditions on a Gatan 4kx4k CCD camera (Gatan, Inc.) at 25,000× microscope magnification. The sampling of the data was calibrated to be 4.52Å/pixel. Typically, a tilt series ranged from −60° to 60° at 3° step increment. The accumulated dose for each tilt series was 40-50 electrons/Å2. We set the defocus to near zero for imaging a 0° tilt specimen as judged by the computed FFT of a region next to the specimen of interest, and then used pre-calibrated defocus change for subsequent tilts within a tilt series. We could not afford to use a computer aided focusing for every tilt, because we wanted to minimize the damage to the phase plate from electron exposure. However, we recorded a moderate dose image during our tilt series every 5-10 images to monitor the defocus setting, and to determine the charging status of the phase plate. In general, the defocus values were consistent within 1 μm. The manner and extent of change observed in the FFT varies depending on the initial quality of the phase plate and the cumulative electron exposure to the phase plate. In certain cases, a ring similar to a contrast transfer function (CTF) zero appears at low spatial frequency, as previously shown7. In other cases, an FFT of the image can display different patterns indicative of charging. Once a phase plate was found to suffer from charging, we replaced it with a new one. Of note, there were many times that we had to stop image acquisition in the middle of a tilt series because there was no good phase plate replacement available.
IMOD26 was used to align tilt series and reconstruct tomograms. Since the images of tilted specimens were taken with low dose, it was impossible to detect the CTF rings. However, with resolution limited to ~50-70Å, we can tolerate defocus as high as 5μm without a need for CTF phase flipping. Our targeted defocus values were substantially less than this, so CTF correction was not necessary.
Subvolume alignment and averaging
Subvolumes of progeny phages, found inside infected WH8109 cells, were extracted from 22 good cell tomograms. Initial classification of the procapsid, the expanded capsid, and the DNA-containing capsid was done by visual inspection based on the size and shape of the particles. The classified particles were then subjected to symmetry search (e2symsearch.py from EMAN228, described below), alignment, classification and averaging.
For DNA-containing capsids (type 1 particles), we used the symmetry-searching algorithm to align particles to the icosahedral symmetry axes. Then the particles were subject to a model-free all-vs-all alignment scheme (incorporating hierarchical ascendant classification16,17,29), constrained to search only the 12 vertices to obtain an initial model, in which the special vertex in each particle (containing the portal) was registered to the positive z axis. The high contrast of the ZPC cryoET subvolumes allowed us to further partition the particles manually into three subtypes: with neither tail nor horn, with tail only, and with tail and horn on opposite vertices.
The expanded capsid particles (type 3) have an apparent angular shape. We used the symmetry-searching algorithm to determine whether the particles had icosahedral symmetry. Those with identified icosahedral symmetry (37 out of 53) were subject to the alignment scheme described above to bring the portal vertex in each particle into proper register29. The final average shows few missing wedge artefacts. In addition, the strong icosahedral symmetry of the capsid shell validates our symmetry-free alignment and averaging procedure.
The procapsid particles (type 2 subvolume) are smooth and pseudo-spherical, without apparent icosahedral symmetry as determined by the symmetry search algorithm. We thus used the model-free alignment scheme searching the entire rotational space to obtain an initial model from a subset of particles. We iteratively refined the alignment of the entire dataset using this initial model until no further improvement was observed. The final average lacked detectable icosahedral symmetry.
Symmetry searching algorithm
To align the Syn5 particles to their symmetry axis, we developed a new algorithm: First the algorithm takes a particle in its current orientation and applies icosahedral symmetry to it. If the orientation of the raw particle is aligned near the conventional icosahedral symmetry axes as defined in EMAN27, the symmetrised particle's icosahedral features will be enhanced. If the particle is not so aligned, the symmetrization will smear out the particle into a ball. Next the algorithm computes the normalized cross correlation between the symmetrized and unsymmetrized particles16,17,29, accounting for the missing wedge. A GSL multidimensional simplex minimiser (http://www.gnu.org/software/gsl/) varies the three Euler angles and three translation coordinates of the raw particle, applies icosahedral symmetry to the particle in this new orientation, and computes a new cross correlation score. The GSL minimizer continues to generate new particle orientations by going downhill until the (negative of the) cross-correlation decreases by less than 0.01.
The simplex minimiser does not guarantee a global minimum. We thus repeat the above process ‘n’ times, each time applying a random rotation to the same particle as generally used in a Monte Carlo optimization algorithm. In this process, we will find the global minimum of the cross-correlation if ‘n’ is sufficiently big. In order to speed up the search, we centered the particles before performing the cross-correlation computation. In our experience n=10 is sufficient to determine if the particle has icosahedral symmetry. The judgment of whether the particle has icosahedral symmetry is based not only on the score but also a visual inspection, i.e. the symmetrised particle should have distinct vertices and the correct capsid surface features.
Resolution estimates of the subvolume averages
There is not yet a widely accepted and rigorous standard for resolution estimates of subvolume averages, however, the gold-standard Fourier Shell Correlation (FSC) methodology30,31 used in single particle analysis can be adapted to produce good estimates. Each of the subvolumes for the five phage assembly intermediates were split into two subsets, to compute two independent averages for each, then the FSC was computed between the two averages. The resolution for the combined average of each phage assembly intermediate is then measured using an FSC threshold of 0.14330,32.
Cut-on frequency correction
The effect on low-resolution contrast is primarily due to the cut-on frequencies imposed by the central hole in the Zernike phase plate. The Fourier components of these images below 1/300Å−1 would be lost and between 1/300 - 1/20Å−1 would be highly enhanced. We undertook the following steps to re-scale the Fourier components of the map. We computed a 1-D structure factor derived from a published single particle reconstruction of Syn513 from conventional cryo-EM. This “1-D structure factor” is simply the rotationally averaged power spectrum of the particle structure. It is applied to our subvolume averages such that their 1-D structure factors match this ‘known’ curve. As a rotationally symmetric linear filter, this does not impose any new features on the structure. We used the EMAN127proc3d command to process the averaged subvolumes with the options of “apix=9.04 setsf=syn5-structure-factor lp=40”. This corrects the amplitudes, and then applies a 40Å low-pass filter to suppress high resolution noise. Note that no correction was attempted for subvolume averages of procapsid and expanded capsid because an appropriate structure factor was not available.
Visualization and segmentation
Visualization of the cell tomograms and averaged maps was done using Chimera33. Segmentation and annotation of the cell tomograms were done using Avizo (Visualization Sciences Group, FEI).
Supplementary Material
Acknowledgements
This research was supported by grants from Robert Welch Foundation (Q1242) and National Institutes of Health (P41GM123832 to W.C.; AI0175208 and PN2EY016525 to W.C. and J.A.K.; GM080139 to S.J.L.; T15LM007093 through the Gulf Coast Consortia to W.D. and R.H.R.; T32GM007330 through the MSTP to R.H.R.). We thank Jesús G. Galaz-Montoya and Rossitza N. Irobalieva for editing of the manuscript.
Footnotes
Author Contributions:
W. D., D. R. and C. F. prepared the samples and conducted the infection experiments under the advice of C. H. P. and J. P.. W. D. collected the image data and reconstructed the tomograms; C. F. and H. K. established the Zernike phase plate imaging conditions in the microscope; K. N. provided the phase plates for imaging; R. H. R. performed the statistics analysis. W. D. and M. F. S. developed the imaging processing methods and solved the structures of the phage assembly intermediates; W. D. and X. L. refined the structures; J. F. and S. J. L. developed the symmetry-search algorithm for subvolume alignment; W. D., M. F. S., J. A. K. and W. C. interpreted the structures and wrote the manuscript.
The averaged density maps of the procapsid, expanded capsid and the DNA-containing capsid have been deposited in the EBI under accession codes EMD-5742, EMD-5743, EMD-5744, EMD-5745, and EMD-5746, respectively. The authors declare no competing financial interests.
Supplementary Information is linked to the online version of the paper at www.nature.com/nature.
References
- 1.Danev R, Nagayama K. Phase plates for transmission electron microscopy. Methods Enzymol. 2010;481:343–369. doi: 10.1016/S0076-6879(10)81014-6. [DOI] [PubMed] [Google Scholar]
- 2.Murata K, et al. Zernike phase contrast cryo-electron microscopy and tomography for structure determination at nanometer and subnanometer resolutions. Structure. 2010;18:903–912. doi: 10.1016/j.str.2010.06.006. [DOI] [PMC free article] [PubMed] [Google Scholar]
- 3.Fuller NJ, et al. Clade-specific 16S ribosomal DNA oligonucleotides reveal the predominance of a single marine Synechococcus clade throughout a stratified water column in the red sea. Appl. Environ. Microbiol. 2003;69:2430–2443. doi: 10.1128/AEM.69.5.2430-2443.2003. [DOI] [PMC free article] [PubMed] [Google Scholar]
- 4.Rocap G, Distel DL, Waterbury JB, Chisholm SW. Resolution of Prochlorococcus and Synechococcus ecotypes by using 16S-23S ribosomal DNA internal transcribed spacer sequences. Appl. Environ. Microbiol. 2002;68:1180–1191. doi: 10.1128/AEM.68.3.1180-1191.2002. [DOI] [PMC free article] [PubMed] [Google Scholar]
- 5.Taylor KA, Glaeser RM. Retrospective on the early development of cryoelectron microscopy of macromolecules and a prospective on opportunities for the future. J. Struct. Biol. 2008;163:214–223. doi: 10.1016/j.jsb.2008.06.004. [DOI] [PMC free article] [PubMed] [Google Scholar]
- 6.Danev R, Glaeser RM, Nagayama K. Practical factors affecting the performance of a thin-film phase plate for transmission electron microscopy. Ultramicroscopy. 2009;109:312–325. doi: 10.1016/j.ultramic.2008.12.006. [DOI] [PMC free article] [PubMed] [Google Scholar]
- 7.Marko M, Leith A, Hsieh C, Danev R. Retrofit implementation of Zernike phase plate imaging for cryo-TEM. J Struct Biol. 2011;174:400–412. doi: 10.1016/j.jsb.2011.01.005. [DOI] [PMC free article] [PubMed] [Google Scholar]
- 8.Rochat RH, et al. Seeing the portal in herpes simplex virus type 1 B capsids. J. Virol. 2011;85:1871–1874. doi: 10.1128/JVI.01663-10. [DOI] [PMC free article] [PubMed] [Google Scholar]
- 9.Liberton M, Austin JR, 2nd, Berg RH, Pakrasi HB. Unique thylakoid membrane architecture of a unicellular N2-fixing cyanobacterium revealed by electron tomography. Plant Physiol. 2011;155:1656–1666. doi: 10.1104/pp.110.165332. [DOI] [PMC free article] [PubMed] [Google Scholar]
- 10.Ting CS, Hsieh C, Sundararaman S, Mannella C, Marko M. Cryo-electron tomography reveals the comparative three-dimensional architecture of Prochlorococcus, a globally important marine cyanobacterium. J. Bacteriol. 2007;189:4485–4493. doi: 10.1128/JB.01948-06. [DOI] [PMC free article] [PubMed] [Google Scholar]
- 11.Iancu CV, et al. Organization, structure, and assembly of alpha-carboxysomes determined by electron cryotomography of intact cells. J. Mol. Biol. 2010;396:105–117. doi: 10.1016/j.jmb.2009.11.019. [DOI] [PMC free article] [PubMed] [Google Scholar]
- 12.Schmid MF, et al. Structure of Halothiobacillus neapolitanus carboxysomes by cryo-electron tomography. J. Mol. Biol. 2006;364:526–535. doi: 10.1016/j.jmb.2006.09.024. [DOI] [PMC free article] [PubMed] [Google Scholar]
- 13.Pope WH, et al. Genome sequence, structural proteins, and capsid organization of the cyanophage Syn5: a “horned” bacteriophage of marine synechococcus. J. Mol. Biol. 2007;368:966–981. doi: 10.1016/j.jmb.2007.02.046. [DOI] [PMC free article] [PubMed] [Google Scholar]
- 14.Chang JT, et al. Visualizing the structural changes of bacteriophage Epsilon15 and its Salmonella host during infection. J. Mol. Biol. 2010;402:731–740. doi: 10.1016/j.jmb.2010.07.058. [DOI] [PMC free article] [PubMed] [Google Scholar]
- 15.Hu B, Margolin W, Molineux IJ, Liu J. The bacteriophage t7 virion undergoes extensive structural remodeling during infection. Science. 2013;339:576–579. doi: 10.1126/science.1231887. [DOI] [PMC free article] [PubMed] [Google Scholar]
- 16.Schmid MF. Single-particle electron cryotomography (cryoET). Adv. Protein Chem. Struct. Biol. 2011;82:37–65. doi: 10.1016/B978-0-12-386507-6.00002-6. [DOI] [PubMed] [Google Scholar]
- 17.Schmid MF, Booth CR. Methods for aligning and for averaging 3D volumes with missing data. J. Struct. Biol. 2008;161:243–248. doi: 10.1016/j.jsb.2007.09.018. [DOI] [PMC free article] [PubMed] [Google Scholar]
- 18.Raytcheva DA, Haase-Pettingell C, Piret JM, King JA. Intracellular assembly of cyanophage Syn5 proceeds through a scaffold-containing procapsid. J. Virol. 2011;85:2406–2415. doi: 10.1128/JVI.01601-10. [DOI] [PMC free article] [PubMed] [Google Scholar]
- 19.Chen DH, et al. Structural basis for scaffolding-mediated assembly and maturation of a dsDNA virus. Proc. Natl. Acad. Sci. USA. 2011;108:1355–1360. doi: 10.1073/pnas.1015739108. [DOI] [PMC free article] [PubMed] [Google Scholar]
- 20.Prevelige PET,D, King J. Scaffolding protein regulates the polymerization of P22 coat subunits into icosahedral shells in vitro. J. Mol. Biol. 1988;202:743–757. doi: 10.1016/0022-2836(88)90555-4. [DOI] [PubMed] [Google Scholar]
- 21.Hegde S, Padilla-Sanchez V, Draper B, Rao VB. Portal-large terminase interactions of the bacteriophage T4 DNA packaging machine implicate a molecular lever mechanism for coupling ATPase to DNA translocation. J. Virol. 2012;86:4046–4057. doi: 10.1128/JVI.07197-11. [DOI] [PMC free article] [PubMed] [Google Scholar]
- 22.Aksyuk AA, Rossmann MG. Bacteriophage assembly. Viruses. 2011;3:172–203. doi: 10.3390/v3030172. [DOI] [PMC free article] [PubMed] [Google Scholar]
- 23.Hendrix RW. Bacteriophage assembly. Nature. 1979;277:172–173. doi: 10.1038/277172a0. [DOI] [PubMed] [Google Scholar]
- 24.Fuller DN, et al. Measurements of single DNA molecule packaging dynamics in bacteriophage lambda reveal high forces, high motor processivity, and capsid transformations. J. Mol. Biol. 2007;373:1113–1122. doi: 10.1016/j.jmb.2007.09.011. [DOI] [PMC free article] [PubMed] [Google Scholar]
- 25.Machado IM, Atsumi S. Cyanobacterial biofuel production. J. Biotechnol. 2012 doi: 10.1016/j.jbiotec.2012.03.005. [DOI] [PubMed] [Google Scholar]
- 26.Kremer JR, Mastronarde DN, McIntosh JR. Computer visulasualization of three-dimensional image data using IMOD. J. Struct. Biol. 1996;116:71–76. doi: 10.1006/jsbi.1996.0013. [DOI] [PubMed] [Google Scholar]
- 27.Ludtke SJ, Baldwin PR, Chiu W. EMAN: semiautomated software for high-resolution single-particle reconstructions. J Struct Biol. 1999;128:82–97. doi: 10.1006/jsbi.1999.4174. [DOI] [PubMed] [Google Scholar]
- 28.Tang G, et al. EMAN2: an extensible image processing suite for electron microscopy. J Struct Biol. 2007;157:38–46. doi: 10.1016/j.jsb.2006.05.009. [DOI] [PubMed] [Google Scholar]
- 29.Schmid MF, et al. A tail-like assembly at the portal vertex in intact herpes simplex type-1 virions. PLoS Pathog. 2012;8:e1002961. doi: 10.1371/journal.ppat.1002961. [DOI] [PMC free article] [PubMed] [Google Scholar]
- 30.Rosenthal PB, Henderson R. Optimal Determination of Particle Orientation, Absolute Hand, and Contrast Loss in Single-particle Electron Cryomicroscopy. J. Mol. Biol. 2003;333:721–745. doi: 10.1016/j.jmb.2003.07.013. [DOI] [PubMed] [Google Scholar]
- 31.Henderson R, et al. Outcome of the first electron microscopy validation task force meeting. Structure. 2012;20:205–214. doi: 10.1016/j.str.2011.12.014. [DOI] [PMC free article] [PubMed] [Google Scholar]
- 32.Baker ML, et al. Validated near-atomic resolution structure of bacteriophage epsilon15 derived from cryo-EM and modeling. Proc Natl Acad Sci U S A. 2013 doi: 10.1073/pnas.1309947110. [DOI] [PMC free article] [PubMed] [Google Scholar]
- 33.Pettersen EF, et al. UCSF Chimera - a visualization system for exploratory research and analysis. J. Comput. Chem. 2004;25:1605–1612. doi: 10.1002/jcc.20084. [DOI] [PubMed] [Google Scholar]
Associated Data
This section collects any data citations, data availability statements, or supplementary materials included in this article.


