

Abstract
In vivo studies have suggested that gradients of CXCL12 (aka stromal cell-derived factor 1α) may be a critical guidance cue for neural stem cell (NSC) migration during both brain development and neural tissue regeneration. However, traditional in vitro chemotaxis tools are typically limited by unstable concentration gradients and the inability to decouple cell migration directionality and speed. These limitations have restricted the reproducible and quantitative analysis of neuronal migration, which is a requirement for mechanism-based studies that may guide the development of new therapeutic strategies for neural regeneration. Using a microfluidic gradient generator, we quantified nestin and Sox-2 positive human embryonic NSC chemotaxis within a linear and stable CXCL12 gradient. While untreated NSCs were not able to chemotax within CXCL12 gradients, pre-treatment of the cells with brain-derived neurotrophic factor (BDNF) resulted in significant chemotactic, directional migration. BDNF pre-treatment had no effect on cell migration speed, which averaged about 1 μm min−1. Quantitative analysis determined that CXCL12 concentrations above 72 ng ml−1 (9.0 nM) are above the minimum activation threshold, while concentrations below 117 ng ml−1 (14.7 nM) are below the saturation threshold. Interestingly, although inhibitor studies with AMD 3100 revealed that CXCL12 chemotaxis requires receptor CXCR4 activation, BDNF pre-treatment was found to have no profound effects on the mRNA levels or surface presentation of CXCR4 or the putative CXCR7 scavenger receptor. The microfluidic study of NSC migration within stable chemokine concentration profiles provided quantitative analysis as well as new insight into the migratory mechanism underlying BDNF-induced chemotaxis towards CXCL12. These data will provide quantitative guidance in the development of new strategies to enhance the homing of endogenous and exogenous NSCs for clinical tissue regeneration therapies.
Keywords: microfluidic gradient generator, neural stem cell, CXCL12, BDNF, chemotaxis
1. Introduction
Stroke is the leading cause of serious long-term adult disability, and the third leading cause of death in the United States. [1] Currently there is no effective treatment for stroke. For more than two decades, research has focused on discovering potential neuroprotective drugs to protect ischemic brain tissue from cell death. However, all phase III clinical trials based solely on neuroprotection have failed to achieve primary outcomes, [2] despite being effective in animal stroke studies. Current research is heavily focused on using stem cell therapy to stimulate both endogenous and transplanted neural stem/progenitor cells (NSCs) for neural tissue regeneration.[3] NSCs are a subset of self-renewing and multipotent cells that exist in embryos as well as in the adult central nervous system (CNS).[4] During embryogenesis, embryonic NSCs differentiate into more committed progenitor cells in response to a variety of localized gradients and migrate from the sub ventricular zone (SVZ) to superficial layers of the cortical plate for proper positioning.[4–5] In adult animals, transplanted NSCs have been shown to migrate to ischemic areas, stimulate neural regeneration, and improve pathological condition.[3b, 4a, 6] However, very little is known about what mobilizes and directs NSCs across great distance towards injury sites. Particularly, the lack of quantifiable data on NSC chemotaxis has greatly hindered the progress in developing new therapeutic approaches to enhance NSC homing for clinical applications.
Directional migration is the first critical step in stem cell engagement for both normal development and tissue regeneration.[3] A variety of in vivo and in vitro migration and chemotaxis assays have been developed to investigate how various factors act individually or collectively to regulate cell migration. In vivo experiments often co-map chemokine protein expression and NSC location or study the changes in NSC distributions upon silencing of a chemokine gene.[7] Many in vitro migration assays are restricted to measurements of cell motility (i.e. chemokinesis or migration rate). For example, the chain migration assay and the neurosphere migration assay[8] measure the distance of NSC radial migration out of SVZ fragments or adherent neurospheres, respectively.[8–9] In vitro chemotaxis assays, on the other hand, usually generate a immobilized[10] or diffusible[11] chemical gradient to induce polarized cell migration; however, most of the gradient profiles are transient, unstable, and hard to reproduce (e.g. micropipette assays,[12] Boyden chambers,[13] Zigmond chamber,[14] Dunn chambers[15]).
Currently, the most widely used chemotaxis tool, the modified Boyden chamber, quantifies cell migration into or through a porous membrane (with 3 to 10 μm pores) towards a putative chemotactic factor.[3b, 16] Limitations of this assay include the unstable concentration gradient, distortion of local gradients in and around the pores, and lack of direct observation of cell behavior during the experiment. As a result, an increase in chemokinesis (i.e. the speed of random cell migration) can be falsely interpreted as chemotaxis in Boyden chamber experiments. Many other cell chemotaxis tools, such as the Dunn chamber,[15] Zigmond chamber,[14] open-surface micro-jet devices[17] and the multi-injector[18] have relatively stable gradients at short timescales, however the gradient steepness decays over long-term.[15] Other microfluidic gradient generators for mammalian cells, such as the serpentine-shaped flow network devices,[19] create long-term (>12 hrs) stable gradients, but the presence of shear flow often polarizes cell bodies, alters cell behavior, and induces biased cell movement.[20] To address these issues, we previously have reported a shear-free microfluidic device that generates long-term linear and stable chemokine gradients. [21] This design belongs to the family of microfluidic devices that utilize microcapillaries,[22] hydrogel[23] or membranes[24] to restrict convective flow while still enabling Fickian diffusion to generate soluble,[22–24] as well as surface-bound,[25] chemical gradients. In this study, we used a similar microfluidic platform to quantitatively investigate NSC chemotaxis to stromal cell-derived factor α (SDF-1 α, CXCL12).
CXCL12 and its receptors, CXC chemokine receptor 4 (CXCR4) and CXCR7 (RDC1), are promising targets for therapeutic activation of NSCs in regenerative medicine. CXCL12 is secreted by bone marrow stromal cells and several types of cancer cells. It is up-regulated by local astrocytes and endothelium near an infarcted area. [3b] The CXCL12/CXCR4 pathway has been shown to modulate growth factor induced-NSC self renewal,[26] to mediate NSC homing to endothelial cells in the vascular niche,[16b] and to be critical for cortical interneuron migration in early embryonic development.[27] Several in vivo [3b] and in vitro [28] studies have implicated CXCL12 as a chemotactic cue for NSCs, while others have observed no evidence for CXCL12-induced chemotaxis of undifferentiated nestin-positive neural progenitors.[29] Furthermore, discrepancies between reported cell responses and dose requirements among different studies are common, presumably due to variations in selected animal models, lack of quantitative experimental setups, and the heterogeneous nature of NSC phenotype at various differentiation stages.[4]
Several different approaches have been proposed to activate or enhance CXCL12-mediated NSC cell homing. Recently, brain-derived neurotrophic factor (BDNF), a member of the “neurotrophin” family of growth factors, was reported to improve implanted NSC survival and functional recovery in hypoxic-ischemic stroke.[30] These benefits were specifically hypothesized to occur due to the ability of BDNF to mediate and enhance NSC homing to CXCL12. While in vitro Boyden chamber assays in that study were consistent with this hypothesis, the lack of direct observation and quantitative analysis of individual NSC movements make it difficult to differentiate whether the migratory mechanism of action is primarily a result of chemokinesis or chemotaxis. Furthermore, it is unknown whether BDNF potentiates CXCL12 induced migration interaction with the putative CXCL12 receptor (CXCR4) or through an alternate biochemical pathway. These highly promising animal study results encourage and require rigorous quantitative study of chemokine-induced NSC chemotaxis in order to further improve NSC homing for clinical applications.
Here we describe and utilize a microfluidic platform to analyze the migratory behavior of embryonic human NSCs within stable linear CXCL12 gradients. Cell movements are individually tracked and digitally analyzed for speed and directionality. We observe that human embryonic NSCs are unable to chemotaxis to CXCL12 under cultured control conditions within a CXCL12 gradient (44 ng ml−1 mm−1). In stark contrast, NSCs pretreated with BDNF exhibited directional chemotaxis towards CXCL12 without altering their migration speed, but with enhanced cell migration directionality. A CXCR4 antagonist, AMD3100, decreased NSC motility and blocked the directional migration induced by CXCL12. Interestingly, BDNF pretreatment alone did not significantly alter the mRNA or the surface protein expression of CXCR4 or CXCR7. Our study provides direct quantitative evidence that gradients of CXCL12 ranging from 72–117 ng ml−1 can induce NSC chemotaxis via the CXCR4 pathway, although a “triggering” event, such as the presence of BDNF, is necessary to enable efficient chemotaxis. This type of quantitative analysis of NSC chemotaxis will guide the further development of clinical therapies to improve stem cell homing of both endogenous and exogenous NSCs.
2. Results
2.1. Devcie validation and NSC culture characterization
To induce NSC chemotaxis, cells were exposed to a stable CXCL12 concentration profile within a microfluidic gradient generator, which was modified from our previous designs [21a] for optimized device fabrication and operation processes. Specifically, micro-capillaries (10 μm height,12 μm width, 250 μm length) were used to connect the cell culture chamber (100 μm height, 1mm width, 4 mm length) with the sink and source channels (100 um height, 500 um width, 4 mm length) to allow diffusion (Figure 1A). Cell culture medium alone was pumped through the sink channels while CXCL12 was added into the medium flowing through the source channels, both at a flow rate of 3 μl hr−1. At equilibrium, a linear and stable gradient across the center cell culture chamber was generated due to Fickian diffusion through the micro-capillaries, which restrict convective flow across the cell culture chamber (Figure 1B). The CXCL12 concentration gradient was visualized and quantified by the fluorescent intensity profile of Texas Red-conjugated dextran, which has a similar molecular weight as CXCL12 (10 kDa) (Figure 1B). For this device and flow conditions, the resulting concentration profile was found to be linear with a gradient slope of 44 ng ml−1 mm−1, and minimum and maximum concentrations of 72 and 117 ng ml−1, respectively.
Figure 1.

CXCL12 gradient verification and NSC characterization. (A) Structure of the microfluidic gradient generator device. A cell culture chamber is connected to sink (blue) and source (red) channels via micro-capillaries (not observable at this magnification). (B) At equilibrium, a linear and stable CXCL12 gradient was generated across the cell culture chamber, as quantified by the fluorescence intensity of a tracer molecule (Texas Red-conjugated dextran, 10 kDa). Confocal microscopy of NSCs derived from human embryonic stem cells revealed positive immunostaining for two NSC markers nestin (C) and Sox-2 (D) and counter-staining with DAPI to visualize cell nuclei (E).
NSCs are multipotent progenitor and stem cells that have been found in both the developing and adult brain. The human NSCs investigated in this study were derived from NIH approved H9 human embryonic stem cells and were maintained as monolayers. Cultured cells showed positive immunostaining for the NSCs markers nestin and Sox-2 (Figure 1C, D). The cells were proliferative and over 95% of them expressed nestin and Sox-2 consistently for at least 10 passages, indicating that the majority of the cells retained NSC characteristics (Figure 1E). To exclude potential mitogenic effects of BDNF and CXCL12 that might hinder cell migration, we used a CyQuant cell proliferation assay to quantify cell proliferation after 48-hr treatment with or without BDNF and/or CXCL12. Only a modest but not statistically significant increase (< 20%) in cell number was observed compared to control cell cultures (Figure 2C), suggesting that BDNF and CXCL12 are not strong mitogens for NSCs, and the difference in mitogenic activity is unlikely to affect migration behavior. In addition, because each individual cell is tracked within the microfluidic device, cell migration and division events are explicitly distinguished.
Figure 2.
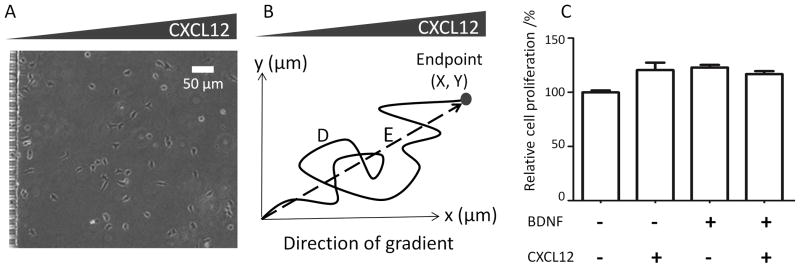
Experimental assay and data analysis. (A) Human embryonic NSCs were loaded into microfluidic devices mounted on chamber slides, resulting in random cell seeding. The migratory path of each individual cell within a stable CXCL12 gradient was tracked for up to 17 hrs. (B) The migration speed (D/time) and chemotactic index (X/D) were calculated for each cell track. (C) CXCL12 and/or BDNF did not significantly increase NSC proliferation upon 48-hr exposure (p > 0.05).
2.2. NSC chemotaxis within stable CXCL12 gradients
Human NSCs were injected into the polyornithine/laminin coated device and allowed to adhere for 1 hr, resulting in a random distribution of cell initial positions (Figure 2A). Upon application of a linear CXCL12 gradient, no NSC chemotaxis towards the chemokine was observed in either the 4-hr short-term (Figure 3A,B) or the 17-hr long-term exposures (Figure 3C,D). Individual cell tracks were recorded by time-lapse microscopy and plotted, with all cell initial positions at the origin (0,0) (Figure 3). The number of cells migrating towards (red tracks) or away from (black tracks) the CXCL12 source was not significantly different (Figure 3A,C). Similarly, angular histograms of the final positions showed a relatively even distribution, and statistical analysis yielded Rayleigh p-values greater than 0.05 (0.77 and 0.61 for 4 hr and 17 hr, respectively, Figure 3B,D), indicating that the cell migration was random and not polarized towards a certain direction. Chemotactic indices (CI, calculated from individual cell tracks as X/D, Figure 2B) were widely dispersed with a median close to 0 for both time points (Figure 4A), suggesting that there was no uniform directional movement along the concentration gradient. Interestingly, distribution of chemotactic indices was much narrower at 17 hr compared to 4 hr, indicative of a more uniform cell response (Figure 4A).
Figure 3.

NSC cell tracks and angular histograms of cell endpoint positions. Individual cell tracks (A,C,E,G,I) are plotted with all cell initial positions at the origin (0,0). The number of cells migrating towards (red tracks) or away from (black tracks) the CXCL12 source is given for each condition. The center of mass for the endpoint positions is marked with a gold star. For angular histogram plots (B,D,F,H,J), the Rayleigh p-value of each endpoint distribution is shown, with p < 0.05 suggesting a statistically significant asymmetric distribution. No significant NSC chemotaxis towards CXCL12 was observed during 4-hr (A,B) or 17-hr (C,D) observations. A 1-hour BDNF pretreatment induced chemotaxis towards CXCL12 during both 4-hr (E,F) and 17-hr (G,H) observations. Treatment with AMD 3100 for 1 hr following a 1-hr BDNF exposure caused a loss of directional cell migration towards CXCL12(I, J).
Figure 4.

Quantification of cell chemotactic index and migration speed. (A) Chemotactic indices showed broad population distributions at 4 hr and became narrower at 17 hr. BDNF treatment significantly increased chemotactic indices, while AMD 3100 treatment significantly attenuated NSC chemotaxis. (B) Cell migration speed was similar across all observation times and BDNF treatments, but decreased upon treatment with AMD 3100. * p<0.05, ***p<0.001
We next tested the effects of BDNF pretreatment on CXCL12 mediated NSC chemotaxis. NSCs were pretreated for 1 hr in suspension with or without 100 ng ml−1 BDNF before cell seeding into the microfluidic devices. A greater number of cells were found to migrate towards the CXCL12 source compared to away from the source for both the 4-hr and 17-hr exposures (Figure 3E,G). The 4-hr time point angular histogram showed a statistical polarization towards higher concentrations of CXCL12, with a Rayleigh p-value of 9.47E-4, indicating directional movement (Figure 3F). While the median chemotactic index was significantly increased compared to that for non-BDNF treated cells, the entire cell population still displayed a high degree of heterogeneity (Figure 4A). At 17 hr, the polarization of the angular histogram became even more prominent (p-value of 7.37E-22, Figure 3H). The center of the cell mass (marked as a star) in the plot of cell tracks moved significantly toward the CXCL12 source (Figure 3G). Similar to the results without BDNF pretreatment, heterogeneity of the population’s CI was significantly narrowed at 17 hr compared to 4 hr, even though the median CI was similar at both times (Figure 4A). Across all time points, the NSC speed did not change with or without BDNF treatment (Figure 4B).
We hypothesized that the enhanced NSC chemotaxis to CXCL12 by BDNF pretreatment is mediated through CXCR4 signaling. To test this hypothesis, we treated the NSCs with AMD 3100, a symmetric bicyclam antagonist of the CXCR4 receptor that inhibits CXCL12/CXCR4 binding.[31] NSCs stimulated with BDNF followed by AMD 3100 treatment before exposure to CXCL12 caused a loss of uniform directional cell migration, as seen in both the plot of cell tracks and the angular histogram (Figure 3I, 3J). The median CI of AMD 3100 treated cells was close to 0, indicating no collective directional cell movement (Figure 4A). At the same time, cell migration speeds were also significantly slower compared to all non-AMD 3100 treated samples (Figure 4B).
Cell chemotaxis in response to many migratory cues is affected by both the relative and absolute concentration differences across a cell body. In addition, soluble chemotactic factors have a minimum concentration required to induce cellular response (i.e. the activation threshold) and a maximal concentration above which cells can no longer efficiently polarize (i.e. the saturation threshold). To evaluate the range of absolute CXCL12 concentrations used in our experiments, we divided the cell tracks into four zones based on their initial positions, zones I to IV (Figure 5A). The steepness of the gradient was the same across all four zones, while the average absolute CXCL12 concentrations were 78, 89, 100, and 111 ng ml−1, from zones I to IV, respectively (Figure 5A). Cells in all four zones exhibited similar CXCL12-induced directional migration, as quantified by CI (Figure 5B). In contrast, the migration speed of cells in zone IV was significantly lower than zones I–III (Figure 5C). Post-experimental analysis of the individual cell tracks in zone IV revealed that more than 90% of the cells migrated towards and came into contact with the capillary structure adjacent to the CXCL12 source, which impedes further migration and presumably results in an artificially lower average cell speed.
Figure 5.

Evaluation of NSC chemotaxis within various CXCL12 concentrations. (A) To evaluate the range of absolute CXCL12 concentrations that induced cell polarization, cell tracks were divided into groups based on their initial positions within zones I, II, III, or IV. Absolute CXCL12 concentration increases across the four zones, while gradient steepness is identical. (B) Cells in all four zones exhibited similar chemotactic indices. (C) Cell migration speed was similar in zones I, II, and III, while cells in zone IV migrated more slowly, due to cell interactions with culture chamber wall, which impedes further migration and results in an artificially lowered average cell speed, * p<0.05.
2.3. Analysis of CXCL12 receptor and integrin expression
To investigate the effect of BDNF pretreatment on receptor expression, Real-Time Polymerase Chain Reaction (quantitative PCR, qPCR) was carried out to quantify both CXCR4 and CXCR7 mRNA levels after BDNF exposure for 1 hr (similar to the chemotaxis experiments above) or 24 hr. For both the 1-hr short-term and the 24-hr long-term treatments, BDNF only marginally (less than two fold) upregulated CXCR4 and CXCR7 mRNA (Figure 6A,B). In addition, mRNA of integrin α6, but not β1, was slightly upregulated by BDNF treatment (Figure 6B). Cell surface receptor expression was quantified by immunostaining and flow cytometry with and without BDNF treatment for 1 hr. Human embryonic NSCs immunostained positively for both putative CXCL12 receptors, CXCR4 and CXCR7, indicating that both chemokine receptors are presented by these cells. Consistent with the mRNA data, BDNF treatment did not significantly alter the surface profiles of either CXCR4 or CXCR7 (Figure 6C,D).
Figure 6.

Analysis of receptor and integrin expression. (A) qPCR analysis shows no significant changes in mRNA transcript levels for CXCR4 or CXCR7 upon 1-hr BDNF exposure. (B) Upon 24-hr BDNF treatment, mRNA transcripts for CXCR4, CXCR7, and the α6 integrin sub-unit were marginally upregulated (less than two fold), while the β1 integrin sub-unit had no change * p<0.05. Flow cytometry analysis demonstrated that cell surface receptor expression of CXCR4 (C) and CXCR7 (D) was not significantly altered by BDNF treatment for 1hr.
3. Discussion
NSCs are thought to respond to a variety of extracellular soluble cues, including vascular endothelial growth factor (VEGF), [28c, 29, 32] monocyte chemotactic protein-1 (MCP-1),[33] growth-related oncogene α (GROα),[33a] monocyte chemotactic protein 2 (MCP-2) [33b] and CXCL12,[28a, 28b, 29, 33b, 34] to regulate proper positioning during embryonic development and/or to activate and navigate their migration to injury sites during tissue regeneration. Therefore, the quantitative evaluation of potential NSC chemotaxis in response to these extracellular soluble cues is a critical goal. However, the majority of in vitro chemotaxis studies on neuron stem/progenitor cells are based on assays with unstable concentration gradients that change over time. This limitation of traditional in vitro chemotaxis tools has led to difficulties in data reproducibility, discrepancies about NSC chemotactic capabilities, and variations in the reported minimal/maximal chemokine concentrations required to induce chemotaxis.[35] Quantitative analysis of NSC migration behavior and in-depth interpretation of such data for studying the mechanism of chemotaxis and for potential clinical applications have been seriously restricted. In this study, we investigated NSC chemotaxis to CXCL12 using an advanced microfluidic platform that provides a long-term stable linear concentration gradient in a shear-free cell culture chamber that allows reproducible and unbiased study of cell migration through direct viewing of cell movement. This experimental design enables simultaneous but independent quantification of cell speed and cell directionality at several chemokine concentrations within a single device, thereby differentiating chemokinetic and chemotactic migratory mechanisms. Furthermore, the capability for single cell and subpopulation analysis provides valuable insight into the heterogeneity within the NSC culture.
CXCL12 is a small cytokine belonging to the chemokine family. It has been reported to regulate migration of various cell types, including lymphocytes, [36] macrophages,[37] hematopoietic cells,[38] endothelial progenitor cells,[39] neuroblastoma cells [40] and epidermal growth factor stimulated breast cancer cells.[41] However, conflicting reports have suggested that CXCL12 may[28a, 28b, 42] or may not [29] be chemotactic for NSCs. Furthermore, the ability of CXCL12 to stimulate NSC proliferation or to increase NSC motility is still under debate.[16b] In the nervous system, CXCL12 is highly expressed both during development and in adulthood [28a] with a remarkably conserved primary structure across species.[43] In CNS development, the CXCL12/CXCR4 system modulates chain migration and formation of normal cortical layers.[3b] In adult brain, the CXCL12/CXCR4 pathway is critical for maintaining the NSC vascular stem cell niche and promotes adult SVZ NSC homing to the niche. [16b] In addition, inflammation in ischemic areas has been shown to upregulate CXCL12 expression in local astrocytes and endothelium to recruit NSCs.[3b] CXCR4 expression by NSCs has been widely reported [26, 28b] and has been suggested as an additional marker for NSCs.[26] Consistent with previous studies, we found that CXCR4 was highly expressed in human embryonic NSCs that were positive for both nestin and Sox-2. Despite the presence of CXCR4 on the cell surface, human embryonic NSCs were unable to chemotax within a CXCL12 gradient with a steepness of 44 ng ml−1 mm−1. Similarly, Barkho and colleagues also reported a lack of chemotaxis to CXCL12 in nestin positive adult human NSCs, which also express CXCR4. [29] It has been suggested that the chemotactic responsiveness of NSCs may differ across differentiation stages;[28c] while undifferentiated, immature NSCs may not respond to CXCL12 gradients, DCX and Tuj1 positive mature neurons exhibited chemotaxis.[29] Furthermore, animal species, age, and developmental stage may also cause variations in observed NSC behaviors. Our data suggest that the presence of the CXCR4 receptor is not a sufficient condition to enable embryonic NSC chemotaxis to CXCL12. The presence of other modulatory cues may be required to alter NSC sensitivity to CXCL12 and collectively regulate NSC migration.
We demonstrate that BDNF is capable of modulating NSC chemotaxis to CXCL12 gradients. By tracking cell movement over time, we were able to dissect and analyze cell migration with two separate parameters, directionality and speed. The histogram of NSC endpoint positions became polarized within 4 hr (Figure 3, Figure 4A), and the asymmetry became more prominent by 17 hr, with higher cell numbers migrating towards elevated CXCL12 concentrations. Quantitative data on NSC chemotaxis directionality are very limited, mainly because traditional Boyden chamber assays are incapable of individual cell analyses of directionality and speed. Our results show that BDNF treatment specifically affects the directionality of NSC migration, but not migration speed (Figure 4A, B), implying that the regulation of directionality and speed may be independent of each other. Furthermore, our data indicate that BDNF-induced NSC chemotaxis to CXCL12 is mediated through the CXCL12/CXCR4 system, as blocking this pathway with AMD 3100 abolished the modulatory effect of BDNF on NSC chemotaxis.
The wide dispersion of cell chemotactic indices and speeds (Figure 4) indicates that the NSC responses to BDNF pretreatment and CXCL12 stimulation were inherently heterogeneous. In fact, NSCs are not a uniform cell population, but a mixed pool of stem cells and various cell-type lineage progenitors that are produced in a temporal and spatial manner.[4] As a result, cell responses observed in this study were not uniform and did not necessarily obey a normal distribution. It has been reported that BDNF may affect the migration of only particular progenitors at limited developmental stages during cortical lamination. [44] Similarly, neural stem cell line chemotactic properties have been reported to vary with differentiation stage.[28c] Interestingly, the observed NSC response became more uniform and significant upon observation for 17 hr compared to only 4 hr, suggesting that there is a time delay for some NSCs to process the BDNF and CXCL12 stimulation and adjust their migration behavior to produce prominent cell responses.
The mechanism of BDNF-stimulated NSC chemotaxis to CXCL12, however, is not completely understood yet. Previously, BDNF has been shown to promote neural progenitor cell survival[45] and to stimulate neuronal differentiation.[46] In SH-SY5Y neuroblastoma cells over-expressing the BDNF receptor TrkB, BDNF induced CXCR4 internalization and decreased CXCR4 mRNA to modulate CXCR4 availability implicated in HIV infection.[47] The binding of CXCL12 to CXCR4 activates G protein signaling and subsequent cell responses. On the other hand, an alternative CXCL12 receptor, CXCR7, does not activate G protein signaling, but scavenges CXCL12 from the extracellular environment.[48] Our results indicate that the increased NSC chemotaxis to CXCL12 was indeed CXCR4 mediated, since AMD 3100, a well-known CXCR4 antagonist, completely attenuated NSC chemotaxis to CXCL12. However, BDNF pretreatment alone did not result significantly altered CXCR4 or CXCR7 mRNA levels within 1 hr (Figure 6A). A 24-hr BDNF treatment, however, increased mRNA levels of both receptors significantly but with small amplitude (less than a two-fold change). In addition to CXCL12 receptors, integrin expression was also quantified, since NSC migration can be significantly affected by cell interactions with extracelluar matrix proteins.[9a, 49] To promote NSC attachment, the microfluidic device surfaces were coated with laminin, which has been reported to promote NSC chemotaxis. The α6 and β1 integrin subunits are involved in the regulation of NSC proliferation by laminin, as well as NSC migration, homing[16b] and differentiation.[9a, 49] Our results showed that BDNF pretreatment only marginally upregulated α6, but not β1, mRNA within 24 hrs.
Although qPCR is precise at quantifying mRNA transcripts, it typically provides no details about individual cell differences, but instead averages the measurement across the whole cell population. Furthermore, the level of cell surface receptor presentation may not be directly related to mRNA transcript level, and receptor presentation has been directly correlated to ligand-receptor binding-induced chemotaxis.[21b] For this reason we also used flow cytometry to profile NSC surface protein expression at the single-cell level. Similar to the mRNA results, the amount of CXCR4 and CXCR7 receptors present on the plasma membrane did not change significantly with BDNF treatment, as the population distributions exhibited overlapping histograms (Figure 6 C,D). Taken together, our results suggest that the observed BDNF-enhanced NSC chemotaxis to CXCL12 is potentially mediated through either direct modulation of CXCL12/CXCR4/CXCR7 interactions or modulation of downstream signaling pathways that influence cell differentiation and/or cell migration.
Because the concentration profile (both the absolute concentration and the concentration gradient steepness) is exactly specified for every (x,y) coordinate in the microfluidic device, the cell migration tracks can be further analyzed on the basis of their starting positions (Figure 5). Zone I to zone IV across the center cell culture chamber had the same steepness of concentration gradient but different average absolute CXCL12 concentrations (78–111 ng ml−1, corresponding to 9.7–13.9 nM). NSC chemotactic indices had similar medians and overlapping distributions across the four zones. Cell speeds were lower in zone IV, which was the zone closest to the CXCL12 source channel. NSCs in this region were more likely to reach the source-side capillaries as they underwent chemotactic migration towards the CXCL12 source. Once in contact with the capillary structure, further migration was prevented by the solid capillary structure. In contrast, cells in zone I, which was closest to the sink channel, were most likely undergoing chemotactic migration away from the sink capillary structure; therefore, the average migration speed in zones I through III were similar. A dissociation constant of 2–4 nM has been reported for CXCL12/CXCR4 binding.[50] Our data indicate that 72 ng ml−1 (9.0 nM) is above the activation threshold to stimulate NSC chemotaxis. In addition, our data suggest that 117 ng ml−1 (14.7 nM) is below the saturation threshold for CXCL12 to induce polarized cell responses. One possible mechanism by which cells may avoid CXCL12 signaling saturation is through CXCR7-mediated ligand scavenging.[48] CXCR7 was also present on our embryonic NSCs; therefore, constant clearing of CXCL12 by CXCR7 may have contributed to the observed broad concentration range that resulted in cell polarization without reaching the saturation limit. Further investigations are in progress to validate these hypotheses, to quantify the exact activation/saturation concentration thresholds for NPC chemotaxis, and to study how various CXCR4/CXCR7/TrkB receptor levels affect BDNF pretreatment-induced NSC migration.
Microfluidic-based assays are a significant addition to the tool kit available for stem cell research. The strength of microfluidic based assays lies in their capability to precisely manipulate biochemical and biophysical cellular microenvironments. For example, here we generate spatially controlled concentration profiles at sub-cellular levels to induce desired cell responses. Another example is the organization of various biological cues to construct artificial stem cell niches to either maintain cell stem-ness[51] or to promote differentiation.[19b] In addition, because of the small fluidic volume within such devices, less reagent and fewer cells are needed for each experiment, thus making it possible to perform parallel and high throughput screening with limited cellular and chemical resources. This is particularly beneficial for research that requires the harvest of rare stem cells, such as cancer stem cells found in the blood.[52] Over the years, a great number of microfluidic devices have been developed for stem cell isolation, culture, differentiation and chemotaxis studies. Here we demonstrate that microfluidic chemotaxis tools can generate defined, stable chemical gradients and enable the detailed analysis of individual cell migration paths. Use of microfluidic chemotaxis assays will likely accelerate the identification of specific progenitor/stem cell phenotypes that are capable of efficient chemotaxis as well as the discovery of treatments that can enhance chemotaxis. These discoveries will enable investigation into the mechanisms underlying chemotaxis and may be applied in the development of clinical strategies to promote stem cell homing for regenerative medicine therapies.
4. Conclusions
The microfluidic platform used in this study enabled the dynamic analysis of multiple individual human embryonic NSCs within a stable linear concentration gradient inside a shear-free microenvironment. We provide evidence that BDNF pretreatment significantly enhances NSC chemotaxis toward CXCL12 by increasing cell migration directionality, but not speed. BDNF pretreatment alone does not affect cell surface receptor expression of CXCR4 or CXCR7, two putative CXCL12 receptors. However, blocking of CXCR4 with AMD 3100 completely abolished NSC migration towards CXCL12, suggesting that BDNF-mediated chemotaxis towards CXCL12 requires CXCR4 activation. Quantitative studies of NSC migration responses within stable chemokine concentration profiles are likely to reveal new insights into CNS developmental processes and to provide guidance in the development of clinical tissue regeneration strategies.
5. Materials and methods
5.1. Cell culture and immunocytochemistry
Human neural stem cells (ENStem-A, Millipore, Billerica, MA) were derived from NIH approved H9 human embryonic stem cells and were cultured as monolayers on poly-ornithine (20 μg ml−1) and laminin (5 μg ml−1) coated tissue culture dishes. Cells were maintained in human neural stem cell expansion medium (Millipore) supplemented with EGF (20 ng ml−1), FGF (20 ng ml−1), and L-Glutamine (2 mM). Cells were fed with fresh medium once every two days and passaged at a ratio of 1:2. To quantify cell proliferation, cells were cultured with or without BDNF and/or CXCL12 for 48 hrs before being evaluated by a CyQuant cell proliferation assay (Invitrogen Corp., Carlsbad, CA) in a 24-well plate format. For immunofluorescence staining, cells were fixed with 4% paraformaldehyde, blocked and permeabilized with 0.1% Triton X-100 and 10% normal donkey serum in phosphate buffered saline, and labeled with the following antibodies: primary mouse anti-nestin, primary rabbit anti-Sox2, secondary donkey anti-mouse IgG Cy3 conjugated, secondary donkey anti-rabbit IgG FITC conjugated (Millipore). Cells were then mounted with ProLong® Gold antifade reagent with DAPI staining (Invitrogen Corp.). Fluorescent cell images were taken on a Leica SPE confocal microscope (Leica Microsystems Inc., Buffalo Grove, IL) using a 40X oil objective.
5.2. Microfluidic device fabrication
The pattern of the microfluidic gradient generator was designed in AutoCAD (Autodesk, Inc., San Rafael, CA). Devices were fabricated using standard soft lithography protocols.[21a] Briefly, a two-layer SU8 (MicroChem Corp., Newton, MA) master consisting of a 10-μm height capillary layer and a 100-μm height chamber layer was fabricated on a silicon wafer (Figure 1A,B), then treated with (3-aminopropyl) trimethoxysilane (Sigma, St. Louis, MO) as a release layer. To make polydimethylsiloxane (PDMS) devices, a 10:1 w/w mixture of Sylgard 184 monomer and hardener (Dow Corning, Corning, NY) was degassed under vacuum for 20 min to remove air bubbles, then poured over the SU8 master in a dish and baked at 65°C for 1 hr to cure. Inlet and outlet fluidic ports were punched out using tissue biopsy punches (SYNEO Corp., Angleton, TX). Permanent bonding between PDMS chips and the cover glass of Lab-Tek™ chamber slides (Nalge Nunc International, Rochester, NY) was achieved by a 40-sec oxygen plasma treatment at 80 watts (Branson IPC oxygen plasma Asher, Hayward, CA).
5.3. Chemotaxis assay
Microfluidic devices were UV sterilized in a biosafety hood for 30 min, then rinsed twice with 70% ethanol and sterile distilled water. The inner surface of the cell culture chamber was coated with poly-ornithine and laminin (Sigma, St. Louis, MO) for 1 hr each. NSCs were disassociated from the culture dish surface with Accutase, resuspended in cell culture medium at 1.2 ×10⁶ cells ml−1, and introduced into the cell culture chamber with a pipette. Cells were allowed to attach for 1 hr at 37°C in a 5% CO2 tissue culture incubator. For BDNF (R&D Systems, Minneapolis, MN) pretreatment, cells were first exposed to BDNF(100 ng ml−1) for 1 hr in suspension and then treated with or without AMD 3100 (5 μM, Sigma, St. Louis, MO) for 1 hr before cell seeding. Upon cell adhesion to the bottom surface, the fluidic inlet and outlet ports for the center cell culture chamber were closed with plugs. Flow through the sink (with medium alone) and source (medium with 330 ng ml−1 CXCL12) channels was maintained at 3 μl h−1 using a syringe pump (WPI SP2201, World Precision Instruments, FL). Devices were imaged on a phase contrast, time-lapse microscope (Carl Zeiss LLC, Thornwood, NY). Two grooves were machined on a P-Lab-Tek S1 heating insert (PeCon, Germany) to accommodate fluidic tubing. A CO2 cover was used with the Lab-Tek insert to maintain CO2 level at 5%. Air temperature was kept at 37°C with a microscope environmental chamber (Carl Zeiss LLC.). Cell positions were recorded once every 10 min for 4 or 17 hrs. To simulate the concentration gradient profile of CXCL12, Texas Red-conjugated dextran (25 μg ml−1, MW =10 kDa) was added into the source channel and allowed to equilibrate for 30 min before fluorescent images in the center cell culture chamber were taken. Fluorescent intensities of Texas Red-conjugated dextran were then measured and averaged across the cell culture chamber using Axionvision 4.8 (Carl Zeiss LLC).
5.4. Cell track analysis
To correct minor stage shifting during image acquisition, the Align-Slice plugin in NIH ImageJ software was used to manually align slices within an image stack using alignment markers within the microfluidic device. Each individual cell was then tracked with the MtrackJ plugin to yield a sequence of (x,y) position coordinates over time (Figure 2A). The starting coordinate of each cell track was defined as the origin (0,0) to create plots of multiple cell tracks and angular histograms of cell endpoint positions. Cells that had migrated less than 15μm or 60 μm from their starting positions (E, Euclidian distance, Figure 2B) in the 4-hr or 17-hr experiments, respectively, were considered stationary and were excluded from further analysis. The center of mass of the cell endpoint positions was calculated according to Equation 1 and marked with a star in the cell tracks plot.
| (1) |
Statistically significant asymmetry in the angular histogram of cell endpoint positions was determined using a Rayleigh test with p-value < 0.05. The chemotactic index and migration speed for each cell track were calculated using the Chemotaxis Tool plugin (Ibids, Germany). Chemotactic index was calculated as the projected distance traveled along the x-axis (X) divided by the accumulated distance traveled by the cell (D) (Equation 2).
| (2) |
Cell speed (μm min−1) was calculated as the accumulated migration distance (D) divided by time (t) (Equation 3).
| (3) |
5.5. Flow cytometry and qPCR analysis
NSCs received either no treatment or pretreatment with BDNF for 1 or 24 hrs as labeled in Figure 6. Following this, cells were resuspended in cell staining buffer, treated with Fc block (BioLegend, San Diego, CA), labeled with monoclonal antibodies rabbit anti-CXCR4 conjugated to fluorochrome PE, rabbit anti-CXCR7 conjugated to fluorochrome APC, and their isotype controls (BioLegend) for 30 min on ice, and then subjected to flow cytometry analysis (SLRII, Becton Dickinson, San Jose, CA). Single cells were gated using forward and side scattering. For qPCR, RNA was extracted with Trizol (Invitrogen), and then reverse transcribed using a High Capacity cDNA Reverse Transcription kit (Applied Biosystems, Carlsbad, CA) according to the manufacturer’s instructions. qPCR with SYBR green fast detection was performed using a StepOnePlus™ Real-Time PCR system (Applied Biosystems) and the following primers, with the sequences identified from PrimerBank (http://pga.mgh.harvard.edu/primerbank), and synthesized by Integrated DNA Technologies Inc. Results were normalized to GAPDH or 18S.
CXCR4: Fw 5′-ACTACACCGAGGAAATGGGCT-3′ and Rv 5′-TTCTTCACGGAAACAGGGTTC-3′
CXCR7: Fw 5′-TCTGCATCTCTTCGACTACTCA-3′ and Rv 5′-GTAGAGCAGGACGCTTTTGTT-3′
Integrin α6: Fw 5′-ATGCACGCGGATCGAGTTTF-3′ and Rv 5′-TTCCTGCTTCGTATTAACATGCT-3′
Integrin β1: Fw 5′-CCTACTTCTGCACGATGTGATG-3′ and Rv 5′-CCTTTGCTACGGTTGGTTACATT-3′
GAPDH: Fw 5′-AAGGTGAAGGTCGGAGTCAAC-3′ and Rv 5′-GGGGTCATTGATGGCAACAATA-3′
18S: Fw 5′-GTAACCCGTTGAACCCCATT-3′ and Rv 5′-CCATCCAATCGGTAGTAGCG-3′
5.6. Statistical analysis
Asymmetry of cell endpoint angular histograms was analyzed with the Rayleigh test as described above. Non-paired, non-parametric analysis of variance (ANOVA) was used to evaluate the statistical significance of chemotactic index and speed data (p < 0.05, n ≥ 3 individual devices). Chemotactic indices are shown as boxplots with boxes signifying 25%, 50%, and 75% (GraphPad Prism, GraphPad Inc, La Jolla, CA). Speed was reported as a boxplot (as above) or dot plot with median highlighted. For qPCR data, mean and standard deviation are reported, and statistical significance was determined with the student t test (p <0.05, n ≥ 3).
Acknowledgments
Work was supported by NIH 1T32-HL098049-01A1 to the Stanford Cardivascular Institute (H.X.), NIH R21-AR062359-01 and 1DP2-OD006477-01 (S.C.H.). The authors acknowledge Dr. Raphael Guzman, Nancy Wang, and Tenille Smith at University of Bern, Switzerland and Stanford Medical School for providing cells and for helpful discussion. We’d like to thank Ruby Dewi for her technical support.
References
- 1.Ford GA, Bryant CA, Mangoni AA, Jackson SH. Br J Clin Pharmacol. 2004;57(1):15–26. doi: 10.1046/j.1365-2125.2003.01939.x. [DOI] [PMC free article] [PubMed] [Google Scholar]
- 2.a) Rother J. Stroke. 2008;39:523–524. doi: 10.1161/STROKEAHA.107.494799. [DOI] [PubMed] [Google Scholar]; b) Philip M, Benatar M, Fisher M, Savitz SI. Stroke. 2009;40(2):577–81. doi: 10.1161/STROKEAHA.108.524330. [DOI] [PubMed] [Google Scholar]
- 3.a) Martino G, Pluchino S. Nat Rev Neurosci. 2006;7(5):395–406. doi: 10.1038/nrn1908. [DOI] [PubMed] [Google Scholar]; b) Imitola J, Raddassi K, Park KI, Mueller FJ, Nieto M, Teng YD, Frenkel D, Li J, Sidman RL, Walsh CA, Snyder EY, Khoury SJ. Proceedings of the National Academy of Sciences of the United States of America. 2004;101(52):18117–22. doi: 10.1073/pnas.0408258102. [DOI] [PMC free article] [PubMed] [Google Scholar]
- 4.a) Gage FH. Science. 2000;287(5457):1433–1438. doi: 10.1126/science.287.5457.1433. [DOI] [PubMed] [Google Scholar]; b) Temple S. Nature. 2001;414(6859):112–117. doi: 10.1038/35102174. [DOI] [PubMed] [Google Scholar]
- 5.Tabata H, Nakajima K. J Neurosci. 2003;23(31):9996–10001. doi: 10.1523/JNEUROSCI.23-31-09996.2003. [DOI] [PMC free article] [PubMed] [Google Scholar]
- 6.Andres RH, Choi R, Pendharkar AV, Gaeta X, Wang N, Nathan JK, Chua JY, Lee SW, Palmer TD, Steinberg GK, Guzman R. Stroke. 2011;42(10):2923–31. doi: 10.1161/STROKEAHA.110.606368. [DOI] [PMC free article] [PubMed] [Google Scholar]
- 7.Puche AC, Bovetti S. Methods Mol Biol. 2011;750:227–40. doi: 10.1007/978-1-61779-145-1_16. [DOI] [PubMed] [Google Scholar]
- 8.Durbec P, Franceschini I, Lazarini F, Dubois-Dalcq M. Methods Mol Biol. 2008;438:213–25. doi: 10.1007/978-1-59745-133-8_18. [DOI] [PubMed] [Google Scholar]
- 9.a) Flanagan LA, Rebaza LM, Derzic S, Schwartz PH, Monuki ES. J Neurosci Res. 2006;83(5):845–56. doi: 10.1002/jnr.20778. [DOI] [PMC free article] [PubMed] [Google Scholar]; b) Mizuno N, Kokubu H, Sato M, Nishimura A, Yamauchi J, Kurose H, Itoh H. Proc Natl Acad Sci U S A. 2005;102(35):12365–70. doi: 10.1073/pnas.0506101102. [DOI] [PMC free article] [PubMed] [Google Scholar]
- 10.Odedra D, Chiu LLY, Shoichet M, Radisic M. Acta Biomaterialia. 2011;7(8):3027–3035. doi: 10.1016/j.actbio.2011.05.002. [DOI] [PubMed] [Google Scholar]
- 11.Keenan TM, Frevert CW, Wu A, Wong V, Folch A. Lab Chip. 2010;10(1):116–22. doi: 10.1039/b913494h. [DOI] [PMC free article] [PubMed] [Google Scholar]
- 12.Adler J. Science. 1966;153(3737):708–16. doi: 10.1126/science.153.3737.708. [DOI] [PubMed] [Google Scholar]
- 13.Boyden S. J Exp Med. 1962;115:453–66. doi: 10.1084/jem.115.3.453. [DOI] [PMC free article] [PubMed] [Google Scholar]
- 14.Zigmond SH. Methods Enzymol. 1988;162:65–72. doi: 10.1016/0076-6879(88)62064-7. [DOI] [PubMed] [Google Scholar]
- 15.Zicha D, Dunn G, Jones G. Methods Mol Biol. 1997;75:449–57. doi: 10.1385/0-89603-441-0:449. [DOI] [PubMed] [Google Scholar]
- 16.a) Hartmann TN, Grabovsky V, Pasvolsky R, Shulman Z, Buss EC, Spiegel A, Nagler A, Lapidot T, Thelen M, Alon R. J Leukoc Biol. 2008;84(4):1130–40. doi: 10.1189/jlb.0208088. [DOI] [PubMed] [Google Scholar]; b) Kokovay E, Goderie S, Wang Y, Lotz S, Lin G, Sun Y, Roysam B, Shen Q, Temple S. Cell Stem Cell. 2010;7(2):163–73. doi: 10.1016/j.stem.2010.05.019. [DOI] [PMC free article] [PubMed] [Google Scholar]
- 17.a) Keenan TM, Hsu CH, Folch A. Applied Physics Letters. 2006;89(11):114103. [Google Scholar]; b) Bhattacharjee N, Li N, Keenan TM, Folch A. Integrative Biology. 2010;2(11–12):669–679. doi: 10.1039/c0ib00038h. [DOI] [PMC free article] [PubMed] [Google Scholar]
- 18.Chung BG, Lin F, Jeon NL. Lab on a Chip. 2006;6(6):764–768. doi: 10.1039/b512667c. [DOI] [PubMed] [Google Scholar]
- 19.a) Dertinger SKW, Chiu DT, Jeon NL, Whitesides GM. Analytical Chemistry. 2001;73(6):1240–1246. [Google Scholar]; b) Chung BG, Flanagan LA, Rhee SW, Schwartz PH, Lee AP, Monuki ES, Jeon NL. Lab Chip. 2005;5(4):401–6. doi: 10.1039/b417651k. [DOI] [PubMed] [Google Scholar]; c) Jeon NL, Dertinger SKW, Chiu DT, Choi IS, Stroock AD, Whitesides GM. Langmuir. 2000;16(22):8311–8316. [Google Scholar]; d) Joanne Wang C, Li X, Lin B, Shim S, Ming G-l, Levchenko A. Lab on a Chip. 2008;8(2):227–237. doi: 10.1039/b713945d. [DOI] [PubMed] [Google Scholar]
- 20.a) Urbich C, Dernbach E, Reissner A, Vasa M, Zeiher AM, Dimmeler S. Arterioscler Thromb Vasc Biol. 2002;22(1):69–75. doi: 10.1161/hq0102.101518. [DOI] [PubMed] [Google Scholar]; b) Wojciak-Stothard B, Ridley AJ. J Cell Biol. 2003;161(2):429–39. doi: 10.1083/jcb.200210135. [DOI] [PMC free article] [PubMed] [Google Scholar]; c) Walker GM, Sai J, Richmond A, Stremler M, Chung CY, Wikswo JP. Lab on a Chip. 2005;5(6):611–618. doi: 10.1039/b417245k. [DOI] [PMC free article] [PubMed] [Google Scholar]
- 21.a) Shamloo A, Ma N, Poo MM, Sohn LL, Heilshorn SC. Lab Chip. 2008;8(8):1292–9. doi: 10.1039/b719788h. [DOI] [PubMed] [Google Scholar]; b) Kuhnert F, Mancuso MR, Shamloo A, Wang HT, Choksi V, Florek M, Su H, Fruttiger M, Young WL, Heilshorn SC, Kuo CJ. Science. 2010;330(6006):985–9. doi: 10.1126/science.1196554. [DOI] [PMC free article] [PubMed] [Google Scholar]; c) Shamloo A, Xu H, Heilshorn S. Tissue Eng Part A. 2012;18(3–4):320–30. doi: 10.1089/ten.tea.2011.0323. [DOI] [PMC free article] [PubMed] [Google Scholar]
- 22.a) Saadi W, Rhee S, Lin F, Vahidi B, Chung B, Jeon N. Biomedical Microdevices. 2007;9(5):627–635. doi: 10.1007/s10544-007-9051-9. [DOI] [PubMed] [Google Scholar]; b) Breckenridge MT, Egelhoff TT, Baskaran H. Biomed Microdevices. 2010;12(3):543–53. doi: 10.1007/s10544-010-9411-8. [DOI] [PMC free article] [PubMed] [Google Scholar]; c) Irimia D, Charras G, Agrawal N, Mitchison T, Toner M. Lab on a Chip. 2007;7(12):1783–1790. doi: 10.1039/b710524j. [DOI] [PMC free article] [PubMed] [Google Scholar]; d) Paliwal S, Iglesias PA, Campbell K, Hilioti Z, Groisman A, Levchenko A. Nature. 2007;446(7131):46–51. doi: 10.1038/nature05561. [DOI] [PubMed] [Google Scholar]
- 23.a) Haddox JL, Knowles IW, Sommers CI, Pfister RR. Journal of Immunological Methods. 1994;171(1):1–14. doi: 10.1016/0022-1759(94)90222-4. [DOI] [PubMed] [Google Scholar]; b) Cao X, Shoichet MS. Neuroscience. 2001;103(3):831–840. doi: 10.1016/s0306-4522(01)00029-x. [DOI] [PubMed] [Google Scholar]; c) Wong AP, Perez-Castillejos R, Christopher Love J, Whitesides GM. Biomaterials. 2008;29(12):1853–61. doi: 10.1016/j.biomaterials.2007.12.044. [DOI] [PMC free article] [PubMed] [Google Scholar]; d) Cheng SY, Heilman S, Wasserman M, Archer S, Shuler ML, Wu M. Lab on a Chip. 2007;7(6):763–769. doi: 10.1039/b618463d. [DOI] [PubMed] [Google Scholar]; e) Wu H, Huang B, Zare RN. Journal of the American Chemical Society. 2006;128(13):4194–4195. doi: 10.1021/ja058530o. [DOI] [PubMed] [Google Scholar]
- 24.a) Abhyankar VV, Lokuta MA, Huttenlocher A, Beebe DJ. Lab on a Chip. 2006;6(3):389–393. doi: 10.1039/b514133h. [DOI] [PubMed] [Google Scholar]; b) Diao J, Young L, Kim S, Fogarty EA, Heilman SM, Zhou P, Shuler ML, Wu M, DeLisa MP. Lab on a Chip. 2006;6(3):381–388. doi: 10.1039/b511958h. [DOI] [PubMed] [Google Scholar]
- 25.Millet LJ, Stewart ME, Nuzzo RG, Gillette MU. Lab Chip. 2010;10(12):1525–35. doi: 10.1039/c001552k. [DOI] [PMC free article] [PubMed] [Google Scholar]
- 26.Li M, Chang CJ, Lathia JD, Wang L, Pacenta HL, Cotleur A, Ransohoff RM. Glia. 2011;59(1):108–18. doi: 10.1002/glia.21080. [DOI] [PubMed] [Google Scholar]
- 27.Wang Y, Li G, Stanco A, Long JE, Crawford D, Potter GB, Pleasure SJ, Behrens T, Rubenstein JL. Neuron. 2011;69(1):61–76. doi: 10.1016/j.neuron.2010.12.005. [DOI] [PMC free article] [PubMed] [Google Scholar]
- 28.a) Peng H, Huang Y, Rose J, Erichsen D, Herek S, Fujii N, Tamamura H, Zheng J. J Neurosci Res. 2004;76(1):35–50. doi: 10.1002/jnr.20045. [DOI] [PubMed] [Google Scholar]; b) Ni HT, Hu S, Sheng WS, Olson JM, Cheeran MC, Chan AS, Lokensgard JR, Peterson PK. Brain Res Dev Brain Res. 2004;152(2):159–69. doi: 10.1016/j.devbrainres.2004.06.015. [DOI] [PubMed] [Google Scholar]; c) Liu J, Wei Y, Chen Y, Xu X, Zhang H. J Neurosci Res. 2011;89(8):1173–84. doi: 10.1002/jnr.22623. [DOI] [PubMed] [Google Scholar]
- 29.Barkho BZ, Munoz AE, Li X, Li L, Cunningham LA, Zhao X. Stem Cells. 2008;26(12):3139–49. doi: 10.1634/stemcells.2008-0519. [DOI] [PMC free article] [PubMed] [Google Scholar]
- 30.Rosenblum S, Smith T, Wang N, Chua J, Westbroek E, Wang K, Guzman R. 2012 Submitted. [Google Scholar]
- 31.Rosenkilde MM, Gerlach LO, Jakobsen JS, Skerlj RT, Bridger GJ, Schwartz TW. J Biol Chem. 2004;279(4):3033–41. doi: 10.1074/jbc.M309546200. [DOI] [PubMed] [Google Scholar]
- 32.Zhang H, Vutskits L, Pepper MS, Kiss JZ. J Cell Biol. 2003;163(6):1375–84. doi: 10.1083/jcb.200308040. [DOI] [PMC free article] [PubMed] [Google Scholar]
- 33.a) Gordon RJ, McGregor AL, Connor B. Mol Cell Neurosci. 2009;41(2):219–32. doi: 10.1016/j.mcn.2009.03.001. [DOI] [PubMed] [Google Scholar]; b) Tran PB, Banisadr G, Ren D, Chenn A, Miller RJ. J Comp Neurol. 2007;500(6):1007–1034. doi: 10.1002/cne.21229. [DOI] [PMC free article] [PubMed] [Google Scholar]
- 34.Hartman NW, Carpentino JE, LaMonica K, Mor DE, Naegele JR, Grabel L. PLoS One. 2010;5(12):e15856. doi: 10.1371/journal.pone.0015856. [DOI] [PMC free article] [PubMed] [Google Scholar]
- 35.Barkho BZ, Song H, Aimone JB, Smrt RD, Kuwabara T, Nakashima K, Gage FH, Zhao X. Stem Cells Dev. 2006;15(3):407–21. doi: 10.1089/scd.2006.15.407. [DOI] [PMC free article] [PubMed] [Google Scholar]
- 36.Bleul CC, Fuhlbrigge RC, Casasnovas JM, Aiuti A, Springer TA. J Exp Med. 1996;184(3):1101–9. doi: 10.1084/jem.184.3.1101. [DOI] [PMC free article] [PubMed] [Google Scholar]
- 37.Welford AF, Biziato D, Coffelt SB, Nucera S, Fisher M, Pucci F, Di Serio C, Naldini L, De Palma M, Tozer GM, Lewis CE. J Clin Invest. 2011;121(5):1969–73. doi: 10.1172/JCI44562. [DOI] [PMC free article] [PubMed] [Google Scholar]
- 38.Aiuti A, Webb IJ, Bleul C, Springer T, Gutierrez-Ramos JC. The Journal of Experimental Medicine. 1997;185(1):111–120. doi: 10.1084/jem.185.1.111. [DOI] [PMC free article] [PubMed] [Google Scholar]
- 39.Zheng H, Fu G, Dai T, Huang H. J Cardiovasc Pharmacol. 2007;50(3):274–80. doi: 10.1097/FJC.0b013e318093ec8f. [DOI] [PubMed] [Google Scholar]
- 40.Geminder H, Sagi-Assif O, Goldberg L, Meshel T, Rechavi G, Witz IP, Ben-Baruch A. J Immunol. 2001;167(8):4747–57. doi: 10.4049/jimmunol.167.8.4747. [DOI] [PubMed] [Google Scholar]
- 41.Mosadegh B, Saadi W, Wang SJ, Jeon NL. Biotechnol Bioeng. 2008;100(6):1205–13. doi: 10.1002/bit.21851. [DOI] [PubMed] [Google Scholar]
- 42.Belmadani A, Tran PB, Ren D, Assimacopoulos S, Grove EA, Miller RJ. J Neurosci. 2005;25(16):3995–4003. doi: 10.1523/JNEUROSCI.4631-04.2005. [DOI] [PMC free article] [PubMed] [Google Scholar]
- 43.Shirozu M, Nakano T, Inazawa J, Tashiro K, Tada H, Shinohara T, Honjo T. Genomics. 1995;28(3):495–500. doi: 10.1006/geno.1995.1180. [DOI] [PubMed] [Google Scholar]
- 44.Ohmiya M, Shudai T, Nitta A, Nomoto H, Furukawa Y, Furukawa S. Neurosci Lett. 2002;317(1):21–4. doi: 10.1016/s0304-3940(01)02412-0. [DOI] [PubMed] [Google Scholar]
- 45.Rubio FJ, Kokaia Z, del Arco A, Garcia-Simon MI, Snyder EY, Lindvall O, Satrustegui J, Martinez-Serrano A. Gene Ther. 1999;6(11):1851–66. doi: 10.1038/sj.gt.3301028. [DOI] [PubMed] [Google Scholar]
- 46.a) Pappas IS, Parnavelas JG. Exp Neurol. 1997;144(2):302–14. doi: 10.1006/exnr.1997.6411. [DOI] [PubMed] [Google Scholar]; b) Lewin GR, Barde YA. Annu Rev Neurosci. 1996;19:289–317. doi: 10.1146/annurev.ne.19.030196.001445. [DOI] [PubMed] [Google Scholar]; c) Bachis A, Major EO, Mocchetti I. J Neurosci. 2003;23(13):5715–22. doi: 10.1523/JNEUROSCI.23-13-05715.2003. [DOI] [PMC free article] [PubMed] [Google Scholar]
- 47.Ahmed F, Tessarollo L, Thiele C, Mocchetti I. Brain Res. 2008;1227:1–11. doi: 10.1016/j.brainres.2008.05.086. [DOI] [PMC free article] [PubMed] [Google Scholar]
- 48.Naumann U, Cameroni E, Pruenster M, Mahabaleshwar H, Raz E, Zerwes HG, Rot A, Thelen M. PLoS One. 2010;5(2):e9175. doi: 10.1371/journal.pone.0009175. [DOI] [PMC free article] [PubMed] [Google Scholar]
- 49.Kearns SM, Laywell ED, Kukekov VK, Steindler DA. Exp Neurol. 2003;182(1):240–4. doi: 10.1016/s0014-4886(03)00124-9. [DOI] [PubMed] [Google Scholar]
- 50.Crump MP, Gong JH, Loetscher P, Rajarathnam K, Amara A, Arenzana-Seisdedos F, Virelizier JL, Baggiolini M, Sykes BD, Clark-Lewis I. EMBO J. 1997;16(23):6996–7007. doi: 10.1093/emboj/16.23.6996. [DOI] [PMC free article] [PubMed] [Google Scholar]
- 51.Roccio M, Gobaa S, Lutolf MP. Integrative Biology. 2012;4(4):391–400. doi: 10.1039/c2ib00070a. [DOI] [PubMed] [Google Scholar]
- 52.Parekkadan B, Sethu P, van Poll D, Yarmush ML, Toner M. Tissue Eng. 2007;13(10):2465–73. doi: 10.1089/ten.2007.0054. [DOI] [PubMed] [Google Scholar]