Abstract
Parkinson's disease (PD) is a common neurodegenerative disorder characterized by progressive degeneration of dopaminergic neurons in the substantia nigra pars compacta. Most cases are sporadic and its etiology is incompletely understood. However, increasing evidence suggests that oxidative stress and mitochondrial dysfunction may be involved in the pathogenesis of Parkinson's disease. The aim of this study was to investigate changes in mitochondrial protein profiles during dopaminergic neuronal cell death using two-dimensional gel electrophoresis in conjunction with mass spectrometry. Several protein spots were found to be significantly altered following treatment of MN9D dopaminergic neuronal cells with 6-hydroxydopamine (6-OHDA). Among several identified candidates, TNF receptor-associated protein 1 (TRAP1), a mitochondrial molecular chaperone, was released from the mitochondria into the cytosol in MN9D cells as well as primary cultures of dopaminergic neurons following 6-OHDA treatment. This event was drug-specific in that such apoptotic inducers as staurosporine and etoposide did not cause translocation of TRAP1 into the cytosol. To our knowledge, the present study is the first to demonstrate the drug-induced subcellular translocation of TRAP1 during neurodegeneration. Further studies delineating cellular mechanism associated with this phenomenon and its functional consequence may provide better understanding of dopaminergic neurodegeneration that underlies PD pathogenesis.
Keywords: 6-hydroxydopamine, Parkinson's disease, proteomics, mitochondria, TRAP1
INTRODUCTION
Mitochondrial dysfunction has long been implicated in the pathogenesis of PD. Several previous studies point to the central role of mitochondria in PD: reduced complex I activity [1, 2, 3, 4, 5], reduced mitochondrial membrane potential (ΔΨm) along with increased production of reactive oxygen species (ROS) [6, 7], alterations in mitochondrial fission-fusion events [8, 9], and defects in mitochondrial trafficking [10, 11]. These studies also indicate that many of the PD-related proteins are either located at the mitochondria and/or closely associated with mitochondrial functions [12, 13, 14, 15, 16]. Dysregulated accumulation of the misfolded proteins is another feature typically accompanied in patients with PD and experimental models of PD [17]. It has been shown that disturbance or imbalance of such systems as the ubiquitin proteasomal system (UPS) and the heat shock proteins (HSP) are critically involved in the progression of the disease [18, 19]. Transcriptional analysis of multiple brain regions in PD also indicates the dysfunction of UPS, along with a robust induction of several forms of HSPs is one of the central events during neurodegeneration [20]. In consideration of pathological features of PD including formation of Lewy bodies and Lewy neurites, it is quite obvious that aberrant accumulation of the misfolded proteins is a common event in chronic neurodegenerative disorders including PD. Certainly, this phenomenon indicates that abnormality of protein homeostasis is substantially contributing to the pathogenesis of the disease [18].
Currently, proteomic approaches have been utilized to identify multiple target proteins that potentially associated with disease progression [21, 22, 23, 24]. Both fluid and solid tissue samples obtained from experimental models of PD or from patients with PD have been subjected to proteomic analysis [25, 26, 27, 28]. So far, quantitative proteomic analyses have been conducted using well-characterized models of PD that are established following treatment with MPTP [29, 30], 6-OHDA [31, 32, 33, 34], L-dopa [35], dopamine quinone [27] or lipopolysaccharide [36]. In this study, we specifically attempted to analyze changes in the mitochondrial protein profiles in the MN9D dopaminergic cell line following 6-OHDA treatment. By utilizing the fractionated mitochondrial samples, we attempted to identify the altered mitochondrial proteins via 2-dimensional electrophoresis (2-DE) in conjunction with mass spectrometry. As a result, we initially identified 73 altered proteins in the mitochondria of MN9D cells treated with 6-OHDA. Among these identified potential candidates, we found that TRAP1 is released from the mitochondria into the cytosol. This phenomenon was paralleled with a drug-induced neurodegeneration in MN9D cells as well as primary cultures of dopaminergic neurons. At present, its functional implication is not understood. Further study to delineate the molecular and cellular mechanism underlying the subcellular translocation of TRAP1 may provide a new insight of critical role for the chaperone proteins in the regulation of neurodegeneration.
MATERIALS AND METHODS
Cell culture and Drug Treatment
MN9D dopaminergic neuronal cell line was established by somatic fusion between embryonic mesencephalic neurons and N18TG cells. MN9D cells were plated at a density of 1×10⁶ on 25 µg/ml poly-D-lysine (Sigma, St. Louis, MO, USA)-coated P-100 culture plate and cultivated in Dulbecco's Modified Eagle's Medium (DMEM; Sigma) supplemented with 10% heat-inactivated fetal bovine serum (FBS; Gibco, Grand Island, NY, USA) in an atmosphere of 10% CO2 for 2~3 days. The medium was subsequently replaced with N2 serum-free defined medium containing 100 µM 6-OHDA, 1 µM staurosporine (STS) or 100 µM etoposide (all from Sigma) for the time periods indicated. If necessary, 1 mM N-acetyl-L-cysteine was also added to the medium. To prepare primary cultures of dopaminergic neurons, the ventral mesencephalon were removed from Sprague Dawley rat embryos at gestation day 14.5 (Orient, Suwon, Korea). Tissues were incubated with 0.01% trypsin in HBSS for 10 min at 37℃ and triturated with a constricted Pasteur pipette. Dissociated cells were plated at 1.0×10⁵ cells onto poly-D-lysine and laminin (Invitrogen, San Diego, CA)-double coated Aclar embedding film with a size of 8 mm in diameter (Electron Microscopy Sciences, Fort Washington, PA). Cultures were maintained at 37℃ in a humidified 5% CO2 atmosphere in MEM supplemented with 10% FBS, 2 mM glutamine and 6.0 mg/L glucose. At 5 or 6 DIV, cells were washed with MEM and treated with 20 µM 6-OHDA.
Cellular Fractionation
Following drug treatment, MN9D cells were fractionated into the cytosolic and the mitochondrial fractions using a sucrose density gradient method. Briefly, freshly collected cellular lysates were homogenized with a loose pestle homogenizer (Wheaton, USA) at 4℃ in a buffer containing 10 mM Tris-HCl, pH 7.4, 10% sucrose and complete protease inhibitor cocktail (Roche, Mannheim, Germany). The homogenate was centrifuge at 600×g for 15 min at 4℃, and the pellet was discarded. The supernatant containing the mitochondria was subjected to centrifugation at 15,000×g for 20 min at 4℃. For the cytosolic fraction, the resulting supernatant was further centrifuged at 100,000×g for 1 hr at 4℃. For the mitochondrial fraction, pellet was loaded onto 10~50% sucrose gradient in 10 mM Tris-HCl pH7.4 containing complete protease inhibitor cocktail. Samples were then subjected to an additional centrifugation at 100,000×g for 2 hr at 4℃. The brownish band between 40 and 50% sucrose gradient layer was collected using a constricted pipette tip and again subjected to a centrifugation at 100,000×g for 1 hr at 4℃. The resulting pellet was lysed in a RIPA buffer containing 50 mM Tris-HCl pH 7.4, 1% NP-40, 0.25% Na-deoxycholate, 150 mM NaCl, 1 mM EDTA, 0.1% SDS, and complete protease inhibitor cocktail. This was used as the mitochondrial fraction.
2-DE
All procedures for 2-DE was carried out basically based on our previous report [32]. Following treatment with 100 µM 6-OHDA for various times indicated, MN9D cells were fractionated as described above. Each fractions were solubilized in a sample buffer containing 7 M urea, 2 M thiourea, 4.5% CHAPS, 40 mM Tris-HCl, 100 mM DTE, 0.002% BPB, complete protease inhibitor cocktail and 1% IPG buffer for pH 3~10 non-linear Immobiline DryStrip (Amersham Biosciences). Protein content was determined by Bradford protein assay reagent (Bio-Rad, Hercules, CA, USA) Prior to isoelectric focusing, Immobiline DryStrips (24 cm or 7 cm) were rehydrated in a sample buffer containing 500 to 1,500 µg of the fractionated cellular lysates. Gels were run for a total of 96 kVh for 24 cm DryStrip or 8.7 kVh for 7 cm DryStrip using progressively increasing voltage on an Ettan IPGphor (Amersham Biosciences). After equilibration, SDS-PAGE was performed on a 10~15% gradient gel in an Ettan Dalt II System for 24 cm DryStrip, or on a 8% gel in a Mini-Protean 3 Electrophoresis Cell (Bio-Rad) for 7cm DryStrip. Gels stained with 0.1% Coomassie Brilliant Blue G-250 were scanned using a densitometer (Powerlook 2100XL, UMAX, USA) and the images were analyzed using the ProteomWeaver software system (Bio-Rad). For in-gel digestion, protein spots of interest were manually excised from the Coomassie-stained gels. Gel slices were washed with a buffer containing 25 mM NH4HCO3/50% acetonitrile, dried completely using a Speedvac evaporator dryer (BioTron, Korea) and digested with 10 µg/ml trypsin (Promega) in 25 mM NH4HCO3 at 37℃ for 18 hr. Peptides were solubilized with 0.1% trifluoracetic acid (TFA), and desalted using an in-house column packed with C18 porous beads. Bound peptides were eluted in 0.6 µl elution buffer containing 1 mg/ml-cyano-4-hydroxycinnamic acid solution in 60% acetonitrile/0.1% TFA and spotted onto a MALDI plate (Applied Biosystems). Peptide mixtures were analyzed by a 4700 Proteomics Analyzer (Applied Biosystems) and peptide masses were matched with the theoretical peptide masses of all proteins from all species using the NCBI or SWISS-PROT database.
Immunoblot analysis
Following drug treatment, MN9D cells were lysed on ice in a RIPA buffer containing 50 mM Tris-HCl pH 7.4, 1% NP-40, 0.25% Na-deoxycholate, 150 mM NaCl, 1 mM EDTA, 0.1% SDS, and complete protease inhibitor cocktail. Cells were then homogenized using a 1-ml syringe attached with a 26-gauge needle. Cellular lysates were centrifuged at 14,500×g for 10 min at 4℃. The supernatants were collected and quantified using a Bradford protein assay reagent. Following drug treatment, MN9D cells were lysed on ice for 30 min in PBS containing 1% Triton X-100 and complete protease inhibitor cocktail. After centrifugation at 15,000×g for 30 min at 4℃, 1% Triton X-100-soluble fractions were collected. The pellets were washed 4 times with PBS containing 1% Triton X-100 and further solubilized in PBS buffer containing 1% SDS, 1% Triton X-100, and complete protease inhibitor for 1 hr at 60℃. Subsequently, Triton X-100-insoluble fractions were collected by centrifugation at 15,000×g for 30 min at 4℃. For immunoblot analysis, fifty micrograms of protein from each sample were separated on 7 or 8% SDS-PAGE gels and blotted onto PVDF membranes (Pall Corp., Ann Arbor, MI, USA). Membranes were probed with one of the following primary antibodies: mouse anti-BCKDHA, mouse anti-HCCS, mouse anti-WWP1, mouse anti-NDUFS2, mouse anti-PMPCB, mouse anti-PGAM1; Novus; 1:1000), rabbit anti-ACO2, rabbit anti-VDAC2, rabbit anti-STOML2 (Proteintech; 1:1000), rabbit anti-Cpn10 (Stressgen; 1:1000), rabbit anti-Erp57, goat anti-SOD-1, rabbit anti-α-tububin, rabbit anti-Tom20 (Santa Cruz; 1:1000), mouse anti-Grp75, mouse anti-PTGES, goat anti-DJ-1(Abcam; 1:1000), mouse anti-cytochrome c, mouse anti-TRAP1 (BD Biosciences; 1:2000), mouse anti-COXIV (Molecular Probes; 1:1000), rabbit anti-cleaved caspase-3 (Cell Signaling; 1:1000), and mouse anti-GAPDH (Chemicon; 1:3000). After washing with TBS containing 0.1% Tween-20, cells were incubated with goat anti-rabbit HRP-conjugated antibody (Santa Cruz; 1:3000), goat anti-mouse HRP-conjugated antibody (Santa Cruz; 1:3000), or donkey anti-goat HRP-conjugated antibody (Santa Cruz; 1:20000). Specific bands were detected using enhanced chemiluminescence (ECL; Amersham Pharmacia Biotech, Piscataway, NJ, USA).
Immunocytochemistry
For a double immunocytochemical labeling, cells were fixed with 4% paraformaldehyde (EMS, Hatfield, PA, USA) at RT for 10 min at various time periods after drug treatment. For the images of TRAP1 and cytochrome c, cells were permeabilized with 0.3% saponin (Sigma) at RT for 10 min followed by blocking in 0.2% cold water fish gelatin/0.5% BSA in PBS (PBG) at RT for 30 min. After permeabilization and blocking steps, cells were incubated with a mouse anti-TRAP1 antibody, mouse anti-cytochrome C antibody (BD Biosciences; 1:200) or rabbit anti-Tom20 (Santa Cruz; 1:200) in 0.2% PBG overnight at 4℃. After extensive washing, cells were incubated with Alexa488-conjugated goat anti-rabbit IgG (Invitrogen; 1:200) and Alexa568-conjugated goat anti-mouse IgG (Invitrogen; 1:200) at RT for 1 hr. Hoechst 33258 staining (Molecular Probes; 1 µg/ml, Eugene, OR, USA) was performed for 10 min at RT. Slides were mounted with Vectashield mounting medium (Vector Laboratories, Burlingame, CA, USA). Samples were observed under an LSM 510 META confocal laser scanning microscope equipped with epifluorescence and a digital image analyzer (Carl Zeiss, Zena, Germany).
RESULTS AND DISCUSSION
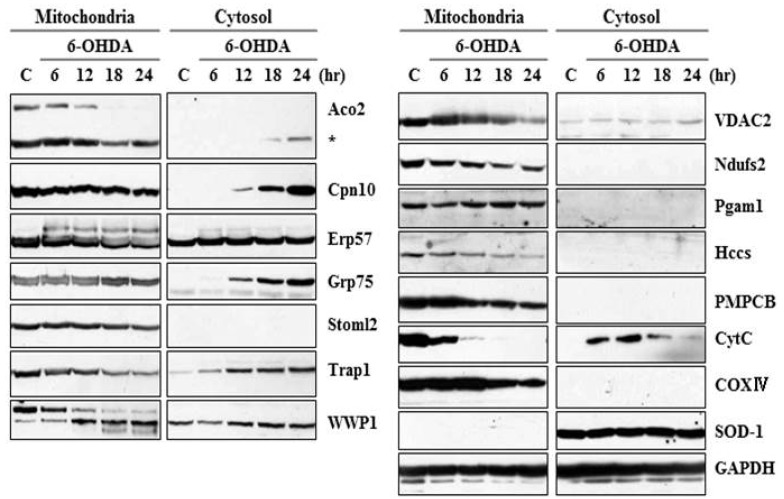
Our laboratory previously reported that 6-OHDA induces prototypic apoptosis, including cytochrome c release and caspase activation in MN9D cells as well as primary cultures of dopaminergic neurons. Our laboratory has also proposed that ROS is one of the initial triggers leading to activation of apoptotic signaling following 6-OHDA treatment. In consideration of previous studies by others indicating that ROS affects various mitochondrial proteins in their expression, location, or modification [37, 38, 39, 40], therefore, the goal of the present study was to identify alteration in the mitochondrial proteins of MN9D dopaminergic neuronal cells following 6-OHDA treatment. For this purpose, we utilized a conventional 2-DE in conjunction with a mass spectrometry. More specifically, using fractionated mitochondrial lysates of 6-OHDA-treated MN9D cells, comparative proteome analyses between 6-OHDA-treated and untreated control samples were performed through integrated technologies including protein separation by 2-DE and identification by matrix assisted laser desorption/ionizing time of flight (MALDI-TOF) mass spectrometry. Among the altered proteins, 73 protein spots were initially subjected to in-gel digestion with trypsin, MALDI-TOF mass spectrometry and a database search using either the NCBI or SWISS-PROT database. Among these identified protein spots, expression of 20 protein spots was significantly changed with p-value of less than 0.05 (n>3). Table 1 summarizes these altered mitochondrial proteins in MN9D cells with accession number, their change in expression levels, score, molecular weight/pI, matched peptide number and sequence coverage. Proteins that increased or decreased in their intensity following Coomassie Brilliant Blue staining were listed. In addition, two protein spots that were fused were also listed in Table 1. These included 2-oxoisovalerate dehydrogenase subunit alpha (spot number #1; Bckdha) and acyl-coenzyme A thioesterase 2 (spot number #2; Acot2). Subsequently, we further confirmed the expression levels of these identified proteins in the mitochondrial and the cytosolic fraction by immunoblot analysis. As shown in Fig. 1, many of the identified proteins seemed to be released into the cytosol following 6-OHDA treatment. These included Aco2 (spot number 16 in Table 1), Cpn10 (spot number 3), Grp75 (spot number 5), and TRAP1 (spot number 15). Unlike these proteins, several of the mitochondrial proteins that were decreased in the mitochondria after 6-OHDA treatment, were not detected in the cytosol. This may suggest the existence of alternative clearance pathway in the mitochondria after drug treatment.
Table 1.
Summary of the identified mitochondrial proteins altered after 6-OHDA treatment
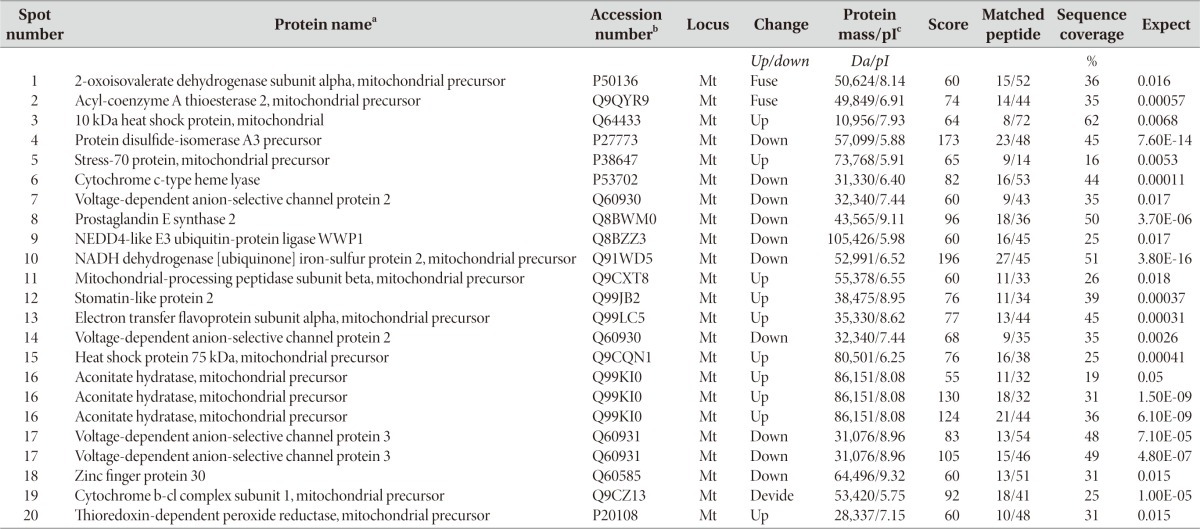
aEach protein spot in Fig. 1B was identified based on mass spectra of tryptic peptides obtained by MALDI-TOF mass spectrometry.
bAccession numbers of the identified protein spots were obtained from the Swiss-Prot data base.
cTheoretical molecular mass (Da) and pI.
Fig. 1.
Immunoblot analysis of the identified protein expression in the mitochondrial and cytosolic fractions. MN9D cells were treated with or without 100µM 6-OHDA for the indicated time periods and subjected to cellular fractionation (mitochondria and cytosol). The fractionated lysates were separated on 8~12% SDS-PAGE and subjected to immunoblot analyses using antibodies that specifically recognize corresponding proteins. Anti-cytochrome c antibody (CytC) was used as a positive control in that release of cytochrome c into the cytosol was induced during 6-OHDA-mediated apoptosis. The following antibodies were utilized as controls; COXIV (mitochondrial marker), SOD-1 (cytosolic marker), and GAPDH (loading control).
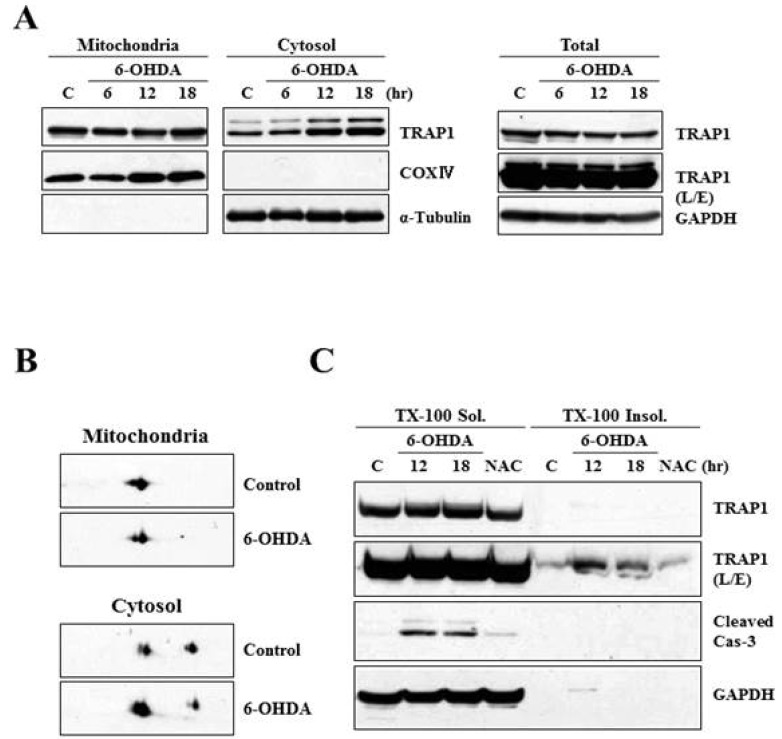
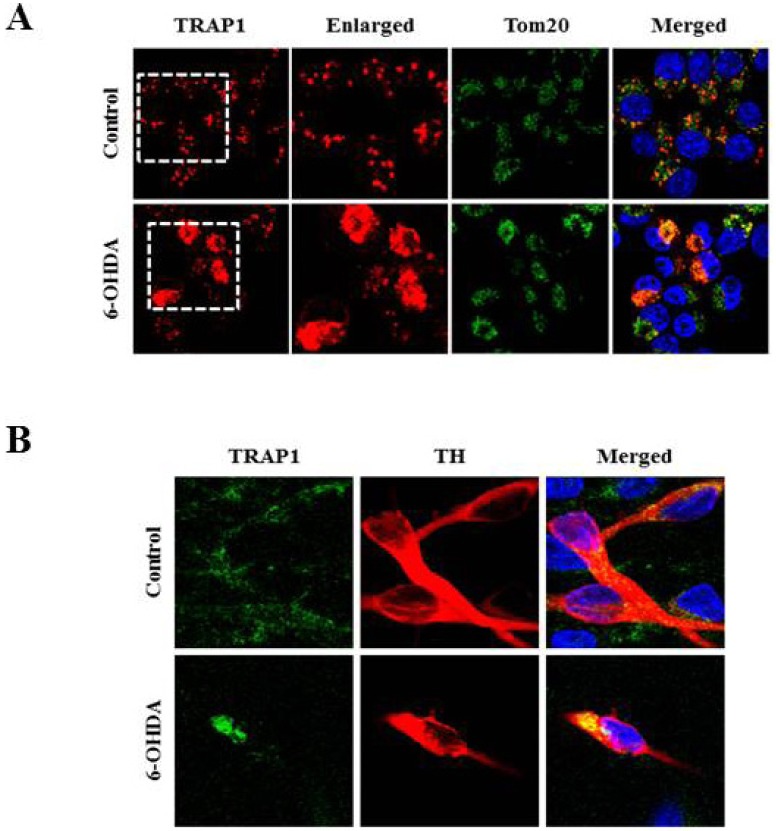
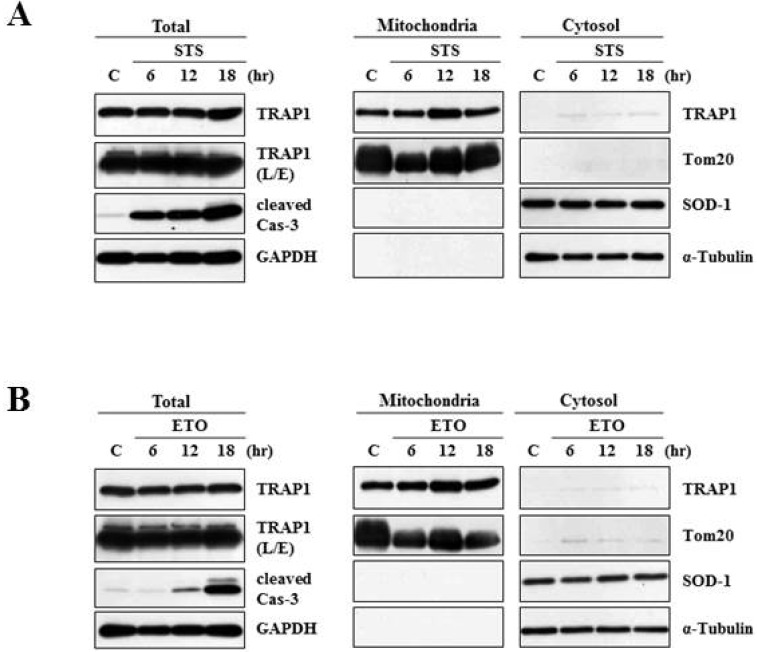
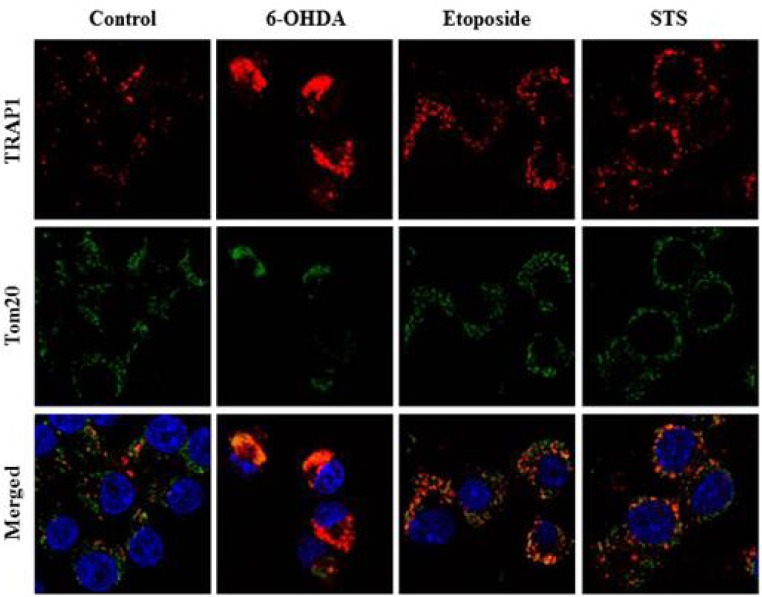
Heat shock protein 75 is a mitochondrial protein that in human is encoded by the gene called tumor necrosis factor receptor-associated protein 1 (TRAP1). TRAP1 is known to play roles as ROS antagonist and chaperone [41, 42, 43, 44, 45]. Recently, it attracts much attention due to its close connection with PD-linked protein, PINK1 [46]. Based on the protein profiling data (Fig. 1 and Table 1), we were very much interested in analyzing expression and distribution pattern of TRAP1 protein following 6-OHDA treatment. To meet this end, MN9D cells were treated with 6-OHDA for the time periods indicated, and subjected to cellular fractionation followed by an immunoblot analysis using anti-TRAP1 antibody. As shown in Fig. 2A, mitochondrial expression level of TRAP1 was slightly decreased whereas its cytosolic expression level was increased in a time-dependent manner. Increased expression pattern of TRAP1 in the cytosolic fraction was also confirmed through mini-2DE (7-cm strip; Fig. 2B), suggesting that TRAP1 may be released form the mitochondria into the cytosol upon exposure to 6-OHDA. This phenomenon was accompanied with slight decrease in total expression level of TRAP1 (right panel of Fig.2A). Because increased oxidative stress leads to protein misfolding and aggregation [47], both Triton X-100-soluble and -insoluble fraction obtained from the control and drug-treated MN9D cells were subjected to an immunoblot analysis. As expected, expression level of TRAP1 was increased in the Triton X-100-insoluble fraction following 6-OHDA treatment (Fig. 2C). Decreased expression patterns of TRAP1 in total lysates may be due to 6-OHDA-induced proteins transfer to the Triton X-100-insoluble fraction. This phenomenon was reversed in the presence of N-acetylcysteine (NAC), a widely used antioxidant. From an immunocytochemical labeling of TRAP1, we verified the punctated staining patterns of TRAP1 in the untreated control MN9D cells, indicating that TRAP1 is predominantly present in the mitochondria (Fig. 3A). This was confirmed by a double immunelabeling with anti-Tom20 (a mitochondrial marker) and anti-TRAP1. In contrast, TRAP1 showed a diffuse and dense staining pattern following 6-OHDA treatment in MN9D cells. This was quite reminiscent of those found in 6-OHDA-mediated cytochrome c release into the cytosol [48]. To further confirm whether 6-OHDA triggers cytosolic release of TRAP1 in primary cultures of mesencephalic dopaminergic neurons, a double immunofluorescent labeling was performed using anti-TRAP1 and anti-tyrosine hydroxylase (TH), a rate-limiting enzyme of dopamine biosynthesis. We also observed 6-OHDA-induced release of TRAP1 in tyrosine hydroxylase (TH)-positive dopaminergic neuron (Fig. 3B). Taken together, data indicated that TRAP1 was released from the mitochondria into the cytosol in MN9D cells as well as primary cultures of dopaminergic neurons following 6-OHDA treatment. Intriguingly, this phenomenon was not appeared in other cell death induced by staurosporine (Fig. 4A) and etoposide (Fig. 4B). As shown in Fig. 5, a double immunofluorescent labelling indicated that TRAP1 expression pattern in MN9D cells treated with either staurosporine or etoposide quite differed from that in 6-OHDA-treated cells. Taken together, our data indicated that release of TRAP1 into the cytosol is drug-specific.
Fig. 2.
Characterization of TRAP1 release in MN9D cells following 6-OHDA treatment. (A) MN9D cells were treated with or without 100 µM 6-OHDA for the indicated time periods and subjected to cellular fractionation. Total and fractionated lysates were separated on SDS-PAGE and analyzed for TRAP1 expression using anti-TRAP1 antibody. Anti-α-tubulin antibody was used as a cytosolic marker. (B) MN9D cells were treated with 100 µM 6-OHDA for 18 hr and the fractionated samples were separated on mini 2-DE (7-cm strip) and analyzed for TRAP1 expression with the specific antibody. (C) Cellular lysates obtained from MN9D cells treated with or without 100 µM 6-OHDA in the presence or the absence of 2 mM N-acetylcysteine (NAC). Cells were then subjected to separate 1% Triton X-100-soluble from Triton X-100-insoluble fractions. Blots were probed with mouse anti-TRAP1 antibody. Anti-caspase-3 antibody was used to demonstrate drug-induced apoptotic death.
Fig. 3.
Immunocytochemical localization of TRAP1 following 6-OHDA treatment. Mitochondrial release of TRAP1 into the cytosol was examined in (A) MN9D cells, and (B) in primary cultures of mesencephalic dopaminergic neurons. Cultures were treated with or without 20~100 µM 6-OHDA for 18 hr. Cells were stained with anti-TRAP1, anti-Tom20 (an outer mitochondrial membrane protein, mitochondrial marker), anti-TH (dopaminergic neuron marker) antibodies. Hoechst 33258 was used as a counter staining probe to mark the nuclei.
Fig. 4.
Characterization of TRAP1 release in MN9D cells following treatment with other apoptosis-inducing drugs. MN9D cells were treated with or without (A) 1µM staurosporine (STS) or (B) 100 µM etoposide (ETO) for the indicated time periods and subjected to cellular fractionation (mitochondria and cytosol). Total and fractionated lysates were separated on SDS-PAGE and probed with anti-TRAP1 antibody.
Fig. 5.
Comparison of TRAP1 release patterns in MN9D cells following treatment with various apoptosis-inducing drugs. MN9D cells were treated with 100 µM 6-OHDA, 1 µM staurosporine (STS) or 100 µM etoposide for 18 hr. Cells were then subjected to an immunocytochemical localization of TRAP1 using anti-TRAP1 antibody.
TRAP1 was initially identified as an interactive protein that binds to the intracellular domain of TNFR1 in vitro [49]. TRAP1 is localized in the mitochondria and the member of the HSP90 family [41, 50, 51]. It possesses ATPase activity as well as chaperone activity. TRAP1 is shown to be induced by various environmental stresses. These include glucose deprivation, oxidative injury, and ultraviolet A irradiation. In these conditions, TRAP1 acts as a mitochondrial chaperone and plays an essential role for maintaining mitochondrial function and regulating cellular apoptosis [43, 46, 52, 53]. Consequently, overexpression of TRAP1 has been shown to protect cells from apoptotic death caused by mitochondrial dysfunction, oxidative stress, and ischemic injury in the brain and in the heart [45, 52]. Recently, the possibility of interrelationship between TRAP1 and Parkinson's disease has raised because TRAP1 was identified as a substrate of PTEN-induced putative kinase 1 (PINK1), one of the familial Parkinson's disease genes [54, 55]. PINK1 promotes cell survival against oxidative stress by phosphorylating TRAP1 and that is impaired by PD-linked PINK1 G309D, L347P, and W437X mutations [46]. Another identified protein called Grp75 is also a molecular chaperone primarily located in the mitochondria, where it functions to maintain mitochondrial homeostasis and antagonize oxidative stress injury. Therefore, knockdown of Grp75 induces mitochondrial dysfunction and it is rescued by Parkin [56]. Moreover, expression level of Grp75 is reduced and its interaction with another PD-associated protein DJ-1 is also diminished in the affected brain regions of PD patients. Recently, two amino acid exchanges in the ATPase domain (R126W) and the substrate-binding domain (P509S) of Grp75 in Spanish PD patients and other variant (A476T) in the substrate-binding domain in German PD patients were identified [57, 58, 59, 60]. Unfortunately, all of those studies listed above did not examine a potentially distinct functional role for these proteins in the mitochondrial and the cytosolic fraction. Therefore, further study aiming to this end may disclose a dynamic role for these proteins and their interplay with the known PD-related proteins. More specifically, there are several other points to be addressed to understand the significance and importance of drug-induced release of the mitochondrial proteins. For example, it is intriguing to investigate i) how the cytosolic TRAP1 regulates a functional role for the cytosolic PD-related proteins; ii) how drug-induced TRAP1 release is related to cell death, and iii) what other unidentified regulators or signaling pathways are also critically involved in these events. With these and many other unanswered questions in mind, further elucidation of the role of the TRAP1 at the molecular and cellular levels could contribute to our understanding of the pathogenesis of Parkinson's disease.
ACKNOWLEDGEMENTS
This work was supported from the Ministry for Health, Welfare and Family Affairs (A111382).
References
- 1.Mizuno Y, Ohta S, Tanaka M, Takamiya S, Suzuki K, Sato T, Oya H, Ozawa T, Kagawa Y. Deficiencies in complex I subunits of the respiratory chain in Parkinson's disease. Biochem Biophys Res Commun. 1989;163:1450–1455. doi: 10.1016/0006-291x(89)91141-8. [DOI] [PubMed] [Google Scholar]
- 2.Schapira AH. Mitochondrial complex I deficiency in Parkinson's disease. Adv Neurol. 1993;60:288–291. [PubMed] [Google Scholar]
- 3.Schapira AH, Cooper JM, Dexter D, Jenner P, Clark JB, Marsden CD. Mitochondrial complex I deficiency in Parkinson's disease. Lancet. 1989;1:1269. doi: 10.1016/s0140-6736(89)92366-0. [DOI] [PubMed] [Google Scholar]
- 4.Bindoff LA, Birch-Machin MA, Cartlidge NE, Parker WD, Jr, Turnbull DM. Respiratory chain abnormalities in skeletal muscle from patients with Parkinson's disease. J Neurol Sci. 1991;104:203–208. doi: 10.1016/0022-510x(91)90311-t. [DOI] [PubMed] [Google Scholar]
- 5.Krige D, Carroll MT, Cooper JM, Marsden CD, Schapira AH The Royal Kings and Queens Parkinson Disease Research Group. Platelet mitochondrial function in Parkinson's disease. Ann Neurol. 1992;32:782–788. doi: 10.1002/ana.410320612. [DOI] [PubMed] [Google Scholar]
- 6.Piccoli C, Sardanelli A, Scrima R, Ripoli M, Quarato G, D'Aprile A, Bellomo F, Scacco S, De Michele G, Filla A, Iuso A, Boffoli D, Capitanio N, Papa S. Mitochondrial respiratory dysfunction in familiar parkinsonism associated with PINK1 mutation. Neurochem Res. 2008;33:2565–2574. doi: 10.1007/s11064-008-9729-2. [DOI] [PubMed] [Google Scholar]
- 7.Gandhi S, Wood-Kaczmar A, Yao Z, Plun-Favreau H, Deas E, Klupsch K, Downward J, Latchman DS, Tabrizi SJ, Wood NW, Duchen MR, Abramov AY. PINK1-associated Parkinson's disease is caused by neuronal vulnerability to calcium-induced cell death. Mol Cell. 2009;33:627–638. doi: 10.1016/j.molcel.2009.02.013. [DOI] [PMC free article] [PubMed] [Google Scholar]
- 8.Yang Y, Gehrke S, Imai Y, Huang Z, Ouyang Y, Wang JW, Yang L, Beal MF, Vogel H, Lu B. Mitochondrial pathology and muscle and dopaminergic neuron degeneration caused by inactivation of Drosophila Pink1 is rescued by Parkin. Proc Natl Acad Sci U S A. 2006;103:10793–10798. doi: 10.1073/pnas.0602493103. [DOI] [PMC free article] [PubMed] [Google Scholar]
- 9.Poole AC, Thomas RE, Andrews LA, McBride HM, Whitworth AJ, Pallanck LJ. The PINK1/Parkin pathway regulates mitochondrial morphology. Proc Natl Acad Sci U S A. 2008;105:1638–1643. doi: 10.1073/pnas.0709336105. [DOI] [PMC free article] [PubMed] [Google Scholar]
- 10.Deas E, Plun-Favreau H, Wood NW. PINK1 function in health and disease. EMBO Mol Med. 2009;1:152–165. doi: 10.1002/emmm.200900024. [DOI] [PMC free article] [PubMed] [Google Scholar]
- 11.Weihofen A, Thomas KJ, Ostaszewski BL, Cookson MR, Selkoe DJ. Pink1 forms a multiprotein complex with Miro and Milton, linking Pink1 function to mitochondrial trafficking. Biochemistry. 2009;48:2045–2052. doi: 10.1021/bi8019178. [DOI] [PMC free article] [PubMed] [Google Scholar]
- 12.Valente EM, Abou-Sleiman PM, Caputo V, Muqit MM, Harvey K, Gispert S, Ali Z, Del Turco D, Bentivoglio AR, Healy DG, Albanese A, Nussbaum R, González-Maldonado R, Deller T, Salvi S, Cortelli P, Gilks WP, Latchman DS, Harvey RJ, Dallapiccola B, Auburger G, Wood NW. Hereditary early-onset Parkinson's disease caused by mutations in PINK1. Science. 2004;304:1158–1160. doi: 10.1126/science.1096284. [DOI] [PubMed] [Google Scholar]
- 13.Biskup S, Moore DJ, Celsi F, Higashi S, West AB, Andrabi SA, Kurkinen K, Yu SW, Savitt JM, Waldvogel HJ, Faull RL, Emson PC, Torp R, Ottersen OP, Dawson TM, Dawson VL. Localization of LRRK2 to membranous and vesicular structures in mammalian brain. Ann Neurol. 2006;60:557–569. doi: 10.1002/ana.21019. [DOI] [PubMed] [Google Scholar]
- 14.Kim Y, Park J, Kim S, Song S, Kwon SK, Lee SH, Kitada T, Kim JM, Chung J. PINK1 controls mitochondrial localization of Parkin through direct phosphorylation. Biochem Biophys Res Commun. 2008;377:975–980. doi: 10.1016/j.bbrc.2008.10.104. [DOI] [PubMed] [Google Scholar]
- 15.Shavali S, Brown-Borg HM, Ebadi M, Porter J. Mitochondrial localization of alpha-synuclein protein in alpha-synuclein overexpressing cells. Neurosci Lett. 2008;439:125–128. doi: 10.1016/j.neulet.2008.05.005. [DOI] [PMC free article] [PubMed] [Google Scholar]
- 16.Junn E, Jang WH, Zhao X, Jeong BS, Mouradian MM. Mitochondrial localization of DJ-1 leads to enhanced neuroprotection. J Neurosci Res. 2009;87:123–129. doi: 10.1002/jnr.21831. [DOI] [PMC free article] [PubMed] [Google Scholar]
- 17.Meriin AB, Sherman MY. Role of molecular chaperones in neurodegenerative disorders. Int J Hyperthermia. 2005;21:403–419. doi: 10.1080/02656730500041871. [DOI] [PubMed] [Google Scholar]
- 18.Berke SJ, Paulson HL. Protein aggregation and the ubiquitin proteasome pathway: gaining the UPPer hand on neurodegeneration. Curr Opin Genet Dev. 2003;13:253–261. doi: 10.1016/s0959-437x(03)00053-4. [DOI] [PubMed] [Google Scholar]
- 19.Grünblatt E, Mandel S, Jacob-Hirsch J, Zeligson S, Amariglo N, Rechavi G, Li J, Ravid R, Roggendorf W, Riederer P, Youdim MB. Gene expression profiling of parkinsonian substantia nigra pars compacta; alterations in ubiquitin-proteasome, heat shock protein, iron and oxidative stress regulated proteins, cell adhesion/cellular matrix and vesicle trafficking genes. J Neural Transm. 2004;111:1543–1573. doi: 10.1007/s00702-004-0212-1. [DOI] [PubMed] [Google Scholar]
- 20.Zhang Y, James M, Middleton FA, Davis RL. Transcriptional analysis of multiple brain regions in Parkinson's disease supports the involvement of specific protein processing, energy metabolism, and signaling pathways, and suggests novel disease mechanisms. Am J Med Genet B Neuropsychiatr Genet. 2005;137B:5–16. doi: 10.1002/ajmg.b.30195. [DOI] [PubMed] [Google Scholar]
- 21.Choudhary J, Grant SG. Proteomics in postgenomic neuroscience: the end of the beginning. Nat Neurosci. 2004;7:440–445. doi: 10.1038/nn1240. [DOI] [PubMed] [Google Scholar]
- 22.Fountoulakis M, Kossida S. Proteomics-driven progress in neurodegeneration research. Electrophoresis. 2006;27:1556–1573. doi: 10.1002/elps.200500738. [DOI] [PubMed] [Google Scholar]
- 23.Pienaar IS, Daniels WM, Götz J. Neuroproteomics as a promising tool in Parkinson's disease research. J Neural Transm. 2008;115:1413–1430. doi: 10.1007/s00702-008-0070-3. [DOI] [PMC free article] [PubMed] [Google Scholar]
- 24.Licker V, Kövari E, Hochstrasser DF, Burkhard PR. Proteomics in human Parkinson's disease research. J Proteomics. 2009;73:10–29. doi: 10.1016/j.jprot.2009.07.007. [DOI] [PubMed] [Google Scholar]
- 25.Basso M, Giraudo S, Corpillo D, Bergamasco B, Lopiano L, Fasano M. Proteome analysis of human substantia nigra in Parkinson's disease. Proteomics. 2004;4:3943–3952. doi: 10.1002/pmic.200400848. [DOI] [PubMed] [Google Scholar]
- 26.Jin J, Hulette C, Wang Y, Zhang T, Pan C, Wadhwa R, Zhang J. Proteomic identification of a stress protein, mortalin/mthsp70/GRP75: relevance to Parkinson disease. Mol Cell Proteomics. 2006;5:1193–1204. doi: 10.1074/mcp.M500382-MCP200. [DOI] [PubMed] [Google Scholar]
- 27.Van Laar VS, Dukes AA, Cascio M, Hastings TG. Proteomic analysis of rat brain mitochondria following exposure to dopamine quinone: implications for Parkinson disease. Neurobiol Dis. 2008;29:477–489. doi: 10.1016/j.nbd.2007.11.007. [DOI] [PMC free article] [PubMed] [Google Scholar]
- 28.Zhang J, Sokal I, Peskind ER, Quinn JF, Jankovic J, Kenney C, Chung KA, Millard SP, Nutt JG, Montine TJ. CSF multianalyte profile distinguishes Alzheimer and Parkinson diseases. Am J Clin Pathol. 2008;129:526–529. doi: 10.1309/W01Y0B808EMEH12L. [DOI] [PMC free article] [PubMed] [Google Scholar]
- 29.Jin J, Meredith GE, Chen L, Zhou Y, Xu J, Shie FS, Lockhart P, Zhang J. Quantitative proteomic analysis of mitochondrial proteins: relevance to Lewy body formation and Parkinson's disease. Brain Res Mol Brain Res. 2005;134:119–138. doi: 10.1016/j.molbrainres.2004.10.003. [DOI] [PubMed] [Google Scholar]
- 30.Diedrich M, Mao L, Bernreuther C, Zabel C, Nebrich G, Kleene R, Klose J. Proteome analysis of ventral midbrain in MPTP-treated normal and L1cam transgenic mice. Proteomics. 2008;8:1266–1275. doi: 10.1002/pmic.200700754. [DOI] [PubMed] [Google Scholar]
- 31.Lee YM, Park SH, Chung KC, Oh YJ. Proteomic analysis reveals upregulation of calreticulin in murine dopaminergic neuronal cells after treatment with 6-hydroxydopamine. Neurosci Lett. 2003;352:17–20. doi: 10.1016/j.neulet.2003.08.018. [DOI] [PubMed] [Google Scholar]
- 32.Lee YM, Park SH, Shin DI, Hwang JY, Park B, Park YJ, Lee TH, Chae HZ, Jin BK, Oh TH, Oh YJ. Oxidative modification of peroxiredoxin is associated with drug-induced apoptotic signaling in experimental models of Parkinson disease. J Biol Chem. 2008;283:9986–9998. doi: 10.1074/jbc.M800426200. [DOI] [PubMed] [Google Scholar]
- 33.De Iuliis A, Grigoletto J, Recchia A, Giusti P, Arslan P. A proteomic approach in the study of an animal model of Parkinson's disease. Clin Chim Acta. 2005;357:202–209. doi: 10.1016/j.cccn.2005.03.028. [DOI] [PubMed] [Google Scholar]
- 34.Nakamura M, Yamada M, Ohsawa T, Morisawa H, Nishine T, Nishimura O, Toda T. Phosphoproteomic profiling of human SH-SY5Y neuroblastoma cells during response to 6-hydroxydopamine-induced oxidative stress. Biochim Biophys Acta. 2006;1763:977–989. doi: 10.1016/j.bbamcr.2006.07.008. [DOI] [PubMed] [Google Scholar]
- 35.Valastro B, Dekundy A, Krogh M, Lundblad M, James P, Danysz W, Quack G, Cenci MA. Proteomic analysis of striatal proteins in the rat model of L-DOPA-induced dyskinesia. J Neurochem. 2007;102:1395–1409. doi: 10.1111/j.1471-4159.2007.04655.x. [DOI] [PubMed] [Google Scholar]
- 36.McLaughlin P, Zhou Y, Ma T, Liu J, Zhang W, Hong JS, Kovacs M, Zhang J. Proteomic analysis of microglial contribution to mouse strain-dependent dopaminergic neurotoxicity. Glia. 2006;53:567–582. doi: 10.1002/glia.20294. [DOI] [PubMed] [Google Scholar]
- 37.van Loo G, Schotte P, van Gurp M, Demol H, Hoorelbeke B, Gevaert K, Rodriguez I, Ruiz-Carrillo A, Vandekerckhove J, Declercq W, Beyaert R, Vandenabeele P. Endonuclease G: a mitochondrial protein released in apoptosis and involved in caspase-independent DNA degradation. Cell Death Differ. 2001;8:1136–1142. doi: 10.1038/sj.cdd.4400944. [DOI] [PubMed] [Google Scholar]
- 38.Arnoult D, Gaume B, Karbowski M, Sharpe JC, Cecconi F, Youle RJ. Mitochondrial release of AIF and EndoG requires caspase activation downstream of Bax/Bak-mediated permeabilization. EMBO J. 2003;22:4385–4399. doi: 10.1093/emboj/cdg423. [DOI] [PMC free article] [PubMed] [Google Scholar]
- 39.Goldstein JC, Muñoz-Pinedo C, Ricci JE, Adams SR, Kelekar A, Schuler M, Tsien RY, Green DR. Cytochrome c is released in a single step during apoptosis. Cell Death Differ. 2005;12:453–462. doi: 10.1038/sj.cdd.4401596. [DOI] [PubMed] [Google Scholar]
- 40.Precht TA, Phelps RA, Linseman DA, Butts BD, Le SS, Laessig TA, Bouchard RJ, Heidenreich KA. The permeability transition pore triggers Bax translocation to mitochondria during neuronal apoptosis. Cell Death Differ. 2005;12:255–265. doi: 10.1038/sj.cdd.4401552. [DOI] [PubMed] [Google Scholar]
- 41.Chen CF, Chen Y, Dai K, Chen PL, Riley DJ, Lee WH. A new member of the hsp90 family of molecular chaperones interacts with the retinoblastoma protein during mitosis and after heat shock. Mol Cell Biol. 1996;16:4691–4699. doi: 10.1128/mcb.16.9.4691. [DOI] [PMC free article] [PubMed] [Google Scholar]
- 42.Montesano Gesualdi N, Chirico G, Pirozzi G, Costantino E, Landriscina M, Esposito F. Tumor necrosis factor-associated protein 1 (TRAP-1) protects cells from oxidative stress and apoptosis. Stress. 2007;10:342–350. doi: 10.1080/10253890701314863. [DOI] [PubMed] [Google Scholar]
- 43.Hua G, Zhang Q, Fan Z. Heat shock protein 75 (TRAP1) antagonizes reactive oxygen species generation and protects cells from granzyme M-mediated apoptosis. J Biol Chem. 2007;282:20553–20560. doi: 10.1074/jbc.M703196200. [DOI] [PubMed] [Google Scholar]
- 44.Im CN, Lee JS, Zheng Y, Seo JS. Iron chelation study in a normal human hepatocyte cell line suggests that tumor necrosis factor receptor-associated protein 1 (TRAP1) regulates production of reactive oxygen species. J Cell Biochem. 2007;100:474–486. doi: 10.1002/jcb.21064. [DOI] [PubMed] [Google Scholar]
- 45.Xu L, Voloboueva LA, Ouyang Y, Emery JF, Giffard RG. Overexpression of mitochondrial Hsp70/Hsp75 in rat brain protects mitochondria, reduces oxidative stress, and protects from focal ischemia. J Cereb Blood Flow Metab. 2009;29:365–374. doi: 10.1038/jcbfm.2008.125. [DOI] [PMC free article] [PubMed] [Google Scholar]
- 46.Pridgeon JW, Olzmann JA, Chin LS, Li L. PINK1 protects against oxidative stress by phosphorylating mitochondrial chaperone TRAP1. PLoS Biol. 2007;5:e172. doi: 10.1371/journal.pbio.0050172. [DOI] [PMC free article] [PubMed] [Google Scholar]
- 47.Bandopadhyay R, de Belleroche J. Pathogenesis of Parkinson's disease: emerging role of molecular chaperones. Trends Mol Med. 2010;16:27–36. doi: 10.1016/j.molmed.2009.11.004. [DOI] [PubMed] [Google Scholar]
- 48.Han BS, Hong HS, Choi WS, Markelonis GJ, Oh TH, Oh YJ. Caspase-dependent and -independent cell death pathways in primary cultures of mesencephalic dopaminergic neurons after neurotoxin treatment. J Neurosci. 2003;23:5069–5078. doi: 10.1523/JNEUROSCI.23-12-05069.2003. [DOI] [PMC free article] [PubMed] [Google Scholar]
- 49.Song HY, Dunbar JD, Zhang YX, Guo D, Donner DB. Identification of a protein with homology to hsp90 that binds the type 1 tumor necrosis factor receptor. J Biol Chem. 1995;270:3574–3581. [PubMed] [Google Scholar]
- 50.Cechetto JD, Gupta RS. Immunoelectron microscopy provides evidence that tumor necrosis factor receptor-associated protein 1 (TRAP-1) is a mitochondrial protein which also localizes at specific extramitochondrial sites. Exp Cell Res. 2000;260:30–39. doi: 10.1006/excr.2000.4983. [DOI] [PubMed] [Google Scholar]
- 51.Owen BA, Sullivan WP, Felts SJ, Toft DO. Regulation of heat shock protein 90 ATPase activity by sequences in the carboxyl terminus. J Biol Chem. 2002;277:7086–7091. doi: 10.1074/jbc.M111450200. [DOI] [PubMed] [Google Scholar]
- 52.Voloboueva LA, Duan M, Ouyang Y, Emery JF, Stoy C, Giffard RG. Overexpression of mitochondrial Hsp70/Hsp75 protects astrocytes against ischemic injury in vitro. J Cereb Blood Flow Metab. 2008;28:1009–1016. doi: 10.1038/sj.jcbfm.9600600. [DOI] [PMC free article] [PubMed] [Google Scholar]
- 53.Landriscina M, Amoroso MR, Piscazzi A, Esposito F. Heat shock proteins, cell survival and drug resistance: the mitochondrial chaperone TRAP1, a potential novel target for ovarian cancer therapy. Gynecol Oncol. 2010;117:177–182. doi: 10.1016/j.ygyno.2009.10.078. [DOI] [PubMed] [Google Scholar]
- 54.Abeliovich A. Parkinson's disease: pro-survival effects of PINK1. Nature. 2007;448:759–760. doi: 10.1038/448759a. [DOI] [PubMed] [Google Scholar]
- 55.Kroemer G, Blomgren K. Mitochondrial cell death control in familial Parkinson disease. PLoS Biol. 2007;5:e206. doi: 10.1371/journal.pbio.0050206. [DOI] [PMC free article] [PubMed] [Google Scholar]
- 56.Yang H, Zhou X, Liu X, Yang L, Chen Q, Zhao D, Zuo J, Liu W. Mitochondrial dysfunction induced by knockdown of mortalin is rescued by Parkin. Biochem Biophys Res Commun. 2011;410:114–120. doi: 10.1016/j.bbrc.2011.05.116. [DOI] [PubMed] [Google Scholar]
- 57.Kaul SC, Deocaris CC, Wadhwa R. Three faces of mortalin: a housekeeper, guardian and killer. Exp Gerontol. 2007;42:263–274. doi: 10.1016/j.exger.2006.10.020. [DOI] [PubMed] [Google Scholar]
- 58.Deocaris CC, Kaul SC, Wadhwa R. From proliferative to neurological role of an hsp70 stress chaperone, mortalin. Biogerontology. 2008;9:391–403. doi: 10.1007/s10522-008-9174-2. [DOI] [PubMed] [Google Scholar]
- 59.Burbulla LF, Schelling C, Kato H, Rapaport D, Woitalla D, Schiesling C, Schulte C, Sharma M, Illig T, Bauer P, Jung S, Nordheim A, Schöls L, Riess O, Krüger R. Dissecting the role of the mitochondrial chaperone mortalin in Parkinson's disease: functional impact of disease-related variants on mitochondrial homeostasis. Hum Mol Genet. 2010;19:4437–4452. doi: 10.1093/hmg/ddq370. [DOI] [PMC free article] [PubMed] [Google Scholar]
- 60.Chiasserini D, Tozzi A, de Iure A, Tantucci M, Susta F, Orvietani PL, Koya K, Binaglia L, Calabresi P. Mortalin inhibition in experimental Parkinson's disease. Mov Disord. 2011;26:1639–1647. doi: 10.1002/mds.23647. [DOI] [PubMed] [Google Scholar]


