

Abstract
Caveolin induces membrane curvature and drives the formation of caveolae that participate in many crucial cell functions such as endocytosis. The central portion of caveolin-1 contains two helices (H1 and H2) connected by a three-residue break with both N- and C-termini exposed to the cytoplasm. Although a U-shaped configuration is assumed based on its inaccessibility by extracellular matrix probes, caveolin structure in a bilayer remains elusive. This work aims to characterize the structure and dynamics of caveolin-1 (D82–S136; Cav182–136) in a DMPC bilayer using NMR, fluorescence emission measurements, and molecular dynamics simulations. The secondary structure of Cav182–136 from NMR chemical shift indexing analysis serves as a guideline for generating initial structural models. Fifty independent molecular dynamics simulations (100 ns each) are performed to identify its favorable conformation and orientation in the bilayer. A representative configuration was chosen from these multiple simulations and simulated for 1 μs to further explore its stability and dynamics. The results of these simulations mirror those from the tryptophan fluorescence measurements (i.e., Cav182–136 insertion depth in the bilayer), corroborate that Cav182–136 inserts in the membrane with U-shaped conformations, and show that the angle between H1 and H2 ranges from 35 to 69°, and the tilt angle of Cav182–136 is 27 ± 6°. The simulations also reveal that specific faces of H1 and H2 prefer to interact with each other and with lipid molecules, and these interactions stabilize the U-shaped conformation.
Introduction
Caveolae are flask-shaped plasma membrane invaginations rich in sphingomyelin and cholesterol. They are 500–1000 Å in diameter and bulge in toward the cytoplasm (1–3). Caveolae are found in high abundance in mammalian cells, particularly in terminally differentiated cell types such as adipocytes, cardiac myocytes, endothelial cells, fibroblasts, macrophages, and smooth muscle cells (4,5). Caveolae are considered to be multifunctional organelles that participate in endocytosis, signal transduction, membrane trafficking, and many other vital cellular processes (3,6–9). Misregulation and malfunction of caveolae has been linked to numerous human diseases such as infection, muscular dystrophy, heart disease, Alzheimer’s disease, and cancer (10–13).
The most important protein found in caveolae is caveolin, which has been demonstrated to be necessary for caveolae formation (14,15). There are three caveolin isoforms, caveolin-1, -2, and -3, among which caveolin-1 is the most ubiquitous (5). Caveolin-1 is a 22-kDa integral membrane protein that adopts an unusual topology where the polypeptide is inaccessible from the extracellular side of the plasma membrane, and both the N- and C-termini are exposed to the cytoplasm (16,17). The N-terminal domain (residues 1–81) is the least conserved portion of the protein and varies significantly between caveolin isoforms (18). The next 20 residues (i.e., 82–101) are referred to as the caveolin scaffold domain (CSD). The CSD has been implicated in caveolin oligomerization, membrane binding, cholesterol binding, and interactions with other proteins (4,19). The C-terminal domain spans residues 135–178, and its functions are thought to include membrane attachment and protein interactions (20,21). The N- and C-terminal domains are bridged by the hydrophobic transmembrane domain (TMD, residues 102–134), which has been proposed to adopt an intramembrane U-shaped structure (17,22). Such a TMD topology is supported by data from NMR measurements that reveal a helix-break-helix motif (23). Fig. 1 details the different domains established for caveolin-1.
Figure 1.
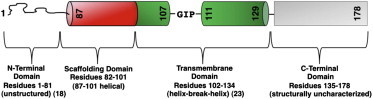
Proposed domains of caveolin-1. To see this figure in color, go online.
Considerable efforts have been devoted to uncovering the structure of caveolin on the atomic level. Despite these efforts, there are still two major questions that need to be addressed: what is the structure and orientation of caveolin-1 in a bilayer? and are there specific caveolin-lipid interactions that dictate caveolin structure and orientation in a bilayer? This study aims to address such questions using molecular dynamics (MD) simulations guided and supported by NMR and tryptophan fluorescence emission data. NMR experiments were performed to determine the secondary structure of a caveolin-1 construct consisting of the CSD and TMD (residues 82–136: Cav182–136). Chemical shift index analysis indicates that residues A87–F107 form helix 1 (H1) and L111–A129 form helix 2 (H2). The helices are separated by a short break, which spans from G108 to P110 (Fig. 2). All of the simulations started from this secondary structure information. To sample a large conformational space, 50 MD simulations (100 ns each) were performed from various starting points with different angles between H1 and H2, different H1 and H2 interfaces, and different insertion depths. Next, a structure with favorable conformational and orientational parameters was identified from these simulations and subjected to a longer 1-μs simulation to further explore dynamics, stability, and protein-lipid interactions.
Figure 2.
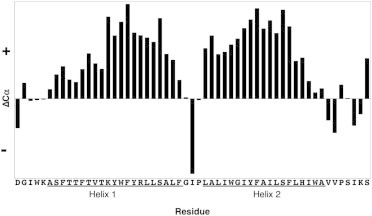
Chemical shift index plot of Cav182–136. Positive ΔCα values are indicative of α-helical structure (24). Helix 1 (H1) spans residues A87–F107 and Helix 2 (H2) spans residues L111–A129. The two helices are separated by a three-residue break (G108–P110).
The simulation results show that the U-shaped conformation of Cav182–136 embedded in the lipid bilayer is stable over the course of the simulations, indicating that an intramembrane turn is a realistic possibility. The tilt of the overall Cav182–136 molecule was determined to be 27 ± 6°, an orientation slightly tilted away from the membrane normal. The angle between the H1 and H2 helices was dynamic with an average at 53 ± 5°. The simulations revealed specific side-chain interactions near the G108–P110 break that help maintain the U-shaped conformation. Importantly, the insertion depths of the break residues (G108–P110) were found to be within the hydrophobic core of the membrane. Also, the insertion depths of the four tryptophan residues determined in the simulations were in good agreement with the Stoke’s shift data obtained for Cav182–136 single tryptophan mutants. Simulations examining the effect of Cav182–136 on bilayer thickness revealed that residues at the N-terminus of H1 and the C-terminus of H2 can interact with lipid headgroups in the top leaflet of the lipid bilayer whereas the residues within and around the break region can interact with lipid headgroups at the bottom leaflet via water mediated hydrogen-bonding. These interactions are responsible for causing membrane deformation. Overall, our studies provide a better understanding of caveolin-1 structure and behavior within the lipid bilayer.
Methods
NMR spectroscopy
Isotopically labeled Cav182–136 was prepared according to previous protocols (23–25). Lyophilized Cav182–136 was dissolved into buffer containing 100 mM LMPG (1-myristoyl-2-hydroxy-sn-Glycero-3-[Phospho-rac-(1-glycerol)] (sodium salt)), 100 mM NaCl, 20 mM phosphate at pH 7, and 10% D2O to a concentration of ∼1.0 mM. Vigorous vortexing of this mixture resulted in a clear homogeneous solution. Lastly, the sample was passed through a 0.2-μm regenerated cellulose spin filter.
All NMR spectra were acquired at 310 K using a 600 MHz Avance II spectrometer (Bruker, Billerica, MA) equipped with a cryoprobe. For analysis and backbone assignments, the following transverse relaxation optimized spectroscopy-based (26) pulse sequences were employed: HSQC (27), HNCA (28), HNCACB (29), HN(CO)CA (30), and HNCO (31). The spectra were processed using the softwares NMRPIPE and SPARKY (32,33). For chemical shift indexing, the observed Cα chemical shifts were subtracted from their corresponding random coil chemical shifts as described by Wishart and Sykes (24). To aid in backbone assignments, specific amino-acid labeling was employed (Gly, Phe, Tyr, Leu, Ile, and Val).
Tryptophan fluorescence measurements
Cav182–136 was purified and expressed according to previous protocols (34). Cav182–136 contains four tryptophan residues: W85, W98, W115, and W128. Single tryptophan mutant constructs were prepared using the QuikChange site-directed mutagenesis kit (Agilent, Santa Clara, CA). In each mutant, one of the four native tryptophan residues was retained and the other three were mutated to phenylalanine. HSQC spectra were obtained for all four mutants to confirm that these mutations were not altering the structure of Cav182–136 (data not shown).
Cav182–136 was reconstituted into 4% (w/w) lipid, q = 0.5 DMPC/CHAPSO (1,2 dimyristoylphosphatidylcholine/3-[(3-cholamidopropyl)dimethylammonio]-2-hydroxy-1-propane sulfonate) bicelles at a protein concentration of 30 μM. To achieve this, Cav182–136 was first reconstituted into DMPC vesicles by dissolving the protein and lipid to 30 μM and 20 mM, respectively, in a buffer containing 300 mM perfluorocatanoic acid and 20 mM Tris-HCl pH 8.0. This solution was then dialyzed (three 24-h exchanges) against 1 L buffer (20 mM Tris-HCl pH 8.0 and 50 mM NaCl). The vesicle-containing solution was centrifuged at 10,000 × g for 20 min at room temperature. The supernatant was then centrifuged at 366,613 × g for 2 h at 4°C to pellet the vesicles. The pelleted vesicles were then converted into 4% (w/w) lipid, q = 0.5 bicelles by adding ice-cold buffer components (2.704 mL 20 mM phosphate pH 7.0 and 296 μL 25% (w/w) CHAPSO) and slowly mixing on ice over the course of 30–60 min. The bicelles were then centrifuged at 10,000 × g for 20 min at room temperature. The supernatant was used for fluorescence measurements. Three separately prepared samples were used to determine λmax for each single tryptophan mutant. Bicelles were used because they scatter very little light, and contain a planar DMPC bilayer, which closely mimics the environment employed in the simulations (35).
Fluorescence emission spectra were acquired using a 1 × 1 cm quartz cuvette held at 310 K with an Eclipse fluorometer (Agilent, Santa Clara, CA). The excitation wavelength used was 295 nm to avoid unwanted tyrosine excitation (36). Both the excitation and emission slit widths were set to 5 nm. The emission spectra were measured from 315 to 500 nm with a scan speed of 1 nm/s and 0.5 nm data point increments. Four scans were averaged for each construct. A blank solution containing only bicelles was used to subtract background fluorescence. The λmax values were obtained by fitting the spectra to a log-normal distribution (37).
Multiple caveolin-1 simulations in DMPC bilayers
An in silico Cav182–136 model was first generated by the IC BUILD command in CHARMM (38) with the sequence shown in Fig. 2. Based on the chemical shift index analysis, residues A87–F107 (H1) and L111–A129 (H2) were modeled as ideal α-helices with their ϕ- and ψ-angles set to −57.8° and −47°, respectively; the other residues were modeled with their ϕ- and ψ-angles in the CHARMM residue topology file. By randomly changing the ϕ- and ψ-angles of G108 in the break region (G108–P110), initial structures of Cav182–136 with various angles between the helical axes of H1 and H2 (θ) were obtained. These structures were then placed into five categories (θinitial = 45, 55, 65, 75, and 85°), each including 10 replicas, all of which have θ within 5° to θinitial. Before inserting each initial caveolin-1 model into membrane bilayers, it was reoriented so that its axis, defined by the vector sum of the principal axes of H1 and H2, coincided with the Z axis, the membrane normal. Because no prior knowledge on the insertion depth of Cav182–136 was available, the model in each replica system was initially positioned along the Z axis by randomly placing the break residues’ centers of mass (COM) between Z = −5 Å and 5 Å; by definition, Z = 0 corresponds to the bilayer center.
These initial models were embedded in DMPC bilayers and solvated by 0.15 M KCl solutions. This resulted in systems with ∼52,000 atoms and a size of 75 × 75 × 90 Å3. Each system was individually constructed using the MEMBRANE BUILDER module (39,40) in CHARMM-GUI (41). The name of each system was given in the form of cav1_P_Q, with P and Q corresponding to the value of θinitial and the replica index. For example, cav1_45_5 corresponds to the fifth replica with θinitial = 45°. Following the assembly of each system was a brief equilibration of 225 ps to relax the initially uncorrelated system components. A 100-ns MD simulation was then performed for each system. In the first 50 ns of each simulation, dihedral restraints were applied to H1 and H2 backbone atoms to maintain their secondary structure according to the chemical shift index analysis (Fig. 2). After 50 ns, these restraints were removed and each system was simulated for another 50 ns. The first 50 ns were designated to allow each system to reach equilibrium, and therefore were not used in the trajectory analyses.
All calculations were performed with the constant particle number, pressure, and temperature (NPT) ensemble (42) using CHARMM (38). The temperature was held at 310 K using Nosé-Hoover temperature control (43,44) and the extended system algorithm was employed to maintain the pressure at 1 atm along the membrane normal (42). The C27 all-atom force field (45) with a modified version of dihedral cross-term correction (46) was used for the protein. Although this force field is known to favor the formation of α-helical segments and its use could cause problems in small peptide folding simulations (47–49), it is not a major concern in the system under discussion because the secondary structure of Cav182–136, namely the two helices H1 and H2 (Figs. 1 and 2), was determined with NMR chemical shift indexing analysis before starting the simulations. In addition to the protein force field, the C36 lipid force field (50) was used for DMPC and the TIP3P water model (51) was employed for water molecules. A time step of 2 fs was enabled with the SHAKE algorithm (52). Because of the U-shaped conformation of caveolin-1 and potential changes in the protein cross-sectional area in both lipid leaflets during the simulation, the P21 image transformation (53) was applied to allow the variation in the number of lipids at the top and bottom leaflets during the simulation. The nonbonded and dynamics options were kept the same as in the MEMBRANE BUILDER input; the van der Waals interactions were smoothly switched off at 10–12 Å by a force-switching function (54) and the electrostatic interactions were calculated using the particle-mesh Ewald method (55) with a mesh size of ∼1 Å for fast Fourier transformation, κ = 0.34 Å−1, and a sixth-order B-spline interpolation.
Defining caveolin-1 structure and orientation in a membrane
Quantitative characterization of Cav182–136 structure and dynamics in a membrane requires its intramolecular fold and topological orientation with regard to the bilayer. The intramolecular fold of Cav182–136 can be defined by four parameters: the angle between the helical axes of H1 and H2 (θ); the rotation angles of H1 (ρ1) and H2 (ρ2); and the pair of residues that are in close contact (Resij) (Fig. 3 A). For each helix, the angle between the projections of two vectors on the plane perpendicular to its helical axis is used to define the rotation. The two vectors include: the reference vector connecting the centers of the two helices, and the vector pointing from the center of the helix to a reference atom, which is chosen arbitrarily to be the fifth Cα from the N-terminus of the helix. No terminal residues are used to define the rotation angles because their flexibility could affect the readout and increase the difficulties in interpreting the data.
Figure 3.
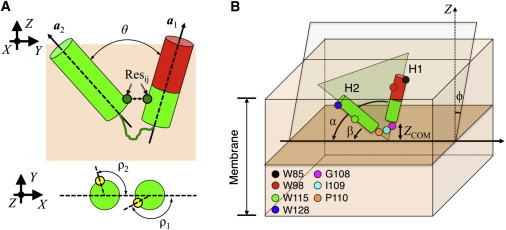
(A) Degrees of freedom used to define the conformation of Cav182–136. They include θ, ρ1, ρ2, and the contacting residues pairs (Resij). Reference atoms (Cα of T91 on H1 and Cα of W115 on H2) employed in ρ1 and ρ2 calculation are shown as yellow spheres. (B) Degrees of freedom (ϕ, α, β, and ZCOM) describing the topological orientation of caveolin-1 with respect to a membrane bilayer. The membrane is centered at Z = 0. Residues of interest are indicated by colored spheres. CSD domain (D82–R101) is shown as a red cylinder. To see this figure in color, go online.
To describe the topological orientation of Cav182–136 with reference to the membrane bilayer, four additional variables are needed. These variables are the Cav182–136 tilt angle (ϕ), which is the angle between the molecular plane of Cav182–136 and the membrane normal; the individual helix tilt angles of H1 (α) and H2 (β) in the Cav182–136 molecular plane; and the insertion depth (ZCOM), i.e., the COM Z position of the residues at the break (G108–P110) (Fig. 3 B). The Cav182–136 molecular plane is the least-squares plane through all the Cα atoms defining the H1 and H2 helices. It is worth pointing out that both θ and the individual helix tilt angle pair α and β are necessary for an unambiguous description of caveolin-1 configuration. The difference between α and β makes a good approximation of θ (i.e., θ ≈ α − β) in most cases, especially when both H1 and H2 lie in the molecular plane of caveolin-1. However, caveolin configurations with the helices slightly deviating from the molecular plane do exist during the simulations. In this case, α and β alone do not provide enough information on caveolin configuration/orientation.
1-μs ANTON simulation starting from a favorable caveolin-1 configuration
The trajectories generated by the multiple MD simulations were analyzed to investigate the conformational and structural preference of Cav182–136 in a DMPC bilayer. The distributions of the structural parameters (θ, ϕ, ZCOM, ρ1, ρ2, α, and β) were plotted and the most probable values for these parameters were identified. The favorable structures were the ones that have structural parameters similar to these. One of these favorable structures was a snapshot from system cav1_65_3 at 35 ns. This system was taken and used to initiate a 1-μs simulation to further explore dynamics, stability, and protein-lipid interactions. The simulation was carried out on ANTON (56), a special-purpose supercomputer designed for long timescale MD simulations. The constant particle number, volume, and temperature (NVT) ensemble was employed with the Nosé-Hoover temperature coupling scheme (57). The temperature (310 K) was set to the same as those used in the multiple 100-ns MD simulations described above. The lengths of all bonds involving hydrogen atoms were constrained using M-SHAKE (58). The cutoff of the van der Waals and short-range electrostatic interactions was set to 10.06 Å. Long-range electrostatic interactions were evaluated with the k-space Gaussian split Ewald method (59) and a 64 × 64 × 64 mesh. The integration time step was 2 fs. The r-RESPA integration method (60) was employed and long-range electrostatics were evaluated every 6 fs.
Results and Discussion
Probing the secondary structure of Cav182–136
To assign the backbone resonances, a combination of HSQC, HNCA, HNCACB, HNCO, and HN(CO)CA experiments, in conjunction with selective amino-acid labeling, were employed. Using these methods, 96% of the backbone residues were assigned and the chemical shifts of all of the Cα values were obtained. Fig. 2 shows a chemical shift index plot of Cav182–136. Residues 87–107 (H1) and 111–129 (H2) had consistently positive ΔCα values, which is indicative of an α-helical structure (24). The break between the two helices, residues 108–110, is the site of the putative turn, which returns the polypeptide chain to the same side of the membrane (23). Residues 82–86 and 130–136 do not have consistently positive or negative ΔCα values, indicating that these regions are unstructured or dynamic. This result indicates that Cav182–136 is composed of two helices separated by a short three-residue break. In addition, data (input of Cα, Cβ, CO, N, and NH) processed using TALOS+ (61) confirms these findings (data not shown). This result is in contrast to the model put forth by Parton et al. (62), which is based on primary sequence analysis, and predicts three distinct helical regions for residues 82–136 (i.e., 81–92, 97–107, and 112–128). Clearly, our experimental data add an important enhancement to this model by showing that residues 87–107 form one long continuous α-helix.
Probing the angle between Helix 1 and Helix 2
In vivo studies performed on caveolin-1 have shown that the N- and C-termini face the cytoplasm and that there is no portion of the protein that is accessible from the extracellular environment (16,17). This has led to a proposed topology in which the transmembrane domain of caveolin adopts an intramembrane U-shaped conformation. When the secondary structure observed for Cav182–136 (see above section) is integrated into this proposed topology, it creates a potential model in which the U-shaped conformation consists of two helices separated by a three-residue break. This introduces the major question of what is the favorable angle between these two helices. Therefore, simulation sets were prepared in which the initial angle between the two helices ranged from 45 to 85°. This angle was allowed to vary in the course of the simulation so that Cav182–136 could relax to stable conformations. Fig. 4 A (see Table S1 in the Supporting Material) shows the H1-H2 angle distributions (θ) of all the simulations. What became immediately evident is that 49 of the 50 simulations rested on a θ-value that was <90°. This data shows that the U-shaped conformation of Cav182–136 is stable (at least for the simulation length), and that a linear conformation of the protein is highly unfavorable. When the study was extended to the longer 1-μs simulation, the average θ settled to 53 ± 5° (Fig. 4 A). The persistence of θ over a 1-μs timescale gives credence to the stability of a U-shaped conformation.
Figure 4.
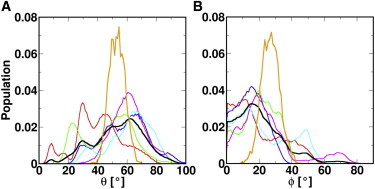
The population distributions of (A) θ and (B) ϕ in all the systems. Different sets of simulations are distinguished by colors: cav1_45 (red); cav1_55 (green); cav1_65 (blue); cav1_75 (magenta); cav1_85 (cyan); and 1-μs simulation results (orange). Averaged distributions from all the 100-ns systems are shown in black. To see this figure in color, go online.
By examining the time evolutions of θ, fluctuations between its upper and lower bounds are frequently seen and they happen on the order of tens of nanoseconds (data not shown). The upper and lower bounds of θ in the 1-μs simulation are 69 and 35°. The oscillations of θ are likely associated with the way lipid molecules pack around Cav182–136. Both lipid tails and headgroups can fill in the space between H1 and H2, especially when θ is >30°. Fig. 5 A is a representative snapshot showing lipid packing between H1 and H2. In total, 34 of the 50 systems had, on average, more than one headgroup or lipid tail intercalated between H1 and H2 during the whole course of the simulation. The change in θ was often accompanied by a corresponding change in the number of lipid tails and/or lipid headgroups in between H1 and H2. It appears that the inserted lipid molecules provide structural support for the U-shaped conformation of Cav182–136 and the lipid molecules can engage into and withdraw from the Cav182–136 structure fairly easily. This interesting finding suggests that lipid interactions are important for maintaining the U-shaped conformation.
Figure 5.
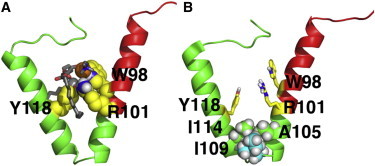
(A) Lipid packing around Cav182–136 and (B) residues forming the H1-H2 interface. The protein is shown as a cartoon representation (green) with the CSD domain (red). Residues that are facing each other and participate in protein-lipid interactions are shown in yellow. Lipid molecule in the space between the H1 and H2 helices are shown in grey. Phosphate atoms are shown as orange spheres. The contacting residues are A105, I109, and I114. The two β-carbon branches of I109 participate in forming the interface. Both snapshots were taken from the 1-μs simulation. To see this figure in color, go online.
Probing the tilt of Cav182–136
Tilting of transmembrane helices within a bilayer is commonly observed and is an interplay between the hydrophobic length of the helix and thickness of the bilayer (63). Cav182–136 presents the interesting case where two hydrophobic sequences are tethered together at the break region. To examine the tilting preferences of such a motif, ϕ-values (defined in Fig. 3) were obtained from the multiple 100-ns simulations, and the average tilt is 21 ± 12° (Fig. 4 B and see Table S1). However, as evident from Fig. 4 B and Table S1, there is a large amount of variance in ϕ-values within and among simulation sets. In contrast, in the longer 1-μs simulation, the range of ϕ-values was greatly reduced and settled on a more discrete distribution with an average tilt of 27 ± 6°. The difference in the ϕ averages between the 100-ns and the 1-μs simulations is likely the result of the relatively short timescale of the multiple MD simulations. The value ϕ is a slow-converging property, and its value depends on the other structural parameters (e.g., θ, linker residue ZCOM, α, and β) as well as the interactions with lipid molecules. It is possible that sampling along such parameter space is insufficient in some of the multiple 100-ns simulations due to different initial Cav182–136 structures and dispositions in membranes. Even so, the ϕ distributions from some of these shorter simulation systems still show significant overlap with that from the 1-μs simulation. The results from the simulations clearly demonstrate that Cav182–136 prefers to be near-vertical in the membrane and is not favoring a surface orientation with ϕ ≈ 90°.
Probing the depth of the linker region of Cav182–136
With the postulation that Cav182–136 contains an unusual intramembrane turn, it is of great interest to determine the depth of this turn in bilayers. The existence of an intramembrane turn is controversial, because this motif is not typically observed for membrane proteins in which N- and C-termini return to the same side of the membrane. Fig. 6 A shows the ZCOM distributions for the three break residues in the multiple 100-ns simulations. The average ZCOM is −5.1 ± 2.9 Å (G108), −5.4 ± 2.5 Å (I109), and −6.3 ± 3.0 Å (P110), respectively. The center of the bilayer is defined as Z = 0, therefore the negative values indicate placement of the break region in the bottom leaflet. Importantly, the range of determined depths was fairly discrete. When the simulation was extended to 1 μs, penetration into the bottom leaflet increased and was accompanied by a significant narrowing of the values to −5.9 ± 1.7 Å (G108), −6.8 ± 1.6 Å (I109), and −9.3 ± 1.3 Å (P110) (Fig. 6 B). This indicates that there is a distinct depth at which Cav182–136 is most stable. Altogether, our analysis shows that the break region of Cav182–136 is buried within the hydrophobic core of the membrane, and the three resides are close to the bottom leaflet lipid headgroups. Therefore, it appears that an intramembrane turn is energetically possible in a bilayer.
Figure 6.
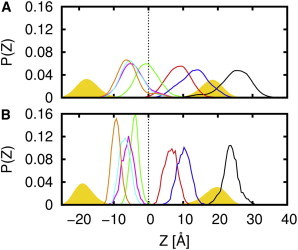
The ZCOM distributions for W85 (black), W98 (red), W115 (green), and W128 (blue), and the break residues G108 (magenta), I109 (cyan), and P110 (orange) in (A) the multiple Cav182–136 systems and (B) the 1-μs simulation. The histograms in panel A are averaged over all 50 multiple simulations. The bilayer center is indicated by dashed black lines. Distribution of lipid phosphate atoms is shown by yellow filled regions. An illustration of the approximate relative positions of these residues on Cav182–136 can be found in Fig. 3B. To see this figure in color, go online.
Probing the depth of the tryptophan residues of Cav182–136
The native tryptophan residues in Cav182–136 can serve as natural reporters of their membrane location by analyzing their fluorescence emission maximum (λmax). In general, the λmax values are divided into three classes: Class I for 330–333 nm, Class II for 340–343 nm, and Class III for 347–350 nm as taken from Burstein et al. (64). Tryptophan residues with λmax in Class I are generally regarded as solvent-inaccessible and are buried in the hydrophobic core of the membrane. Class III λmax value is indicative of a tryptophan residue fully exposed to the aqueous solution. In between these two are the Class II tryptophan residues, which are at the lipid/water interface (headgroup region). As shown in Fig. 7, the λmax values from the fluorescence emission spectra of each tryptophan mutant are 344.4 ± 2.4 nm (W85), 334.4 ± 0.2 nm (W98), 330.2 ± 1.0 nm (W115), and 338.2 ± 0.6 nm (W128). The data indicate that W85 is in between Classes II and III, meaning that it is at the interface between the headgroup region and the bulk water. The λmax value of W98 is between Classes I and II, indicative of a position below the headgroup region. The λmax value of W115 is consistent with Class I, revealing that it has a deep location in the bilayer. In addition, W128 most likely resides at or slightly below the lipid headgroup region according to its λmax value, which is in between Classes I and II.
Figure 7.
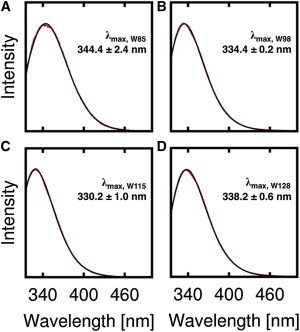
Fluorescence emission spectra of Cav182–136 (A) W85, (B) W98, (C) W115, and (D) W128 in 4.0% (w/w) DMPC/CHAPSO q = 0.5 bicelles; 20 mM phosphate, pH 7.0. To see this figure in color, go online.
Because λmax is related to the degree of exposure to water, the simulations were analyzed to determine the relative percentage of water molecules associated with the indole side chain versus the number of contacts arising from the lipids (i.e., Trp-water/(Trp-water + Trp-lipid)). The percentage values from low to high are 2 ± 4% (W115), 22 ± 10% (W128), 32 ± 22% (W98), and 83 ± 14% (W85) using the trajectories from the multiple MD simulations. These values are comparable to those obtained from the 1-μs simulation (5 ± 10% for W115, 23 ± 18% for W128, 42 ± 16% for W98, and 89 ± 8% for W85). These data also agree very well with the trend observed for λmax and strengthen the conformations, orientations, and dispositions of Cav182–136 (with respect to the bilayer) observed in the simulations. The λmax values were also compared to the ZCOM values of the four tryptophans. The ZCOM distributions of these tryptophan residues are shown in Fig. 6.
The average ZCOM from the multiple 100-ns simulations are 23.4 ± 4.2 Å (W85), 7.5 ± 2.5 Å (W98), −1.1 ± 2.7 Å (W115), and 11.8 ± 2.9 Å (W128). These values are comparable to those observed in the 1-μs simulation, which are 23.7 ± 2.2 Å (W85), 6.5 ± 1.8 Å (W98), −4.0 ± 1.3 Å (W115), and 10.2 ± 2.0 Å (W128). From the examination of Fig. 6, it is clear that W85 resides above the top leaflet headgroup region and is solvent-exposed. With a smaller ZCOM than W85, W128 straddles the interface between the top leaflet headgroup and the beginning of the acyl-chain region. The ZCOM analysis also indicates that both W98 and W115 are less accessible to the aqueous environment as compared to W85 and W128 because of their smaller ZCOM magnitudes. With good agreement between the experimental and simulation trends, it is clear that the simulations are conveying relevant information about the protein’s location within the membrane.
Probing the H1 and H2 rotation angles and interfacial residues
So far, our simulations and experiments have revealed that the U-shaped motif of Cav182–136 is stable within the bilayer. Some of the stabilizing factors that have been identified are the ability of the protein to tilt to the ideal level and the intercalation of lipids in between helices. However, it is important to examine whether there are specific faces of the helices that prefer to interact. The distribution of rotation angles (defined in Fig. 3 A) are shown in Fig. S1 in the Supporting Material as a ρ1, ρ2 cross-plot. All simulations were started with systems that had different (ρ1, ρ2) values. However, during the simulations, a dominant rotation angle pair emerges at (337°, 115°) for the 100-ns simulations and (331°, 124°) for the 1-μs simulation. There is little difference between the short and long simulation sets, indicating that the observed rotation angle is established early in the simulation and is, therefore, highly favorable. The value of ρ1 at 331° translates to a structure where W98, R101, L102, A105, and L106 on H1 are present at the H1-H2 interface (Fig. 5 B). With ρ2 at ∼124°, the I114 and Y118 side chains of H2 are at the H1-H2 interface (Fig. 5 B). Both R101 and Y118 participate in interactions with the lipid headgroups that are inserted between the two helices. In the case of R101, this interaction is primarily electrostatic, whereas for Y118, hydrogen-bonding predominates (Fig. 5 A). These interactions are crucial for maintaining the U-shaped conformation of Cav182–136.
A closer look at the structures with the dominant rotation angle pair reveals that specific van der Waals interactions near and within the break region are critical for Cav182–136 structure. Specifically, interactions between the side chains of A105 and L106 on H1, I109 within the break region, and I114 on H2 are present (Fig. 5 B). Interestingly, A105 and I114 form a favorable interaction with I109 via its two β-carbon branches. This interaction is supported by recent NMR studies that showed the importance of having a β-branched amino acid at position 109 (23). In the outlying simulations where the angle between H1 and H2 (θ) was not within the range of 35–69°, these favorable interactions are lost, indicating that they are critical to the stabilization of the U-shaped conformation.
Probing the orientation of H1 and H2 with respect to the Cav182–136 molecular plane
The overall tilt of Cav182–136 (ϕ) was found to be ∼27°. This tilt angle describes the relative positioning of a plane that contains both H1 and H2 with regard to the membrane normal. However, there is also the possibility of each helix tilting within the molecular plane of Cav182–136. The angles, α (for H1) and β (for H2), characterize this tilting (Fig. 3 B). The distributions of α and β are shown in Fig. S2. The preferred α in almost all of the systems resided between 90 and 120° (e.g., see H1 in Fig. 5 B). This agreed well with the 1-μs simulation, which yielded an α-value of 99°. The β-distributions are similar in all of the systems as well, giving a range of 40–60° for the shorter simulations, and 49° for the 1-μs simulation (e.g., see H2 in Fig. 5 B).
An α-value of ∼90° represents the minimum exposure of H1 to the hydrophobic core of the bilayer at a given ϕ. Examination of the H1 sequence (in Fig. 2) reveals that the residues before L102 are significantly more polar than the residues afterwards (residues 102–107). A greater deviation from ∼90° tilt would require increased burial of these polar residues, which would incur an energetic penalty. On the other hand, H2 deviates dramatically from a 90° orientation. The hydrophobic stretch of H2 is longer than that of H1, so this helix would need to tilt more to bury all of the residues inside the hydrophobic core of the bilayer. Therefore, the α- and β-values of Cav182–136 are mostly dictated by the match between the hydrophobic length of each helix and thickness of the bilayer hydrophobic core.
Probing the membrane perturbation induced by Cav182–136
It is plausible that the U-shaped conformation of caveolin-1 induces local changes in lipid packing that are different than those induced by a typical membrane spanning helix. This effect may have consequences on the mechanism of caveolae formation, although a direct link has not been established. Particularly, the protein is thought to dramatically alter lipid packing in an asymmetric fashion, thus generating significant curvature. Simulations were analyzed to investigate the effect that a single Cav182–136 has on the bilayer thickness proximal to the protein. This is illustrated by the bilayer thickness profile taken from system cav1_65_3 (Fig. 8), in which the Cav182–136 molecule has parameters (θ, ϕ, ZCOM, α, and β) closely aligned with those of the 1-μs simulation. Examination of the profile shows that Cav182–136 significantly thins the bottom leaflet of the membrane (Figs. 8 and 9). In this region, lipid headgroups from the bottom leaflet bend toward the hydrophobic core of the membrane. Transient water-mediated hydrogen bonds among the backbone atoms of F107, G108, L111, and A112 and the lipid headgroups are responsible for the thinning effect.
Figure 8.
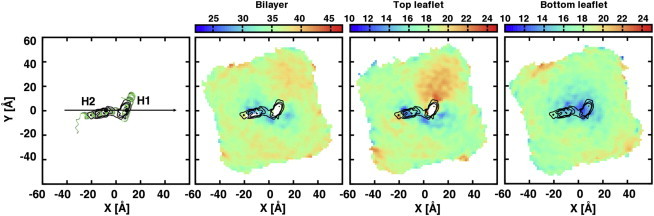
The membrane thickness profiles. Before making the profiles, the caveolin-1 molecules are aligned so that the vector connecting the centers of H2 and H1 coincides with the X axis (H2 on the left). The following plots are the thickness profiles of the bilayer, the top leaflet, and the bottom leaflet, respectively. Results from system cav1_65_3 are shown. To calculate the profile, a two-dimensional grid is placed on the XY plane on top of the protein. For each grid point, the averaged Z positions of the phosphate atoms at the top and bottom leaflets are computed. These Z values represent the thickness of the top and bottom leaflets, respectively. The difference indicates the entire bilayer thickness. (Color scale in the plots goes from blue to red with increasing thickness.) Grid points with no phosphate atom present are excluded from the thickness calculations (black contour lines). Density of the protein is plotted on the XY plane to show the regions of caveolin-1 that are responsible for membrane perturbation. To see this figure in color, go online.
Figure 9.
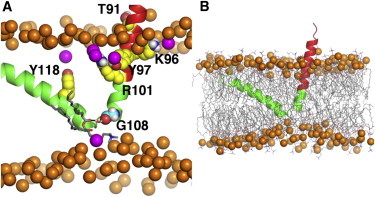
(A) Electrostatic and hydrogen-bonding interactions between caveolin-1 and surrounding lipids. (B) Membrane thinning induced by Cav182–136 insertion. Both snapshots are taken from system cav1_65_3. Cav182–136 is shown in cartoon representation; CSD domain (red). Phosphate atoms in the bulk bilayer are shown as orange spheres and phosphate atoms that are within 4.5 Å to the protein are shown in magenta. The polar and charged residues from the CSD domain (T91, K96, Y97, and R101 shown in yellow) form interactions with the lipids in the top leaflet. A water-bridged hydrogen bond between the backbone atoms of G108 (cyan spheres) and a lipid headgroup in the bottom leaflet is also shown. To see this figure in color, go online.
The interactions that cause membrane thinning may also be responsible for the observed preference of the tilt angle of the Cav182–136 molecular plane (ϕ) (Fig. 4 B). Water-mediated hydrogen bonds between particular residues within and around the break region and the bottom leaflet headgroups are especially pronounced in systems having a ϕ-value in line with the 1-μs simulation. To illustrate this point, we calculated and compared the average numbers of water-bridged hydrogen bonds, i.e., the hydrogen-bond occupancies (Q), for these residues in various systems. In this study, an H-bond (D−H∙∙∙A) is defined by an H∙∙∙A distance <2.4 Å and a D−H∙∙∙A angle >120°. Q is calculated as the ratio between the time duration when a hydrogen bond is formed and the total simulation time. For example, in the system cav_65_3, where Cav182–136 has a ϕ-value similar to that of the 1-μs simulation, the Q values for G108, L111, and A112 are 0.2, 0.2, and 0.4, respectively. However, when ϕ increases beyond the range observed in the 1-μs simulation (i.e., >33°), these hydrogen bonds are lost. For example, in the system cav1_85_8 with a ϕ = 46 ± 6°, the Q values for F107, G108, L111, and A112 are all zero.
Importantly, only three of the 50 simulations showed ϕ-values that were >33°, supporting that the water-mediated hydrogen bonds are critical for stable Cav182–136 insertion. Note that initially the break residues of these systems were randomly placed far from the bottom leaflets’ water-lipid interface, revealing that this interaction is real and is not due to a serendipitous positioning of the break residues close to the interface. It is also worth mentioning that these hydrogen-bonding interactions are possible, even though the average ZCOM of the linker residues is above the average Z-position of the phosphocholine headgroups in the bottom leaflet, as indicated in Fig. 6. This occurs because the membrane-embedded Cav182–136 introduces thinning of the surrounding bottom lipid leaflet, as discussed above. As opposed to the hydrogen-bonded polar backbone atoms of a helix, which are shielded from the hydrophobic core of the membrane by the side chains, the region in and around the break could potentially have backbone atoms that are exposed. By tying up the residues in this region with water-mediated hydrogen bonds to the lipid headgroups, the energetic penalty of exposing these atoms to the hydrophobic core is reduced.
On the other hand, although some perturbations are seen in the top leaflet, the changes are much less significant (Fig. 8). Electrostatic and hydrogen-bonding interactions are observed between residues in the middle of H1 and H2 (R101 and Y118) and the lipid headgroups (Fig. 9 A). In addition, residues at the beginning of H1 (K86, S88, and T91) are also involved in electrostatic and hydrogen-bonding interactions with the headgroups. In some cases, these interactions cause local membrane thinning, whereas in others, they appear to cause a thickness increase. However, the fact that the construct is truncated at the beginning of H1 and at the end of H2 cautions against drawing definitive conclusions about membrane deformation effects at the termini.
Summary and Conclusions
The caveolin protein family is indispensable for caveolae formation and their malfunction can lead to severe disease conditions. Because of its role as the principal component of caveolae, the structure and function of caveolin has been under investigation by researchers for years. Our results show that Cav182–136 prefers to adopt a slightly dynamic U-shaped conformation in a lipid bilayer. This is a very important finding in that it demonstrates that caveolin-1 does not prefer to be a single spanning transmembrane protein nor is it an extended peripheral membrane protein that lies on the surface of the bilayer, as these would require the H1-H2 angles to be >90°. Importantly, the backbone atoms of the break residues (G108–P110) exist within the hydrophobic core of the membrane and are stabilized by water-mediated hydrogen bonds with the bottom leaflet headgroups. The depth of Cav182–136 in the bilayer is strongly supported by tryptophan fluorescence experiments. The structural analyses reveal that a specific H1-H2 packing is predominant. This packing allows for electrostatic interactions and hydrogen-bonding between side chains and the lipids inserted between the helices.
It is important to note that the insertion of lipids between the two helices appears to play a key role in the stabilization of the U-shaped conformation. In addition, residues in and around the break region participate in van der Waals interactions that are critical to upholding the U-shaped motif. These residues also cause local membrane thinning of the bottom leaflet and this thinning may be associated with caveolin’s purported membrane curving ability. However, the membrane thickening and thinning effects as well as the caveolin structural parameters (θ, ϕ, ZCOM, ρ1, ρ2, α, and β) observed in the current simulations in DMPC bilayers could be modified by the lipid composition (including the presence of cholesterol), a full-length construct, and multiple caveolin proteins; studies are underway to investigate systems that will address these issues. Perhaps then, stronger conclusions pertaining to the caveolin curvature-generating mechanism can be made. Overall, this study provides significant enhancements to caveolin-1 structural models, and strongly supports the postulation that caveolin-1 adopts an intramembrane U-shaped turn.
Acknowledgments
J. L. and K.J.G. acknowledge Dr. Tian and Penn State Hershey for useful discussion and generous use of their NMR facilities.
This work was supported in part by the National Science Foundation (NSF grant No. MCB-1157677 to W.I.), XSEDE resources provided by Purdue University (grant No. TV-MCB070009 to W.I.) and the National Institution of Health (grant No. NIH-R01 GM093258-03 to K.J.G). Anton computer time was provided by the National Center for Multiscale Modeling of Biological Systems (MMBioS) through grant P41GM103712-S1 from the National Institutes of Health and the Pittsburgh Supercomputing Center (PSC). The Anton machine at PSC was generously made available by D.E. Shaw Research.
Footnotes
Huan Rui and Kyle T. Root contributed equally to this work.
Contributor Information
Kerney Jebrell Glover, Email: kjg206@lehigh.edu.
Wonpil Im, Email: wonpil@ku.edu.
Supporting Material
References
- 1.Parton R.G., Simons K. The multiple faces of caveolae. Nat. Rev. Mol. Cell Biol. 2007;8:185–194. doi: 10.1038/nrm2122. [DOI] [PubMed] [Google Scholar]
- 2.Anderson R.G. The caveolae membrane system. Annu. Rev. Biochem. 1998;67:199–225. doi: 10.1146/annurev.biochem.67.1.199. [DOI] [PubMed] [Google Scholar]
- 3.Parton R.G., del Pozo M.A. Caveolae as plasma membrane sensors, protectors and organizers. Nat. Rev. Mol. Cell Biol. 2013;14:98–112. doi: 10.1038/nrm3512. [DOI] [PubMed] [Google Scholar]
- 4.Krajewska W.M., Masłowska I. Caveolins: structure and function in signal transduction. Cell. Mol. Biol. Lett. 2004;9:195–220. [PubMed] [Google Scholar]
- 5.Williams T.M., Lisanti M.P. The caveolin genes: from cell biology to medicine. Ann. Med. 2004;36:584–595. doi: 10.1080/07853890410018899. [DOI] [PubMed] [Google Scholar]
- 6.Fielding C.J., Fielding P.E. Caveolae and intracellular trafficking of cholesterol. Adv. Drug Deliv. Rev. 2001;49:251–264. doi: 10.1016/s0169-409x(01)00140-5. [DOI] [PubMed] [Google Scholar]
- 7.Fujimoto T. Calcium pump of the plasma membrane is localized in caveolae. J. Cell Biol. 1993;120:1147–1157. doi: 10.1083/jcb.120.5.1147. [DOI] [PMC free article] [PubMed] [Google Scholar]
- 8.Le P.U., Guay G., Nabi I.R. Caveolin-1 is a negative regulator of caveolae-mediated endocytosis to the endoplasmic reticulum. J. Biol. Chem. 2002;277:3371–3379. doi: 10.1074/jbc.M111240200. [DOI] [PubMed] [Google Scholar]
- 9.Liu P., Rudick M., Anderson R.G. Multiple functions of caveolin-1. J. Biol. Chem. 2002;277:41295–41298. doi: 10.1074/jbc.R200020200. [DOI] [PubMed] [Google Scholar]
- 10.Ahn M., Kim H., Shin T. Increased expression of caveolin-1 and -2 in the hearts of Lewis rats with experimental autoimmune myocarditis. Autoimmunity. 2006;39:489–495. doi: 10.1080/08916930600929321. [DOI] [PubMed] [Google Scholar]
- 11.Bonuccelli G., Casimiro M.C., Lisanti M.P. Caveolin-1 (P132L), a common breast cancer mutation, confers mammary cell invasiveness and defines a novel stem cell/metastasis-associated gene signature. Am. J. Pathol. 2009;174:1650–1662. doi: 10.2353/ajpath.2009.080648. [DOI] [PMC free article] [PubMed] [Google Scholar]
- 12.Gaudreault S.B., Dea D., Poirier J. Increased caveolin-1 expression in Alzheimer’s disease brain. Neurobiol. Aging. 2004;25:753–759. doi: 10.1016/j.neurobiolaging.2003.07.004. [DOI] [PubMed] [Google Scholar]
- 13.Shatz M., Liscovitch M. Caveolin-1: a tumor-promoting role in human cancer. Int. J. Radiat. Biol. 2008;84:177–189. doi: 10.1080/09553000701745293. [DOI] [PubMed] [Google Scholar]
- 14.Drab M., Verkade P., Kurzchalia T.V. Loss of caveolae, vascular dysfunction, and pulmonary defects in caveolin-1 gene-disrupted mice. Science. 2001;293:2449–2452. doi: 10.1126/science.1062688. [DOI] [PubMed] [Google Scholar]
- 15.Fra A.M., Williamson E., Parton R.G. De novo formation of caveolae in lymphocytes by expression of VIP21-caveolin. Proc. Natl. Acad. Sci. USA. 1995;92:8655–8659. doi: 10.1073/pnas.92.19.8655. [DOI] [PMC free article] [PubMed] [Google Scholar]
- 16.Dupree P., Parton R.G., Simons K. Caveolae and sorting in the trans-Golgi network of epithelial cells. EMBO J. 1993;12:1597–1605. doi: 10.1002/j.1460-2075.1993.tb05804.x. [DOI] [PMC free article] [PubMed] [Google Scholar]
- 17.Monier S., Parton R.G., Kurzchalia T.V. VIP21-caveolin, a membrane protein constituent of the caveolar coat, oligomerizes in vivo and in vitro. Mol. Biol. Cell. 1995;6:911–927. doi: 10.1091/mbc.6.7.911. [DOI] [PMC free article] [PubMed] [Google Scholar]
- 18.Fernandez I., Ying Y., Anderson R.G. Mechanism of caveolin filament assembly. Proc. Natl. Acad. Sci. USA. 2002;99:11193–11198. doi: 10.1073/pnas.172196599. [DOI] [PMC free article] [PubMed] [Google Scholar]
- 19.Schlegel A., Schwab R.B., Lisanti M.P. A role for the caveolin scaffolding domain in mediating the membrane attachment of caveolin-1. The caveolin scaffolding domain is both necessary and sufficient for membrane binding in vitro. J. Biol. Chem. 1999;274:22660–22667. doi: 10.1074/jbc.274.32.22660. [DOI] [PubMed] [Google Scholar]
- 20.Couet J., Li S., Lisanti M.P. Identification of peptide and protein ligands for the caveolin-scaffolding domain. Implications for the interaction of caveolin with caveolae-associated proteins. J. Biol. Chem. 1997;272:6525–6533. doi: 10.1074/jbc.272.10.6525. [DOI] [PubMed] [Google Scholar]
- 21.Dietzen D.J., Hastings W.R., Lublin D.M. Caveolin is palmitoylated on multiple cysteine residues. Palmitoylation is not necessary for localization of caveolin to caveolae. J. Biol. Chem. 1995;270:6838–6842. doi: 10.1074/jbc.270.12.6838. [DOI] [PubMed] [Google Scholar]
- 22.Sargiacomo M., Scherer P.E., Lisanti M.P. Oligomeric structure of caveolin: implications for caveolae membrane organization. Proc. Natl. Acad. Sci. USA. 1995;92:9407–9411. doi: 10.1073/pnas.92.20.9407. [DOI] [PMC free article] [PubMed] [Google Scholar]
- 23.Lee J., Glover K.J. The transmembrane domain of caveolin-1 exhibits a helix-break-helix structure. Biochim. Biophys. Acta. 2012;1818:1158–1164. doi: 10.1016/j.bbamem.2011.12.033. [DOI] [PMC free article] [PubMed] [Google Scholar]
- 24.Wishart D.S., Sykes B.D. The 13C chemical-shift index: a simple method for the identification of protein secondary structure using 13C chemical-shift data. J. Biomol. NMR. 1994;4:171–180. doi: 10.1007/BF00175245. [DOI] [PubMed] [Google Scholar]
- 25.Truhlar S.M., Cervantes C.F., Komives E.A. Rapid mass spectrometric analysis of 15N-Leu incorporation fidelity during preparation of specifically labeled NMR samples. Protein Sci. 2008;17:1636–1639. doi: 10.1110/ps.036418.108. [DOI] [PMC free article] [PubMed] [Google Scholar]
- 26.Pervushin K., Riek R., Wüthrich K. Attenuated T2 relaxation by mutual cancellation of dipole-dipole coupling and chemical shift anisotropy indicates an avenue to NMR structures of very large biological macromolecules in solution. Proc. Natl. Acad. Sci. USA. 1997;94:12366–12371. doi: 10.1073/pnas.94.23.12366. [DOI] [PMC free article] [PubMed] [Google Scholar]
- 27.Salzmann M., Pervushin K., Wüthrich K. TROSY in triple-resonance experiments: new perspectives for sequential NMR assignment of large proteins. Proc. Natl. Acad. Sci. USA. 1998;95:13585–13590. doi: 10.1073/pnas.95.23.13585. [DOI] [PMC free article] [PubMed] [Google Scholar]
- 28.Kay L.E., Ikura M., Bax A. 3-dimensional triple-resonance NMR-spectroscopy of isotopically enriched proteins. J. Magn. Reson. 1990;89:496–514. doi: 10.1016/j.jmr.2011.09.004. [DOI] [PubMed] [Google Scholar]
- 29.Grzesiek S., Bax A. An efficient experiment for sequential backbone assignment of medium-sized isotopically enriched proteins. J. Magn. Reson. 1992;99:201–207. [Google Scholar]
- 30.Bax A., Ikura M. An efficient 3D NMR technique for correlating the proton and 15N backbone amide resonances with the α-carbon of the preceding residue in uniformly 15N/13C enriched proteins. J. Biomol. NMR. 1991;1:99–104. doi: 10.1007/BF01874573. [DOI] [PubMed] [Google Scholar]
- 31.Grzesiek S., Bax A. Improved 3D triple-resonance NMR techniques applied to a 31 kDa protein. J. Magn. Reson. 1992;96:432–440. [Google Scholar]
- 32.Delaglio F., Grzesiek S., Bax A. NMRPIPE: a multidimensional spectral processing system based on UNIX pipes. J. Biomol. NMR. 1995;6:277–293. doi: 10.1007/BF00197809. [DOI] [PubMed] [Google Scholar]
- 33.Goddard T.D., Kneller D.G. University of California; San Francisco, CA: 2004. SPARKY 3. [Google Scholar]
- 34.Diefenderfer C., Lee J., Glover K.J. Reliable expression and purification of highly insoluble transmembrane domains. Anal. Biochem. 2009;384:274–278. doi: 10.1016/j.ab.2008.09.038. [DOI] [PubMed] [Google Scholar]
- 35.Glover K.J., Whiles J.A., Vold R.R. Structural evaluation of phospholipid bicelles for solution-state studies of membrane-associated biomolecules. Biophys. J. 2001;81:2163–2171. doi: 10.1016/s0006-3495(01)75864-x. [DOI] [PMC free article] [PubMed] [Google Scholar]
- 36.Lakowicz J.R. Springer; New York, NY: 2006. Principles of Fluorescence Spectroscopy. [Google Scholar]
- 37.Ladokhin A.S., Jayasinghe S., White S.H. How to measure and analyze tryptophan fluorescence in membranes properly, and why bother? Anal. Biochem. 2000;285:235–245. doi: 10.1006/abio.2000.4773. [DOI] [PubMed] [Google Scholar]
- 38.Brooks B.R., Brooks C.L., III, Karplus M. CHARMM: the biomolecular simulation program. J. Comput. Chem. 2009;30:1545–1614. doi: 10.1002/jcc.21287. [DOI] [PMC free article] [PubMed] [Google Scholar]
- 39.Jo S., Kim T., Im W. Automated builder and database of protein/membrane complexes for molecular dynamics simulations. PLoS ONE. 2007;2:e880. doi: 10.1371/journal.pone.0000880. [DOI] [PMC free article] [PubMed] [Google Scholar]
- 40.Jo S., Lim J.B., Im W. CHARMM-GUI Membrane Builder for mixed bilayers and its application to yeast membranes. Biophys. J. 2009;97:50–58. doi: 10.1016/j.bpj.2009.04.013. [DOI] [PMC free article] [PubMed] [Google Scholar]
- 41.Jo S., Kim T., Im W. Software news and updates—CHARNIM-GUI: a web-based graphical user interface for CHARMM. J. Comput. Chem. 2008;29:1859–1865. doi: 10.1002/jcc.20945. [DOI] [PubMed] [Google Scholar]
- 42.Feller S.E., Zhang Y.H., Brooks B.R. Constant pressure molecular dynamics simulation—the Langevin piston method. J. Chem. Phys. 1995;103:4613–4621. [Google Scholar]
- 43.Hoover W.G. Canonical dynamics: equilibrium phase-space distributions. Phys. Rev. A. 1985;31:1695–1697. doi: 10.1103/physreva.31.1695. [DOI] [PubMed] [Google Scholar]
- 44.Nose S., Klein M.L. Constant pressure molecular dynamics for molecular systems. Mol. Phys. 1983;50:1055–1076. [Google Scholar]
- 45.MacKerell A.D., Bashford D., Karplus M. All-atom empirical potential for molecular modeling and dynamics studies of proteins. J. Phys. Chem. B. 1998;102:3586–3616. doi: 10.1021/jp973084f. [DOI] [PubMed] [Google Scholar]
- 46.MacKerell A.D., Jr., Feig M., Brooks C.L., 3rd Extending the treatment of backbone energetics in protein force fields: limitations of gas-phase quantum mechanics in reproducing protein conformational distributions in molecular dynamics simulations. J. Comput. Chem. 2004;25:1400–1415. doi: 10.1002/jcc.20065. [DOI] [PubMed] [Google Scholar]
- 47.Best R.B., Buchete N.V., Hummer G. Are current molecular dynamics force fields too helical? Biophys. J. 2008;95:L07–L09. doi: 10.1529/biophysj.108.132696. [DOI] [PMC free article] [PubMed] [Google Scholar]
- 48.Cino E.A., Choy W.Y., Karttunen M. Comparison of secondary structure formation using 10 different force fields in microsecond molecular dynamics simulations. J. Chem. Theory Comput. 2012;8:2725–2740. doi: 10.1021/ct300323g. [DOI] [PMC free article] [PubMed] [Google Scholar]
- 49.Piana S., Lindorff-Larsen K., Shaw D.E. How robust are protein folding simulations with respect to force field parameterization? Biophys. J. 2011;100:L47–L49. doi: 10.1016/j.bpj.2011.03.051. [DOI] [PMC free article] [PubMed] [Google Scholar]
- 50.Klauda J.B., Venable R.M., Pastor R.W. Update of the CHARMM all-atom additive force field for lipids: validation on six lipid types. J. Phys. Chem. B. 2010;114:7830–7843. doi: 10.1021/jp101759q. [DOI] [PMC free article] [PubMed] [Google Scholar]
- 51.Jorgensen W.L., Chandrasekhar J., Klein M.L. Comparison of simple potential functions for simulating liquid water. J. Chem. Phys. 1983;79:926–935. [Google Scholar]
- 52.Ryckaert J.P., Ciccotti G., Berendsen H.J.C. Numerical integration of the Cartesian equations of motion of a system with constraints: molecular dynamics of n-alkanes. J. Comp. Phys. 1977;23:327–341. [Google Scholar]
- 53.Dolan E.A., Venable R.M., Brooks B.R. Simulations of membranes and other interfacial systems using P21 and Pc periodic boundary conditions. Biophys. J. 2002;82:2317–2325. doi: 10.1016/S0006-3495(02)75577-X. [DOI] [PMC free article] [PubMed] [Google Scholar]
- 54.Steinbach P.J., Brooks B.R. New spherical-cutoff methods for long-range forces in macromolecular simulation. J. Comput. Chem. 1994;15:667–683. [Google Scholar]
- 55.Essmann U., Perera L., Pedersen L.G. A smooth particle mesh Ewald method. J. Chem. Phys. 1995;103:8577–8593. [Google Scholar]
- 56.Shaw, D. E., R. O. Dror, …, K. J. Bowers. 2009. Millisecond-scale molecular dynamics simulations on Anton. In Proceedings of the Conference on High Performance Computing Networking, Storage and Analysis. ACM, New York, NY. 39.
- 57.Martyna G.J., Klein M.L., Tuckerman M. Nosé-Hoover chains—the canonical ensemble via continuous dynamics. J. Chem. Phys. 1992;97:2635–2643. [Google Scholar]
- 58.Krautler V., van Gunsteren W.F., Hunenberger P.H. A fast SHAKE: algorithm to solve distance constraint equations for small molecules in molecular dynamics simulations. J. Comput. Chem. 2001;22:501–508. [Google Scholar]
- 59.Shan Y.B., Klepeis J.L., Shaw D.E. Gaussian split Ewald: a fast Ewald mesh method for molecular simulation. J. Chem. Phys. 2005;122:54101. doi: 10.1063/1.1839571. [DOI] [PubMed] [Google Scholar]
- 60.Tuckerman M., Berne B.J., Martyna G.J. Reversible multiple time scale molecular-dynamics. J. Chem. Phys. 1992;97:1990–2001. [Google Scholar]
- 61.Shen Y., Delaglio F., Bax A. TALOS+: a hybrid method for predicting protein backbone torsion angles from NMR chemical shifts. J. Biomol. NMR. 2009;44:213–223. doi: 10.1007/s10858-009-9333-z. [DOI] [PMC free article] [PubMed] [Google Scholar]
- 62.Parton R.G., Hanzal-Bayer M., Hancock J.F. Biogenesis of caveolae: a structural model for caveolin-induced domain formation. J. Cell Sci. 2006;119:787–796. doi: 10.1242/jcs.02853. [DOI] [PubMed] [Google Scholar]
- 63.Kim T., Im W. Revisiting hydrophobic mismatch with free energy simulation studies of transmembrane helix tilt and rotation. Biophys. J. 2010;99:175–183. doi: 10.1016/j.bpj.2010.04.015. [DOI] [PMC free article] [PubMed] [Google Scholar]
- 64.Burstein E.A., Vedenkina N.S., Ivkova M.N. Fluorescence and the location of tryptophan residues in protein molecules. Photochem. Photobiol. 1973;18:263–279. doi: 10.1111/j.1751-1097.1973.tb06422.x. [DOI] [PubMed] [Google Scholar]
Associated Data
This section collects any data citations, data availability statements, or supplementary materials included in this article.