

Abstract
The mechanical stimulation of the outer hair cell hair bundle (HB) is a key step in nonlinear cochlear amplification. We show how two-tone suppression (TTS), a hallmark of cochlear nonlinearity, can be used as an indirect measure of HB stimulation. Using two different nonlinear computational models of the cochlea, we investigate the effect of altering the mechanical load applied by the tectorial membrane (TM) on the outer hair cell HB. In the first model (TM-A model), the TM is attached to the spiral limbus (as in wild-type animals); in the second model (TM-D model), the TM is detached from the spiral limbus (mimicking the cochlea of OtoaEGFP/EGFP mutant mice). As in recent experiments, model simulations demonstrate that the absence of the TM attachment does not preclude cochlear amplification. However, detaching the TM alters the mechanical load applied by the TM on the HB at low frequencies and therefore affects TTS by low-frequency suppressors. For low-frequency suppressors, the suppression threshold obtained with the TM-A model corresponds to a constant suppressor displacement on the basilar membrane (as in experiments with wild-type animals), whereas it corresponds to a constant suppressor velocity with the TM-D model. The predictions with the TM-D model could be tested by measuring TTS on the basilar membrane of the OtoaEGFP/EGFP mice to improve our understanding of the fundamental workings of the cochlea.
Introduction
The mammalian cochlea is a nonlinear sound-processing system that has a large dynamic range as well as high sensitivity and sharp tuning in response to low-level signals (1). These characteristics, essential for normal hearing, are due to the presence of an active mechanism called the cochlear amplifier that is linked to outer hair cell (OHC) activity (2). In response to sounds, the basilar membrane (BM) vibrates due to the intracochlear fluid pressure. The hair bundle (HB) of the OHC (see Fig. 1 B) is deflected by the relative motion between the reticular lamina (RL) and the tectorial membrane (TM) (3). This deflection opens mechanoelectrical transduction (MET) channels (4) and depolarizes the main body of the OHC. Due to the depolarization, the OHC develops voltage-dependent forces (5) that are hypothesized to amplify the response of the BM to low-level sounds (2). The fluid motion in the gap between the reticular lamina and the TM caused by the vibrations of the organ of Corti is sensed by the freestanding HB of the inner hair cells (IHCs). Because of the tuned and spatially graded electromechanical properties, each location along the cochlear spiral responds best in a narrow band of frequencies centered around the characteristic frequency (CF) for that location. Although the nonlinear responses of the cochlea to sounds are well-known hallmarks of healthy hearing, the role of the different components of the cochlea in nonlinear cochlear amplification is still poorly understood. In addition to the BM measurements, the vibrations of the RL have been recently measured due to the development of new experimental techniques (6). However, directly measuring the OHC HB deflection in vivo is still an unsolved challenge. Because of the critical role of OHC HBs in cochlear amplification, strategies that allow the evaluation of the deflection of the OHC HB are still needed to improve our understanding of cochlear mechanics.
Figure 1.

(A) Schematic of the box model of the cochlea, with the two main fluid-filled ducts separated by the BM. (B) Schematic of a cross section of the organ of Corti. The TM is attached to the spiral limbus (SL) and to the HBs of the OHCs. (C) Spatial plot of TTS, for kHz and kHz. x represents the distance from the base of the cochlea. Close to the probe BP (vertical dash-dotted line), the suppressor reduces the response of the BM at the probe frequency. To see this figure in color, go online.
The TM is directly connected to the HB of the OHC (see Fig. 1 B). Because of this connection, it has been hypothesized that the TM plays an essential role in hearing (reviewed in Lukashkin et al. (7)). Zwislocki (8–10) proposed that the TM is a resonant mass with a resonant frequency set by its mass, as well as by the stiffness of the OHC HB and the TM attachment to the spiral limbus. A resonant motion of the TM has been observed by Gummer et al. (11). Measurements in mutant mice with a TM detached from the organ of Corti suggest that the mechanical load applied by the TM on the OHC HB is critical for cochlear amplification (12). Moreover, experimental (13–15) and theoretical (16) works have shown that the longitudinal viscoelasticity of the TM might play an important role in frequency tuning in the cochlea. It has also been proposed that the TM resonance underlies the observations of a notch in neural tuning curves (10) and neural-suppression tuning curves (17). Recent measurements of the BM response to sounds and of auditory nerve masking tuning curves (18) in the cochlea of EGFP knock-in, otoancorin knock-out (OtoaEGFP/EGFP) mice have shown that although the attachment of the TM to the spiral limbus is not critical for cochlear amplification, it plays a critical role in IHC stimulation.
Suppression is a salient cochlear nonlinearity with mechanical (19), neural (20), and psychoacoustic correlates (21). One way to controllably study suppression is through a protocol known as two-tone suppression (TTS). In TTS, a primary or probe tone stimulating the cochlea at a frequency interacts with a second or suppressor tone of frequency . When is close to the CF of the measurement location, the response of the cochlea at the probe frequency is reduced by the presence of the suppressor (see Fig. 1 C). TTS has been observed in OHC and IHC receptor potentials (22,23) and on the BM (19,23–27). Computational models have demonstrated that TTS can arise from the saturation of the cochlear amplifier (28–31). Because TTS is intimately linked to OHC activity and MET channel nonlinearity (32), it provides insight into the fundamental workings of the cochlea. In particular, we demonstrate in this article that extensive recordings of TTS over a broad range of frequencies are indirect measures of the magnitude and phase of the OHC HB deflection relative to the BM deformation. Using our previously developed nonlinear computational model of the cochlea (33), we show that altering the mechanical load applied by the TM on the HB by detaching the TM from the spiral limbus (such as in the OtoaEGFP/EGFP mutant mice) significantly affects the HB deflection and TTS on the BM. These theoretical predictions could be tested by measuring TTS in OtoaEGFP/EGFP mutant mice to further improve our understanding of cochlear mechanics.
Materials and Methods
The computational framework used for this theoretical study has been described previously (33) and is summarized in the Supporting Material. The model couples nonlinear MET channels with OHC somatic electromotility. As in our previous model (33), the only nonlinear term in the model is due to the MET channel. The MET conductance is assumed to be a Boltzmann function of the HB rotation relative to the RL, :
| (1) |
where is the saturating conductance of the MET channel, is the length of the HB and and are constants (see our previous work (33)). The OHC soma is modeled by linearized piezoelectric relationships (see our previous work (33) and the Supporting Material).
To investigate the effect of the TM attachment to the spiral limbus, we simulate the response of the cochlea to a pure tone and a two-tone stimulus using two computational models, 1), the TM-attached (TM-A) model (see Fig. 2 A), which is the cochlear model with the TM attached to the spiral limbus; and 2), the TM-detached (TM-D) model (see Fig. 2 B), which is the cochlear model with a detached TM.
Figure 2.

Cross sections of the two micromechanical models of the organ of Corti analyzed in this study. In each model, there are three structural degrees of freedom at each cross section: one for the BM and two for the TM (in the shearing direction, , and the bending direction, ). (A) TM-A model. The TM is attached to the SL by a linear spring in the shearing direction and a rotational spring in the bending direction . (B) TM-D model. The TM is detached from the SL, as in the OtoaEGFP/EGFP mutant mice (18), by setting . To see this figure in color, go online.
The TM-A model corresponds to the cochlea of a wild-type animal, whereas the TM-D model mimics the effect of the Otoa genetic mutation (18). In both models, the TM deforms in the shearing and bending directions. The shearing and bending mass, and , as well as the damping coefficients of the two TM modes, and , are assumed to be the same in the TM-D model as in the TM-A model. In the TM-D model, the electromechanical coupling coefficient of the OHC soma, designated as (a parameter that controls the activity of the model; see the Supporting Material), is set to 79% of the value used in the TM-A model to predict the same gain on the BM in response to high-frequency, low-intensity sounds.
Results
Both models predict a realistic response of the BM to a pure tone
We present the frequency response of the BM at the 17 kHz best place (BP) in Fig. 3, A and B, for the TM-A and TM-D models, respectively. Note that the 17 kHz BP of the TM-D model is shifted by ∼300 μm toward the base compared to the BP of the TM-A model for the same CF (vertical dashed line). At the same location, the difference between the CF values is ∼1.3 kHz, or 8%. At the 17 kHz BP for each model, the responses obtained with the two models are similar. The tuning is slightly sharper with the TM-A model than with the TM-D model (with a quality factor, , of 5.7 with the TM-A model and 5.3 with the TM-D model for a 20 dB sound pressure level (SPL) pure tone).
Figure 3.

Both the TM-A and TM-D models predict a realistic BM displacement in response to a single tone at a basal location. The normalized BM displacement, in dB, is plotted as function of frequency for stimulus amplitudes of 20–100 dB SPL, at the 17 kHz BP of the TM-A model (A) and the TM-D model (B). CF is indicated by the vertical dashed line. To see this figure in color, go online.
The frequency dependence of the HB deflection depends on the attachment of the TM to the spiral limbus
Because the MET conductance is a nonlinear function of the HB rotation relative to the RL, (see Eq. 1), the magnitude and phase of at the suppressor and probe frequencies influence the characteristics of TTS. The HB deflection was computed at the 17 kHz BP with the TM-A and TM-D models at 0 dB SPL. The ratio of the magnitude of the HB displacement (, where is the length of the HB) to the magnitude of the BM displacement is plotted as a function of frequency in Fig. 4 A. For the TM-A model, this ratio is approximately independent of frequency below 8 kHz and exhibits a notch at ∼10.5 kHz. This frequency corresponds approximately to the resonant frequency of the uncoupled TM shear mass, given by , where is the stiffness of the attachment of the TM to the spiral limbus and is the TM shear mass (see the Supporting Material). In the TM-D model, the ratio decreases at a rate of ∼6 dB per octave below 8 kHz and no notch is apparent. As is reduced, the phase of the HB deflection relative to the BM displacement approaches 0° in the TM-A model, whereas it approaches 90° in the TM-D model (Fig. 4 B). Hence, at low frequencies, the HB deflection is proportional to the BM displacement in the TM-A model, whereas it is proportional to the BM velocity in the TM-D model.
Figure 4.

Magnitude (A) and phase (B) of the HB deflection, , relative to the BM displacement , as a function of the frequency, F, at the 17 kHz BP. The CF, 17 kHz, is indicated by a vertical dashed line; the resonant frequency of the uncoupled TM in shear in the TM-A model is indicated by a vertical dash-dotted line. At low frequencies, the HB deflection is proportional to the BM displacement in the TM-A model and to the HB velocity in the TM-D model. To see this figure in color, go online.
Only the TM-A model predicts TTS by low-frequency suppressors
The frequency dependence of TTS is analyzed in Fig. 5, where the frequency of the suppressor is varied from 0.5 to 25 kHz and the frequency of the probe is fixed at 17 kHz. Both models replicate some of the experimental observations regarding the frequency dependence of TTS (27). At low levels of the suppressor, suppression occurs only for frequencies close to 17 kHz. At higher suppressor intensities, suppression is seen over a broader range of frequencies. In the case of high side suppressors (i.e., ), suppression extends up to about half an octave above the probe frequency. In the case of low side suppressors (i.e., ), suppression is seen over a broader range of suppressor frequencies.
Figure 5.
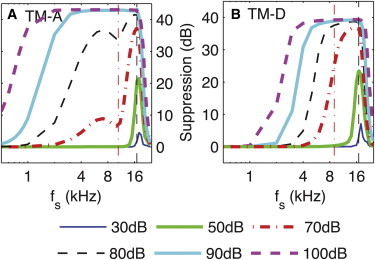
Dependence of TTS on the frequency of the suppressor, . (A) TM-A model. (B) TM-D model. For both models, the results are plotted at the 17 kHz BP. The frequency of the probe tone, , is 17 kHz (vertical dashed line). The probe level is fixed at 30 dB SPL. The suppression in the BM displacement is plotted as a function of . The TM attachment does not affect TTS significantly for kHz. However, it has an effect on TTS by low-frequency suppressors. In particular, suppression by suppressors <1 kHz requires a stiff attachment. The vertical dash-dotted line corresponds to . In A, there is a notch around in the curves for = 70 and 80 dB. This notch is not seen in B. To see this figure in color, go online.
Despite some common features, there are some dramatic differences between the predictions of the two models for low-frequency suppressors (i.e., ). A low-frequency suppressor (such as = 0.5 kHz) decreases the response of the BM to the probe tone with the TM-A model (as observed in experiments (25–27)), whereas the TM-D model does not make such a prediction. Moreover, in the case of the TM-A model, the TTS frequency response curves exhibit two regions of approximately constant slope for moderate suppressor intensities (70 and 80 dB SPL), separated by a notch for ; no notch is predicted by the TM-D model.
The TM attachment affects the suppression threshold at low frequencies
The level of the suppressor required to suppress by 1 dB the BM response to a probe tone of fixed input frequency and SPL (i.e., a suppression threshold) is plotted as a function of in Fig. 6, A and B, for the TM-A and TM-D models, respectively. For each model, there is a sharp minimum in the suppression threshold slightly above the CF. These sharp minima are 20 dB SPL with the TM-A model and 16 dB SPL with the TM-D model. Similar minima are seen in experiments with wild-type animals (25,27).
Figure 6.

Suppression and single-tone thresholds. (A and B) Suppression tuning curve and single-tone tuning curve for TM-A and TM-D models, respectively. The SPL of the suppressor required to suppress the response of the BM to the probe tone by 1 dB is plotted as a function of frequency for a 10 dB and 60 dB SPL probe tone. The suppression thresholds are compared to single-tone isoresponse functions (dashed lines) (in A, the SPL required to evoke a 1.5 nm and a 4 nm displacement on the BM, and in B, the SPL required to evoke a 100 nm/s and a 250 nm/s velocity of the BM). (C and D) Magnitude of the BM displacement at the suppressor frequency that corresponds to a 1 dB suppression of the probe is plotted at the probe BP as a function of for the TM-A and TM-D models, respectively. At low frequencies, this suppressor displacement is independent of for the TM-A model and increases as is decreased (with a rate of ∼6 dB/dB) with the TM-D model. The vertical dashed line corresponds to the CF, and the vertical dash-dotted line corresponds to . To see this figure in color, go online.
Below 8 kHz, the suppression threshold obtained with the TM-A model matches the single tone 1.5 nm isodisplacement response function for a 10 dB SPL probe tone and the 4 nm isodisplacement response function for a 60 dB SPL probe tone. These simulations are similar to measurements in wild-type animals (27). In contrast, the TM-D model predicts a very different trend where the suppression threshold matches the single-tone 100 nm/s isovelocity response function for a 10 dB SPL probe tone and the 250 nm/s isovelocity response function for a 60 dB SPL probe tone.
In Fig. 6, A and B, the SPL required to reduce the BM displacement at the probe frequency by a constant amount was presented. In Fig. 6, C and D, the corresponding BM displacement is shown for the suppressor frequency under conditions identical to those in Fig. 6, A and B. Predictions with the TM-A and TM-D model differ significantly. Below 8 kHz, this displacement at the threshold of suppression is approximately independent of frequency in the TM-A model, whereas it increases at a rate of ∼6 dB/oct as is decreased in the case of the TM-D model. Moreover, in the TM-A model, there is a notch for . In both models, the suppressor displacement at the suppression threshold decreases sharply as is increased above the CF.
Only the TM-A model predicts phasic suppression
Experiments have shown that low-frequency suppressors not only cause tonic suppression (reduction in the average response to the probe tone) but also affect the response to the probe in a manner that varies with the phase of the suppressor signal, modulating the response at the probe frequency (25–27) (this is called phasic suppression). Phasic suppression was not observed with the TM-D model due to the low HB displacement for low-frequency suppressors (Fig. 4 A, dashed line). To simulate phasic suppression with the TM-A model, the response was computed not only at the probe and suppressor frequencies but also at combination frequencies, , where is a signed integer. The temporal pattern of TTS is shown in Fig. 7 for a 1 kHz suppressor and probe frequency of 17 kHz, the CF of this location. For the three different suppressor intensities, the response to the probe is suppressed slightly after the peak of the suppressor displacement toward the scala tympani. At 80 dB SPL and 90 dB SPL, a secondary maximum of suppression is seen, approximately in phase with the peak of the suppressor displacement toward the scala vestibuli. At 70 dB and 80 dB SPL, the response to the probe is slightly enhanced at the time corresponding approximately to a zero suppressor displacement and a negative suppressor velocity. This phasic amplification is commonly seen in experimental data (see, e.g., Cooper (25)).
Figure 7.

Temporal pattern of TTS for a 1 kHz suppressor and a 17 kHz probe with the TM-A model. The probe intensity is 40 dB SPL and the suppressor intensity is varied between 70 dB and 90 dB SPL. The probe waveform includes the probe component , as well as distortion components , , , and . The suppressor has been scaled to fit on the figures. A positive value corresponds to a displacement of the BM toward the scala vestibuli. To see this figure in color, go online.
Discussion
Comparison of model simulations to experimental data regarding TTS enables us to improve our understanding of how the cochlea processes sounds. Both the TM-A and the TM-D models predict higher rates of suppression and a higher suppression threshold for low side suppressors than for high side suppressors (see Fig. S3 in the Supporting Material), as is the case for physiological measurements. However, the TM-A model is more consistent with experimental measurements regarding TTS by low-frequency suppressors in wild-type animals. These results inform us about the mechanical load applied by the TM on the OHC HB at low frequencies and the magnitude and phase of the OHC HB deflection relative to the BM displacement. Even though the detached TM did not affect the BM CF and had a small effect on the BM response to a pure tone, simulations of TTS show that the TM attachment stiffness is important and nonnegligible. These predictions could be tested by measuring TTS on the mutant mice. The TM-induced loads on the OHC HBs are central to the active process that occurs in the cochlea; modeling TTS provides a tool for indirectly uncovering the underlying mechanics.
Effect of a TM resonance on TTS
Model simulations demonstrate that interesting features can be observed when the suppressor frequency, , is approximately equal to the resonant frequency of the uncoupled TM in shear, . The TM-A model predicts the presence of notches in the suppression curve as a function of the suppressor frequency (Fig. 5 A), in the suppression tuning curve and suppressor displacement at the TTS threshold (Fig. 6, A and C) for . Model parameters (listed in the Supporting Material) were chosen to set and the notch frequency to approximately half an octave below the CF. This choice of model parameters is motivated by the observation of a notch half an octave below the CF in high-frequency neural suppression tuning curves (34,35) that has been attributed, as in our model, to the resonance of the TM in shear (7,10,13,36). The presence of a notch in the BM TTS measurements could be validated experimentally in wild-type animals. However, a notch has not been reported in the measurements of Cooper (25) and Rhode (27), who investigated the dependence of TTS on . The frequency sweep used by Cooper (25) is not fine enough to distinguish the features described here. The fact that no notch has been reported in the BM measurements from Rhode (27) (except for notches due to middle ear resonances) for the midfrequency region of the chinchilla cochlea might be due to the higher damping at these locations (since the HB deflection is very sensitive to the value of the damping coefficient of the shear mode, , for ).
The TM attachment to the spiral limbus is not necessary for normal cochlear amplification
Normal cochlear amplification (with a gain and CF similar to those in wild-type mice) was observed in mutant mice (18). As in the experiments, our model demonstrates that the absence of the TM attachment does not preclude cochlear amplification. The reason for the similar pure-tone response is that the mechanical load applied by the TM on the HB is mostly inertial at the CF (because is lower than the CF), as discussed in Gummer et al. (11). However, there are some minor differences in the predictions with the TM-A and TM-D models. At the same location on the BM, the CF is slightly lower (∼8%) without the attachment springs. Potential changes in the modes of deformation of the TM, not taken into account here, might also affect the CF. The tuning of the response was observed to be almost identical in the mutant and wild-type mice (18), whereas the quality factor, , is ∼5% lower in the TM-D model than in the TM-A model. Moreover, to maintain the stability of the model, we reduced the activity of the TM-D model (by reducing the piezoelectric electromechanical coupling coefficient of the OHC, ). This lower value of could be due to a mechanism that controls the operating point of somatic electromotility to maintain stability in the biological cochlea. Despite the presence of normal cochlear amplification, Lukashkin et al. (18) demonstrated that the key role of the attachment of the TM to the spiral limbus is in IHC stimulation, since thresholds of the compound action potentials are higher in the mutant mice than in the wild-type mice. Although this observation is beyond the scope of this study, the effect of the TM attachment to the spiral limbus on IHC stimulation could be investigated by coupling the computational framework used here to models of the fluid dynamics of the subtectorial space (such as those of Steele and Puria (37) and Li et al. (38)) for the wild-type and mutant animals.
The mechanical load applied by the TM on the OHC HB at low frequencies depends on the TM attachment to the spiral limbus
An important finding of this study is that although the presence of the TM attachment is not required for cochlear amplification and does not play a significant role in setting the value of CF, other characteristics of cochlear nonlinearity, such as TTS, are very sensitive to the mechanical properties of the TM attachment. We found that the relative values of the attachment stiffness and the HB stiffness control TTS by low-frequency suppressors. The simulations with the TM-A model demonstrate that the ratio should be ∼1 to predict TTS by low-frequency suppressors . If this condition is satisfied, the suppression threshold corresponds to a constant displacement of the suppressor component of the BM response at the probe BP, because the TM applies an elastic load on the OHC HB below . The theoretical prediction that the threshold is dependent on the suppressor displacement is in excellent agreement with the measurements of Geisler and Nuttall at the same location in the guinea pig cochlea (26), of Cooper (25) in the hook region of the guinea pig cochlea, and of Rhode (27) in the mid-turn of the chinchilla cochlea. The only exception is the study from Ruggero et al. (19), where the suppression threshold was found to correspond to a constant velocity. However, Cooper (25) has pointed out potential errors in the data presented in the Ruggero et al. study (19).
The predictions of the TM-D model could be tested experimentally on the mutant mice. Without the attachment springs, low-frequency suppressors are much less effective. In the TM-D model, the threshold of suppression corresponds to a constant velocity of the suppressor response at the probe BP for low-frequency suppressors, because the TM applies a viscous load on the OHC HB. Although the mutant mice differ from the wild-type mice in aspects other than the TM attachment, such as the fluid mechanics in the subtectorial space, the effect of the detachment on TTS by low-frequency suppressors is likely to be robust enough to be experimentally observable.
Relation between phasic suppression and the operating point of the MET channel
A significant TM attachment stiffness is also required to simulate phasic suppression by low-frequency suppressors. In the TM-A model, maximum suppression is obtained approximately in phase with the peak of the suppressor component of the BM response toward the scala tympani, as in most experiments (25,26). There is another, secondary maximum of suppression approximately in phase with the peak of the suppressor component of the BM toward the scala vestibuli, which has also been reported in experiments (25,26). These characteristics are obtained because the TM response is stiffness-dominated below the uncoupled resonant frequency in shear, , and therefore, the displacement of the BM toward the scala tympani tends to close the transduction channels (see Eq. S9). Since the resting probability of the MET channel that we use in the model, , is <0.5, a suppressor displacement of the BM that tends to close the MET channels causes more suppression than a displacement that tends to open the MET channels (26). We previously used the same value for to predict small DC shifts toward the scala vestibuli at the CF (33), in agreement with experimental observations by Cooper and Rhode (39).
Link to low side suppression in the auditory nerve
In model simulations (see Fig. 7) and measurements of low side suppression in the BM response (19,25,26), the overall response to the probe and suppressor tones is higher than the response to the probe alone. However, under these same conditions, neural data show rate suppression in the neural fibers (40), a seemingly contradictory result. This difference between mechanical data and neural data was discussed in Cheatham (41) and attributed to the chain of events occurring between BM stimulation and auditory nerve excitation. Cheatham (41) postulated that the low-frequency component of the response is less effective in stimulating the IHC neural response due to a combination of electrical effects (filtering and differences between AC and DC sensitivity) and fluid mechanical effects (velocity sensitivity of the IHC HBs). Moreover, the nonlinearity of the IHC transduction channel and the transduction current adaptation (42) could add another suppressive mechanism. Coupling this cochlear model to models of the subtectorial space (such as those of Steele and Puria (37) and Li et al. (38)) of IHC HB MET and the IHC synapse could help to elucidate some of the differences between TTS on the BM and that in the auditory nerve.
Effect of HB motility on cochlear amplification and TTS
In this model, HB activity was not taken into account. Using a linear model of the cochlea, we previously found that the effect of HB activity is to reduce the gain of the BM response to a pure tone due to the effect of adaptation on the MET channel sensitivity to deflection (43). However, because the HB passive stiffness is lower here than in our previous work, this conclusion might be altered and become more consistent with computational models of the organ of Corti that have found that somatic electromotility and HB activity can work in synergy to amplify the BM vibrations (44–46). Including both HB motility and somatic electromotility in a full nonlinear model of the cochlea is challenging, notably due to the need to estimate parameter values at each location of the cochlear partition. The major conclusions of this study regarding the effect on TTS of the attachment of the TM to the spiral limbus are not expected to change if HB motility is included.
Acknowledgments
This research was supported by National Institutes of Health grant NIH-NIDCD R01-04084.
Footnotes
Julien Meaud’s present address is G.W.W. School of Mechanical Engineering, Georgia Institute of Technology, Atlanta, GA 30332
Supporting Material
References
- 1.Robles L., Ruggero M.A. Mechanics of the mammalian cochlea. Physiol. Rev. 2001;81:1305–1352. doi: 10.1152/physrev.2001.81.3.1305. [DOI] [PMC free article] [PubMed] [Google Scholar]
- 2.Ashmore J., Avan P., Canlon B. The remarkable cochlear amplifier. Hear. Res. 2010;266:1–17. doi: 10.1016/j.heares.2010.05.001. (Erratum in Hear. Res. 2011. 280:245.) [DOI] [PMC free article] [PubMed] [Google Scholar]
- 3.Dallos P. Organ of Corti kinematics. J. Assoc. Res. Otolaryngol. 2003;4:416–421. doi: 10.1007/s10162-002-3049-z. [DOI] [PMC free article] [PubMed] [Google Scholar]
- 4.Howard J., Roberts W.M., Hudspeth A.J. Mechanoelectrical transduction by hair cells. Annu. Rev. Biophys. Biophys. Chem. 1988;17:99–124. doi: 10.1146/annurev.bb.17.060188.000531. [DOI] [PubMed] [Google Scholar]
- 5.Brownell W.E., Bader C.R., de Ribaupierre Y. Evoked mechanical responses of isolated cochlear outer hair cells. Science. 1985;227:194–196. doi: 10.1126/science.3966153. [DOI] [PubMed] [Google Scholar]
- 6.Chen F., Zha D., Nuttall A.L. A differentially amplified motion in the ear for near-threshold sound detection. Nat. Neurosci. 2011;14:770–774. doi: 10.1038/nn.2827. [DOI] [PMC free article] [PubMed] [Google Scholar]
- 7.Lukashkin A.N., Richardson G.P., Russell I.J. Multiple roles for the tectorial membrane in the active cochlea. Hear. Res. 2010;266:26–35. doi: 10.1016/j.heares.2009.10.005. [DOI] [PubMed] [Google Scholar]
- 8.Zwislocki J.J., Kletsky E.J. Tectorial membrane: a possible effect on frequency analysis in the cochlea. Science. 1979;204:639–641. doi: 10.1126/science.432671. [DOI] [PubMed] [Google Scholar]
- 9.Zwislocki J.J. Theory of cochlear mechanics. Hear. Res. 1980;2:171–182. doi: 10.1016/0378-5955(80)90055-6. [DOI] [PubMed] [Google Scholar]
- 10.Zwislocki J.J. Analysis of cochlear mechanics. Hear. Res. 1986;22:155–169. doi: 10.1016/0378-5955(86)90091-2. [DOI] [PubMed] [Google Scholar]
- 11.Gummer A.W., Hemmert W., Zenner H.P. Resonant tectorial membrane motion in the inner ear: its crucial role in frequency tuning. Proc. Natl. Acad. Sci. USA. 1996;93:8727–8732. doi: 10.1073/pnas.93.16.8727. [DOI] [PMC free article] [PubMed] [Google Scholar]
- 12.Legan P.K., Lukashkina V.A., Richardson G.P. A targeted deletion in α-tectorin reveals that the tectorial membrane is required for the gain and timing of cochlear feedback. Neuron. 2000;28:273–285. doi: 10.1016/s0896-6273(00)00102-1. [DOI] [PubMed] [Google Scholar]
- 13.Russell I.J., Legan P.K., Richardson G.P. Sharpened cochlear tuning in a mouse with a genetically modified tectorial membrane. Nat. Neurosci. 2007;10:215–223. doi: 10.1038/nn1828. [DOI] [PMC free article] [PubMed] [Google Scholar]
- 14.Ghaffari R., Aranyosi A.J., Freeman D.M. Longitudinally propagating traveling waves of the mammalian tectorial membrane. Proc. Natl. Acad. Sci. USA. 2007;104:16510–16515. doi: 10.1073/pnas.0703665104. [DOI] [PMC free article] [PubMed] [Google Scholar]
- 15.Ghaffari R., Aranyosi A.J., Freeman D.M. Tectorial membrane travelling waves underlie abnormal hearing in Tectb mutant mice. Nat. Commun. 2010;1:96. doi: 10.1038/ncomms1094. [DOI] [PMC free article] [PubMed] [Google Scholar]
- 16.Meaud J., Grosh K. The effect of tectorial membrane and basilar membrane longitudinal coupling in cochlear mechanics. J. Acoust. Soc. Am. 2010;127:1411–1421. doi: 10.1121/1.3290995. [DOI] [PMC free article] [PubMed] [Google Scholar]
- 17.Lukashkin A.N., Smith J.K., Russell I.J. Properties of distortion product otoacoustic emissions and neural suppression tuning curves attributable to the tectorial membrane resonance. J. Acoust. Soc. Am. 2007;121:337–343. doi: 10.1121/1.2390670. [DOI] [PubMed] [Google Scholar]
- 18.Lukashkin A.N., Legan P.K., Richardson G.P. A mouse model for human deafness DFNB22 reveals that hearing impairment is due to a loss of inner hair cell stimulation. Proc. Natl. Acad. Sci. USA. 2012;109:19351–19356. doi: 10.1073/pnas.1210159109. [DOI] [PMC free article] [PubMed] [Google Scholar]
- 19.Ruggero M.A., Robles L., Rich N.C. Two-tone suppression in the basilar membrane of the cochlea: mechanical basis of auditory-nerve rate suppression. J. Neurophysiol. 1992;68:1087–1099. doi: 10.1152/jn.1992.68.4.1087. [DOI] [PubMed] [Google Scholar]
- 20.Sachs M.B., Kiang N.Y.S. Two-tone inhibition in auditory-nerve fibers. J. Acoust. Soc. Am. 1968;43:1120–1128. doi: 10.1121/1.1910947. [DOI] [PubMed] [Google Scholar]
- 21.Yost W.A. Academic Press; New York: 2006. Fundamentals of Hearing: An Introduction. [Google Scholar]
- 22.Sellick P.M., Russell I.J. Two-tone suppression in cochlear hair cells. Hear. Res. 1979;1:227–236. [Google Scholar]
- 23.Nuttall A.L., Dolan D.F. Two-tone suppression of inner hair cell and basilar membrane responses in the guinea pig. J. Acoust. Soc. Am. 1993;93:390–400. doi: 10.1121/1.405619. [DOI] [PubMed] [Google Scholar]
- 24.Patuzzi R., Sellick P.M., Johnstone B.M. The modulation of the sensitivity of the mammalian cochlea by low frequency tones. III. Basilar membrane motion. Hear. Res. 1984;13:19–27. doi: 10.1016/0378-5955(84)90091-1. [DOI] [PubMed] [Google Scholar]
- 25.Cooper N.P. Two-tone suppression in cochlear mechanics. J. Acoust. Soc. Am. 1996;99:3087–3098. doi: 10.1121/1.414795. [DOI] [PubMed] [Google Scholar]
- 26.Geisler C.D., Nuttall A.L. Two-tone suppression of basilar membrane vibrations in the base of the guinea pig cochlea using “low-side” suppressors. J. Acoust. Soc. Am. 1997;102:430–440. doi: 10.1121/1.419765. [DOI] [PubMed] [Google Scholar]
- 27.Rhode W.S. Mutual suppression in the 6 kHz region of sensitive chinchilla cochleae. J. Acoust. Soc. Am. 2007;121:2805–2818. doi: 10.1121/1.2718398. [DOI] [PubMed] [Google Scholar]
- 28.Geisler C.D. Two-tone suppression by a saturating feedback model of the cochlear partition. Hear. Res. 1992;63:203–210. doi: 10.1016/0378-5955(92)90086-3. [DOI] [PubMed] [Google Scholar]
- 29.Kanis L.J., de Boer E. Two-tone suppression in a locally active nonlinear model of the cochlea. J. Acoust. Soc. Am. 1994;96:2156–2165. doi: 10.1121/1.410157. [DOI] [PubMed] [Google Scholar]
- 30.Nobili R., Mammano F. Biophysics of the cochlea. II: Stationary nonlinear phenomenology. J. Acoust. Soc. Am. 1996;99:2244–2255. doi: 10.1121/1.415412. [DOI] [PubMed] [Google Scholar]
- 31.Lim K.M., Steele C.R. A three-dimensional nonlinear active cochlear model analyzed by the WKB-numeric method. Hear. Res. 2002;170:190–205. doi: 10.1016/s0378-5955(02)00491-4. [DOI] [PubMed] [Google Scholar]
- 32.Geisler C.D., Yates G.K., Johnstone B.M. Saturation of outer hair cell receptor currents causes two-tone suppression. Hear. Res. 1990;44:241–256. doi: 10.1016/0378-5955(90)90084-3. [DOI] [PubMed] [Google Scholar]
- 33.Meaud J., Grosh K. Response to a pure tone in a nonlinear mechanical-electrical-acoustical model of the cochlea. Biophys. J. 2012;102:1237–1246. doi: 10.1016/j.bpj.2012.02.026. [DOI] [PMC free article] [PubMed] [Google Scholar]
- 34.Liberman, M. C. 1976. Abnormal discharge patterns of auditory-nerve fibers in acoustically traumatized cats. PhD thesis. Harvard University, Cambridge, MA.
- 35.Kiang N.Y., Moxon E.C. Physiological considerations in artificial stimulation of the inner ear. Ann. Otol. Rhinol. Laryngol. 1972;81:714–730. doi: 10.1177/000348947208100513. [DOI] [PubMed] [Google Scholar]
- 36.Neely S.T., Kim D.O. A model for active elements in cochlear biomechanics. J. Acoust. Soc. Am. 1986;79:1472–1480. doi: 10.1121/1.393674. [DOI] [PubMed] [Google Scholar]
- 37.Steele C.R., Puria S. Force on inner hair cell cilia. Int. J. Solids Struct. 2005;42:5887–5904. [Google Scholar]
- 38.Li Y., Meaud J., Grosh K. Coupling the subtectorial fluid with the tectorial membrane and hair bundles of the cochlea. AIP Conf. Proc. 2011;1403:104–109. [Google Scholar]
- 39.Cooper N.P., Rhode W.S. Basilar membrane mechanics in the hook region of cat and guinea-pig cochleae: sharp tuning and nonlinearity in the absence of baseline position shifts. Hear. Res. 1992;63:163–190. doi: 10.1016/0378-5955(92)90083-y. [DOI] [PubMed] [Google Scholar]
- 40.Delgutte B. Physiological mechanisms of psychophysical masking: observations from auditory-nerve fibers. J. Acoust. Soc. Am. 1990;87:791–809. doi: 10.1121/1.398891. [DOI] [PubMed] [Google Scholar]
- 41.Cheatham M.A. Comment on “Mutual suppression in the 6 kHz region of sensitive chinchilla cochleae” [J. Acoust. Soc. Am. 121, 2805–2818 (2007)] J. Acoust. Soc. Am. 2008;123:602–605. doi: 10.1121/1.2821414. [DOI] [PubMed] [Google Scholar]
- 42.Beurg M., Nam J.H., Fettiplace R. The actions of calcium on hair bundle mechanics in mammalian cochlear hair cells. Biophys. J. 2008;94:2639–2653. doi: 10.1529/biophysj.107.123257. [DOI] [PMC free article] [PubMed] [Google Scholar]
- 43.Meaud J., Grosh K. Coupling active hair bundle mechanics, fast adaptation, and somatic motility in a cochlear model. Biophys. J. 2011;100:2576–2585. doi: 10.1016/j.bpj.2011.04.049. [DOI] [PMC free article] [PubMed] [Google Scholar]
- 44.O Maoiléidigh D., Jülicher F. The interplay between active hair bundle motility and electromotility in the cochlea. J. Acoust. Soc. Am. 2010;128:1175–1190. doi: 10.1121/1.3463804. [DOI] [PubMed] [Google Scholar]
- 45.Nam J.H., Fettiplace R. Optimal electrical properties of outer hair cells ensure cochlear amplification. PLoS ONE. 2012;7:e50572. doi: 10.1371/journal.pone.0050572. [DOI] [PMC free article] [PubMed] [Google Scholar]
- 46.Ó Maoiléidigh D., Hudspeth A.J. Effects of cochlear loading on the motility of active outer hair cells. Proc. Natl. Acad. Sci. USA. 2013;110:5474–5479. doi: 10.1073/pnas.1302911110. [DOI] [PMC free article] [PubMed] [Google Scholar]
- 47.Hughes T.J.R. Dover; Mineola, NY: 2000. The Finite Element Method: Linear Static and Dynamic Finite Element Analysis. [Google Scholar]
- 48.Ramamoorthy S., Deo N.V., Grosh K. A mechano-electro-acoustical model for the cochlea: response to acoustic stimuli. J. Acoust. Soc. Am. 2007;121:2758–2773. doi: 10.1121/1.2713725. [DOI] [PubMed] [Google Scholar]
- 49.Iwasa K.H., Adachi M. Force generation in the outer hair cell of the cochlea. Biophys. J. 1997;73:546–555. doi: 10.1016/S0006-3495(97)78092-5. [DOI] [PMC free article] [PubMed] [Google Scholar]
- 50.Johnson S.L., Beurg M., Fettiplace R. Prestin-driven cochlear amplification is not limited by the outer hair cell membrane time constant. Neuron. 2011;70:1143–1154. doi: 10.1016/j.neuron.2011.04.024. [DOI] [PMC free article] [PubMed] [Google Scholar]
- 51.Richter C.P., Emadi G., Dallos P. Tectorial membrane stiffness gradients. Biophys. J. 2007;93:2265–2276. doi: 10.1529/biophysj.106.094474. [DOI] [PMC free article] [PubMed] [Google Scholar]
- 52.Gummer A.W., Johnstone B.M., Armstrong N.J. Direct measurement of basilar membrane stiffness in guinea pig. J. Acoust. Soc. Am. 1981;70:1298–1309. [Google Scholar]
- 53.Liu S., White R.D. Orthotropic material properties of the gerbil basilar membrane. J. Acoust. Soc. Am. 2008;123:2160–2171. doi: 10.1121/1.2871682. [DOI] [PubMed] [Google Scholar]
- 54.Strelioff D., Flock A., Minser K.E. Role of inner and outer hair cells in mechanical frequency selectivity of the cochlea. Hear. Res. 1985;18:169–175. doi: 10.1016/0378-5955(85)90009-7. [DOI] [PubMed] [Google Scholar]
- 55.Fernandez C. Dimensions of the cochlea (guinea pig) J. Acoust. Soc. Am. 1952;24:521–523. [Google Scholar]
- 56.Gavara N., Chadwick R.S. Collagen-based mechanical anisotropy of the tectorial membrane: implications for inter-row coupling of outer hair cell bundles. PLoS ONE. 2009;4:e4877. doi: 10.1371/journal.pone.0004877. [DOI] [PMC free article] [PubMed] [Google Scholar]
- 57.He D.Z.Z., Jia S.P., Dallos P. Mechanoelectrical transduction of adult outer hair cells studied in a gerbil hemicochlea. Nature. 2004;429:766–770. doi: 10.1038/nature02591. [DOI] [PubMed] [Google Scholar]
Associated Data
This section collects any data citations, data availability statements, or supplementary materials included in this article.