

Abstract
Neuroimaging research indicates that human intellectual ability is related to brain structure including the thickness of the cerebral cortex. Most studies indicate that general intelligence is positively associated with cortical thickness in areas of association cortex distributed throughout both brain hemispheres. In this study, we performed a cortical thickness mapping analysis on data from 182 healthy typically developing males and females ages 9 to 24 years to identify correlates of general intelligence (g) scores. To determine if these correlates also mediate associations of specific cognitive abilities with cortical thickness, we regressed specific cognitive test scores on g scores and analyzed the residuals with respect to cortical thickness. The effect of age on the association between cortical thickness and intelligence was examined. We found a widely distributed pattern of positive associations between cortical thickness and g scores, as derived from the first unrotated principal factor of a factor analysis of Wechsler Abbreviated Scale of Intelligence (WASI) subtest scores. After WASI specific cognitive subtest scores were regressed on g factor scores, the residual score variances did not correlate significantly with cortical thickness in the full sample with age covaried. When participants were grouped at the age median, significant positive associations of cortical thickness were obtained in the older group for g-residualized scores on Block Design (a measure of visual-motor integrative processing) while significant negative associations of cortical thickness were observed in the younger group for g-residualized Vocabulary scores. These results regarding correlates of general intelligence are concordant with the existing literature, while the findings from younger versus older subgroups have implications for future research on brain structural correlates of specific cognitive abilities, as well as the cognitive domain specificity of behavioral performance correlates of normative gray matter thinning during adolescence.
Keywords: neuroimaging, development, cortical thickness, general intelligence, specific cognitive abilities
Magnetic resonance neuroimaging studies have provided evidence for associations between brain structure and human intelligence (Luders, Narr, Thompson & Toga, 2009). These studies have examined global and regional brain volumes of several tissue classes, including gray matter (comprised of neuronal cell bodies and their dendritic arborizations) as well as white matter (comprised of axonal fibers and myelin). Total brain volume, a global index that reflects the volumes of various tissue classes across brain regions, is moderately and positively associated with the intelligence quotient (IQ) (Luders et al., 2009; McDaniel, 2005; Wickett, Vernon & Lee, 2000; Witelson, Beresh & Kigar, 2006). Positive correlations have also been reported between IQ and the total volumes of cortical regions in each lobe of the cerebral hemispheres (frontal, temporal, parietal, and occipital), as well as the hippocampus and cerebellum (Andreason, Flaum, Swayze, O’Leary, Alliger, Cohen et al., 1993; MacLullich, Ferguson, Deary, Seckl, Starr, & Wardlaw, 2002). Against these broad trends in empirical results, substantial variation has been reported in the strength of association between brain structure and intelligence across brain regions, as well as across brain tissue classes. For example, positive correlations have been reported between IQ and global indices of gray (Andreason et al., 1993; Colom, Jung, & Haier, 2006; Narr et al. 2007; Reiss, Abrams, Singer, Ross & Denckla, 1996) and white (Gignac, Vernon & Wickett, 2003; Gur, Turetsky, Matsui, Yan, Bilker, Hughett et al., 1999; Narr, Woods, Thompson, Sneszko, Robinson, Dimtcheva et al., 2007; Posthuma, de Geus, Baare, Hulshoff Pol, Kahn & Boomsma, 2002) matter volumes, but recent reviews suggest stronger associations for gray matter volumes (e.g., Luders et al., 2009).
Voxel-wise structural brain mapping methods have allowed researchers to identify specific associations between intelligence and discrete brain regions. The findings from these studies are consistent in identifying areas of the lateral and medial frontal cortex, cingulate, medial and lateral temporal cortex, superior and inferior parietal cortex, and extra-striate occipital cortex as regions where gray matter volume is specifically associated with IQ scores (see Luders et al., 2009 for review). In general, greater gray matter volumes in these regions of association cortex have been associated with higher IQ scores. Nevertheless, potentially important discrepancies have been reported as well from gray matter volumetric analyses, particularly with respect to sex and age differences. For example, Haier et al. (Haier, Jung, Yeo, Head & Alkire, 2004) used voxel-based morphometry and reported that IQ scores were associated with gray matter volumes primarily in prefrontal cortical regions for females, while males demonstrated additional correlates in posterior (parietal-occipital) cortical regions. With respect to age differences, Haier et al. (2004) integrated their own results from young adults and older adults with findings reported by Wilke et al. (Wilke, Sohn, Byars, & Hollanda, 2003) and hypothesized a developmental progression from early childhood through young adulthood to old age for neuroanatomical correlates of intelligence, involving the anterior cingulate to medial frontal areas to dorsal frontal areas, respectively.
Recently, it has been suggested that cortical thickness may be more closely related to intelligence than volumetric measures (Haier et al., 2004, Luders et al., 2009; Narr et al., 2007, Karama, Ad-Dab’bagh, Haier, Deary, Lyttleton, Lepage, et al., 2009, Choi, Shamosh, Cho, DeYoung, Lee, Lee et al., 2008, Colom, Haier, Head, Alvarex-Linera, Quiroga, Shih et al., 2009). Point estimates of the thickness of the cerebral cortex in a given location likely reflect how cortical neurons are organized (Narr et al., 2007) rather than simply indicating the density of gray matter tissue within a Cartesian search space. Thus, cortical thickness may offer more insight into the relations between brain structure and intelligence than other measures (Narr et al., 2007). To date, only a small number of studies have been published that address associations between human intelligence and cortical thickness.
Narr et al. (2007) reported positive associations between full scale IQ and cortical thickness in prefrontal and temporal areas in both hemispheres as well as a region of extra-striate cortex in the right occipital lobe. Choi et al. (2008) obtained significant positive associations between full scale IQ and cortical thickness in multiple regions along the full extent of the temporal lobe of the left hemisphere, but not in any other cortical regions; however, they did find a negative association in the left parietal lobe. Karama et al. (2009) assessed a representative sample of children and adolescents aged 6 to 18 years old using the Wechsler Abbreviated Scale of Intelligence (WASI: Wechsler, 1999) and derived general intelligence (g) scores based on the first principle component derived in a principle components analysis of the four WASI subtests: Vocabulary, Similarities, Block Design, and Matrix Reasoning. They reported widely distributed clusters of significant positive associations between g scores and cortical thickness in frontal, temporal, parietal, and occipital areas of both hemispheres, as well as the cingulate cortex bilaterally. The clusters were located in areas of association cortex and did not encompass primary sensory or motor regions.
As illustrated by the results of Karama et al. (2009), structural neuroimaging brain mapping studies of intelligence have generally supported a distributed network of multimodal association regions in association with individual differences in IQ scores. This conclusion has been formalized in the Parieto-Frontal Integration Theory of Intelligence (P-FIT; Jung & Haier, 2007), which posits that sensory information is processed by temporal and occipital regions and is subsequently integrated within parietal regions. The cingulate cortex and dorsolateral prefrontal regions mediate higher-level processes such as evaluation, problem-solving, and response selection (Jung & Haier, 2007). In their formulation of this theory, Jung and Haier (2007) integrated results from a selection of relevant neuroimaging studies published between 1988 and 2007 and argued that while studies of associations between gray matter tissue characteristics and intelligence may seem inconsistent in terms of the precise regional specificity of reported results, they in fact form a coherent picture in their convergence on a limited number of regions of heteromodal association cortex (Jung & Haier, 2007).
Intelligence has been represented in most neuroimaging studies by estimates of general intelligence, g, a metric derived from the first-order factor that emerges when various subtests of more specific cognitive abilities are factor analyzed. In theory, estimates of g represent the core of intellectual functioning as derived from the Spearman tradition (Spearman, 1904). In popular hierarchical models of intelligence (e.g., Carroll, 1993), g is positioned above a set of more specialized or specific cognitive abilities, such as verbal or spatial reasoning ability. Accordingly, the question arises as to whether the unique (g-independent) variance in cognitive abilities shares the same structural neuroanatomical correlates as the common variance contained in g scores. In a recent study, Karama et al. (Karama, Colom, Johnson, Deary, Haier, Waber, tet al., 2011) assessed a sample of 6 to 18 year olds and derived g scores from the first unrotated principle factor of a factor analysis of the four WASI subtests together with three achievement tests (Calculation, Letter-Word Identifiation, and Comprehension; from the Woodcock-Johnson Psycho-Educational Battery-III: Woodcock, McGrew, & Mather, 2001). They described a pattern of positive associations between g scores and cortical thickness similar to their previous report (Karama et al., 2009). Additionally, they demonstrated that observed positive cortical thickness correlates of specific tests, e.g., WASI Vocabulary or Block Design, could be accounted for by shared variance with g scores. Specifically, when scores on specific WASI and Woodcock-Johnson tests were regressed on g scores, the residuals of the specific test scores did not produce significant cluster results in cortical thickness mapping analyses. Karama et al. (2011) concluded that cortical thickness correlates of performance on cognitive tasks may be translations of broader associations involving g, and that inclusion of an estimate of g may be required to validate specific associations of cortical thickness with specific cognitive abilities.
To expand the literature on structural neuroimaging correlates of intelligence, we conducted a cortical thickness mapping analysis of associations with general and specific measures of intelligence in a sample with a broad developmental age range from late childhood to early adulthood, when robust gray matter development occurs (e.g., Giedd, Blumenthal, Jeffries, Castellanos, Liu, Zijdenbos et al., 1999). Our aims were threefold. First, we investigated cortical thickness correlates of general intelligence to add to the empirical testing of the P-FIT model and to clarify variations associated with sex differences. Second, we sought to identify maturational cortical thinning correlates of intelligence, i.e., aspects of performance on intellectual testing that are associated with the developmental reduction in gray matter (“pruning”) known to occur within the age range of our sample. Third, we performed a replication of the Karama et al. (2011) analysis by conducting cortical thickness mapping of g-independent variance in specific cognitive abilities, thereby testing whether cortical thickness associations of specific cognitive abilities are mediated by the broader network of neuroanatomical correlates of g.
Method
Sample
One-hundred and eighty-one healthy, right-handed participants (81 male, 100 female) ranging in age from 9 to 24 years (M=16.31, SD=3.99) participated in this study as part of an ongoing longitudinal study of adolescent brain and behavioral development (refs to be inserted after blind review). Participants varied in self-identified ethnicity: 87.4 % Caucasian, 1.6 % African-American, 1.6 % Hispanic, 4.4 % Asian/Pacific Islander, and 4.9 percent identifying themselves as “Other/Mixed Race.” This distribution closely matches the population distribution in [to be inserted] as determined by 2009 census data (http://quickfacts.census.gov/qfd/states/27000.html). Participants came from relatively well-educated households; the average number of years of parental education was slightly less than 16 years for mothers and just over 16 years for fathers (Mothers: M=15.69, SD=1.99, Fathers: M=16.17, SD=2.86). Full-scale IQ (FSIQ, as measured by the Wechsler Abbreviated Scale of Intelligence) ranged from a minimum of 89 (Low Average level of ability) to a maximum of 148 (Very Superior level of ability). The average FSIQ was 115.95, with a standard deviation of 9.89, representing the High Average range of intelligence. Average Verbal IQ (as measured by the Vocabulary and Similarities subtests) was 114.51, with a standard deviation of 9.91. Average Performance IQ (as measured by the Block Design and Matrix Reasoning subtests) was 113.70, with a standard deviation of 11.29.
Participants were recruited through the use of posted advertisements and through a database of community volunteers maintained by the University of X’s Institute of X. This database holds records of families who live in the metro area that indicated at the time of their children’s births that they would be interested in participating in future studies conducted at the University.
Potential participants were screened for eligibility first through a phone interview and then in person. Reasons for exclusion included any current or past history of psychopathology, as assessed by the Kiddie-SADS-Present and Lifetime Version (Kaufman, Birmaher, Brent, Rao, & Ryan, 1996) and/or psychoactive medication use, neurological problems, head injury with loss of consciousness, serious medical illnesses that could affect neurological systems, learning disabilities, preterm birth, any current or past history of substance abuse, and MRI contraindications (e.g., cardiac pacemaker, orthodontic braces, etc). Individuals were also excluded from further study if they had a full-scale IQ score of less than 70, which would indicate the possibility of significant intellectual disability. Consent and assent (when applicable) were obtained from participants and their parents as approved by the University of X Institutional Review Board.
Intelligence Assessment
Each subject completed the Wechsler Abbreviated Scale of Intelligence (WASI) (Wechsler, 1999). The WASI consists of four subtests derived from other Wechsler intelligence assessments: Vocabulary, Similarities, Block Design, and Matrix Reasoning. These four subtests were selected for inclusion on the WASI, because they have strong associations with general cognitive abilities (g) based on psychometric properties, because they relate to dichotomies of the IQ construct, including the traditional Wechsler distinction between verbal and performance IQs, and because these four subtests are among the most reliable in the Wechsler testing tradition (Wechsler, 1999). The subtests can be differentiated into Verbal (Vocabulary and Similarities; Verbal IQ or VIQ) and Performance (Block Design and Matrix Reasoning; Performance IQ or PIQ) domains, as well as combined to provide an estimate of the Full-Scale IQ (FSIQ). Estimates of FSIQ from the WASI correlate highly with FSIQ scores as measured by the full Wechsler Adult Intelligent Scale-III, which was the variant of the WAIS that was in use when the WASI was developed (r = .92; Axelrod, 2002).
MRI Image Acquisition and Processing
All MRI data were acquired on a 3-Tesla Siemens Trio scanner (Siemens Medical Systems, Erlangen, Germany) at the University of X’s Center for Magnetic Resonance Research. Three-dimensional brain images were obtained with a coronal T1-weighted Magnetization Prepared Rapid Gradient Echo (MPRAGE) sequence (TR = 2530 msec, TE = 3.65 msec, TI = 1100 msec, 240 slices, voxel size =1.0 × 1.0 × 1.0, flip angle = 7, FOV = 256 mm).
These images were processed though FreeSurfer v.4.5.0 (Fischl, van der Kouwe, Destrieux, Halgren, Segonne, Salat et al., 2004b; http://surfer.nmr.mgh.harvard.edu/) to obtain estimates of cortical thickness. The technical details of these procedures have been described elsewhere (Dale, Fischl, & Sereno, 1999; Dale & Sereno, 1993; Fischl & Dale, 2000; Fischl, Liu & Dale, 2001; Fischl, Salat, Busa, Albert, Dieterich, Haselgrove et al., 2002; Fischl, Salat, van der Kouwe, Makris, Segonne, Quinn, et al., 2004a; Fischl, Sereno & Dale, 1999a; Fischl, Sereno, Tootell, & Dale, 1999b; Fischl et al., 2004b; Han, Jovicich, Salat, van der Kouwe, Quinn, Czanner et al., 2006; Jovicich, Czanner, Greve, Haley, van der Kouwe, Gollub et al., 2006; Segonne, Dale, Busa, Glessner, Salat, Hahn et al., 2004). Image preprocessing in the FreeSurfer pipeline included translation of individual brains into Talairach space (Talairach & Tournoux, 1988), and removal of non-brain tissue from the image using a hybrid watershed/surface deformation procedure (Segonne et al., 2004).
Closer approximation of the inherent geometry of the cortical ribbon was then obtained through conversion of the static, stereotaxic, voxel-based images to a deformable, surface-based 3-D representation. This conversion included fitting tessellated “wireframes” of triangles to the pial and gray/white surface boundaries. Correction of physiological and geometric impossibilities on the surfaces (Fischl et al., 2001; Segonne, Pacheco, & Fischl, 2007), and optimized classification of the tessellation cells as gray matter, white matter, or cerebrospinal fluid (Dale et al., 1999; Dale & Sereno, 1993; Fischl & Dale, 2000) was then carried out, resulting in a wireframe model of the cortical ribbon that was deformed, or adjusted in size and shape, while retaining all prior location and geometric information at each vertex in the tessellation (Fischl et al., 1999a). This allowed for highly accurate inter-subject registration based on gyral and sulcal topology (Fischl et al., 1999b), topological parcellations and labeling of sulci and gyri (Desikan, Segonne, Fischl, Quinn, Dickerson, Blacker et al., 2006; Fischl et al., 2004b), and statistical analysis of morphometric properties such as cortical thickness. Thickness of the gray matter was calculated as the closest distance from the gray/white boundary to the pial boundary at each vertex (Fischl and Dale, 2000). In all, the FreeSurfer processing created a thickness map for the brain of each participant that was accurately aligned to a standard topological model, and these maps (spatially smoothed with a 15mm full-width half-maximum kernel) were then entered into a series of general linear model analyses investigating the relationships between cortical thickness at each vertex and external variables (sex, age, test scores, etc.). Localization and distinction of anatomical nomenclature was carried out using the Talairach Client v.2.4.2 (http://www.talairach.org/client.html) and standard FreeSurfer atlases (Desikan et al., 2006).
Statistical Analyses
Statistical analyses of demographic data and test scores were conducted using SPSS (SPSS for Windows, Version 16.0. Chicago, SPSS Inc.). Means for age, general intelligence (g) factor scores, FSIQ, VIQ, and PIQ were compared between males and females using t-tests. Associations among these variables were assessed using Pearson correlations. General intelligence scores were calculated using the first unrotated principal factor (g) derived from principal axis factoring of Vocabulary, Similarities, Block Design, and Matrix Reasoning scores. This factor accounted for approximately 32% of the variance in the subtest scores. WASI subtest scores were regressed on g scores and the residuals were employed as g-independent measures of specific cognitive abilities.
In cortical thickness mapping analyses of associations with intelligence test variables, separate linear regressions were conducted at 155,000 points on the surface of the brain through FreeSurfer’s QDEC program (http://surfer.nmr.mgh.harvard.edu/fswiki/Qdec). To identify developmental effects, regressions were run with and without age as a covariate. To examine developmental patterns in more detail, ad hoc separate-group analyses were conducted on younger and older subsamples based on a median split of age. Each regression produced a t-statistic and an associated p-value. To account for multiple comparisons, 10,000 Monte-Carlo-style simulations were performed in FreeSurfer, which yielded information about the distribution of maximum cluster size in randomly generated maps. This information about the distribution of maximum cluster size under the null hypothesis was used to determine cluster-wise p-values for thresholding the individual-vertex p-values of regression coefficients for test scores. Clusters having a family-wise-error-corrected p≤.05 were considered statistically significant, although trend-level results (p<.10) are reported as well to provide a more comprehensive reporting of the results.
Results
Demographics and Test Scores
Within the full sample, the expected associations between WASI subtests and IQ scores were observed, as indicated in Table 1. All intercorrelations among subtest scores and IQ scores were positive and significant at the p ≤ .01 level, two-tailed, supporting the concept of the positive manifold as described by Spearman (Spearman, 1904). However, convergent and discriminant validity was also evident given that the verbal subtests (Vocabulary and Similarities) correlated most strongly with VIQ as opposed to PIQ, while the opposite pattern was true for Block Design and Matrix Reasoning. Moreover, while VIQ and PIQ were each highly correlated with FSIQ, they were only moderately correlated with one another, indicating that each was reflecting separate as well as shared sources of variance in intellectual skills.
Table 1.
Intercorrelations among WASI IQ measures.
| Variable | g | FSIQ | VIQ | PIQ | VOC | SIM | BD | MR |
|---|---|---|---|---|---|---|---|---|
| g | -- | |||||||
| FSIQ | .99 | -- | ||||||
| VIQ | .80 | .81 | -- | |||||
| PIQ | .83 | .84 | .36 | -- | ||||
| VOC | .70 | .69 | .85 | .30 | -- | |||
| SIM | .65 | .66 | .83 | .29 | .42 | -- | ||
| BD | .66 | .71 | .27 | .87 | .23 | .22 | -- | |
| MR | .77 | .71 | .35 | .81 | .31 | .27 | .44 | -- |
Note. VIQ=Verbal IQ; PIQ=Performance IQ; FSIQ=WASI Full-Scale IQ; VOC=Vocabulary T-score; BD=Block Design T-Score; SIM=Similarities T-score; MR=Matrix Reasoning T-Score; g=general intelligence factor scores, i.e., scores derived from the largest unrotated factor in a principle factor analysis of WASI subtest T-scores; WASI T-scores are normed for age and sex; correlations represent Pearson’s r.
There were no significant differences between males and females on any of the behavioral variables (age, WASI IQs and subtest scores, g scores, g-residualized WASI subtest scores. Age showed weak associations with PIQ (r= −.167, p=.03), Matrix Reasoning (r=−.14, p=.06), g-residualized PIQ (r=−.15, p=.04), and g-residualized Vocabulary (r=.15, p=.04). Overall, these correlations indicate that there was not a significant sampling bias of intelligence scores with respect to age.
Cortical Thickness
Effects of Sex and Main Effect of Age
There were no significant differences in cortical thickness between males and females after correction for multiple comparisons. Additionally, sex did not have significant interactive effects on the cortical thickness associations with intelligence scores described below. Given the broad age range of the sample, cortical thickness was examined in relation to age. As expected, cortical thickness was significantly negatively associated with age in most brain areas (see Figure 1). Indeed, most of the cortex showed this pattern.
Figure 1.

Negative associations between cortical thickness and age. Clockwise from top left: lateral left hemisphere, lateral right hemisphere, medial left hemisphere, medial right hemisphere. Colorbar shows cluster-level family-wise corrected p-values; blue = negative partial correlations, red = positive partial correlations).
General Intelligence Scores
Regression of cortical thickness on g scores at each point on the cortical surface while controlling for participant sex resulted in areas of significant (cluster-level family-wise corrected p-value ≤.05) positive association in frontal, temporal, parietal, occipital, and cingulate regions (see Table 2 and Figure 2). In the left hemisphere, clusters were located in rostral-superior frontal, posterior-superior temporal, lateral-superior parietal, medial-inferior parietal, and fusiform regions. In the right hemisphere, clusters were located in rostral-superior frontal, caudal-medial frontal/cingulate, anterior-superior temporal (medial wall or temporal operculum), lateral occipital, precuneus, and fusiform regons. All clusters indicated associations of greater cortical thickness with higher g scores.
Table 2.
Associations of cortical thickness with IQ measures, with sex covaried. IQ measures with “res” suffix are residuals obtained after regressing WASI T-scores on g factor scores.
| Hemi | IQ Measure | Max t-stat | Size (mm2) | CWP | X coor | Y coor | Z coor | Talairach Label | BA | FreeSurfer Label |
|---|---|---|---|---|---|---|---|---|---|---|
| LH | g | 3.475 | 4800 | 0.0001 | −29 | 52 | −5 | Superior Frontal Gyrus | 10 | Rostral Middle Frontal |
| LH | g | 2.842 | 3423 | 0.0002 | −32 | −45 | 43 | Inferior Parietal Lobule | 40 | Superior Parietal |
| LH | g | 4.664 | 3204 | 0.0004 | −41 | −40 | 14 | Superior Temporal Gyrus | 41 | Superior Temporal |
| LH | g | 2.119 | 2255 | 0.0071 | −42 | −58 | −17 | Fusiform Gyrus | 37 | Fusiform |
| RH | g | 5.154 | 7080 | 0.0001 | 36 | 1 | −10 | Superior Temporal Gyrus | 38 | Unknown |
| RH | g | 3.775 | 6361 | 0.0001 | 32 | −85 | −2 | Inferior Occipital Gyrus | 18 | Lateral Occipital |
| RH | g | 4.171 | 2799 | 0.0017 | 18 | −59 | 23 | Precuneus | 31 | Precuneus |
| RH | g | 3.547 | 2610 | 0.0042 | 45 | −34 | −19 | Fusiform Gyrus | 20 | Inferior Temporal |
| RH | g | 3.924 | 1936 | 0.0293 | 12 | 13 | 37 | Cingulate Gyrus | 32 | Superior Frontal |
| RH | PIQres | 3.924 | 1679 | 0.0629 | 56 | −10 | −4 | Middle Temporal Gyrus | 21 | Superior Temporal |
| LH | VOCres | −3.472 | 4161 | 0.0001 | −55 | −25 | 28 | Inferior Parietal Lobule | 40 | Supramarginal |
| LH | VOCres | −3.028 | 2000 | 0.0170 | −16 | −42 | −5 | Parahippocampal Gyrus | Parahippocampal | |
| LH | VOCres | −2.919 | 1513 | 0.0821 | −25 | −66 | 26 | Precuneus | 7 | Superior Parietal |
| RH | VOCres | −3.290 | 3617 | 0.0001 | 38 | −77 | 30 | Superior Occipital Gyrus | 19 | Inferior Parietal |
| RH | VOCres | −2.897 | 2125 | 0.0163 | 49 | −13 | −9 | Superior Temporal Gyrus | 22 | Superior Temporal |
| RH | VOCres | −2.614 | 1774 | 0.0464 | 8 | −44 | 46 | Precuneus | 7 | Precuneus |
Figure 2.
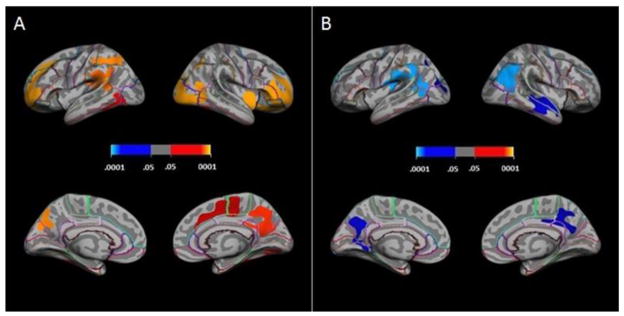
Positive associations of cortical thickness with (A) general intelligence factor scores, and (B) g-residualized Vocabulary scores; with sex covaried. Clockwise from top left within A and B: lateral left hemisphere, lateral right hemisphere, medial left hemisphere, medial right hemisphere. Colorbar shows cluster-level family-wise corrected p-values; blue = negative partial correlations, red = positive partial correlations).
After controlling for age in addition to sex (see Table 3 and Figure 3) significant frontal and parietal clusters remained in the left hemisphere, while signficant frontal, lateral occipital, and precuneus clusters remained in the right hemisphere. Including age as a covariate had the general effect of reducing the size of effects, as indicated by somewhat smaller above-threshold clusters and two clusters that were reduced to statistical trend level (left superior temporal (p=.07, cluster-level family-wise corrected), right caudal-medial frontal/cingulate (p=.08, cluster-level family-wise corrected; see Table 3).
Table 3.
Associations of cortical thickness with IQ measures, with sex and age covaried.
| Hemi | IQ Measure | Max t-stat | Size (mm2) | CWP | X coor | Y coor | Z coor | Talairach Label | BA | FreeSurfer Label |
|---|---|---|---|---|---|---|---|---|---|---|
| LH | g | 3.070 | 2584 | 0.0005 | −30 | 52 | −5 | Middle Frontal Gyrus | 10 | Rostral Middle Frontal |
| LH | g | 2.443 | 1509 | 0.0478 | −32 | −45 | 43 | Inferior Parietal Lobule | 40 | Superior Parietal |
| LH | g | 4.196 | 1395 | 0.0711 | −42 | −40 | 14 | Superior Temporal Gyrus | 41 | Superior Temporal |
| RH | g | 3.351 | 3234 | 0.0001 | 32 | −85 | −2 | Inferior Occipital Gyrus | 18 | Lateral Occipital |
| RH | g | 3.256 | 2669 | 0.0012 | 27 | 48 | −5 | Middle Frontal Gyrus | 10 | Rostral Middle Frontal |
| RH | g | 3.884 | 2083 | 0.0071 | 19 | −60 | 23 | Precuneus | 31 | Precuneus |
| RH | g | 3.833 | 1406 | 0.0817 | 12 | 13 | 37 | Cingulate Gyrus | 32 | Superior Frontal |
Figure 3.

Positive associations of cortical thickness with general intelligence factor scores, with sex and age covaried. Clockwise from top left: lateral left hemisphere, lateral right hemisphere, medial left hemisphere, medial right hemisphere. Colorbar shows cluster-level family-wise corrected p-values; blue = negative partial correlations, red = positive partial correlations).
WASI g-Residualized Scores
Regression of cortical thickness on WASI g-residualized scores while controlling for participant sex resulted in areas of significant (cluster-level family-wise corrected p-value ≤.05) negative association for g-residualized Vocabulary scores in both hemispheres (see Table 2 and Figure 2). Left hemisphere clusters were located in the parahippocampal region and near the temporal-parietal junction. Right hemisphere clusters were located in the middle of the temporal lobe, inferior parietal lobe extending into the superior occipital region, and precuneus (note that a trend-level cluster (p=.08, cluster-level family-wise corrected) was located in the precuneus of the left hemisphere). A positive association cluster was obtained at trend-level (p=.06, cluster-level family-wise corrected) for g-residualized PIQ scores in the mid-superior temporal region of the right hemisphere. No signficant clusters were observed for the other g-residualized scores. No significant clusters were observed for any g-residualized score when age was added as a covariate to the regression equations.
Younger vs. Older Subsamples
To explore developmental patterns further, cortical thickness regressions were repeated on younger (9.0 to 16.45 years) vs. older (16.46 to 24.0 years) subsamples formed by a median split on age, with sex included as a covariate. Although the median split produced groups with highly similar mean scores across the intelligence measures, the older group demonstrated consistently less variance in score distributions (e.g., means and standard deviations for younger vs. older groups: FSIQ=116.3 (SD=11.42) vs. 115.6 (SD=8.11), VIQ=114.8 (SD=10.75) vs. 114.2 (SD=9.03), PIQ=114.1 (SD=13.59) vs. 113.2 (SD=8.40)). Results of cortical thickness regressions for the younger subsample were more extensive and corresponded more closely to the results for the full sample (see Table S1 and Figure S1 in the Supplement), and included signficant positive-association clusters for g-scores as well as significant negative-association clusters for g-residualized Vocabulary scores. Clusters were located in both hemispheres and distributed over many of the same regions as in the full sample analysis when age was not included as a covariate. Conversely, cortical thickness analysis of the older subsample produced significant positive-association clusters for non-verbal scores only, specifically g-residualized PIQ and g-residualized Block Design (see Table S1 and Figure S2 in the Supplement).
Discussion
In this study of typically developing pre-adolescents, adolescents, and young adults, higher general intelligence (g) scores were significantly correlated with greater cortical thickness in multiple regions of association cortex in both hemispheres, but not with primary sensory or motor cortices. After regression on g scores, more narrow indices of intellectual functioning as assessed by the four WASI subtests were not significantly associated with cortical thickness, with two exceptions. Thinner cortex was associated with g-residualized Vocabulary scores in regions of both the left and right hemisphere, while thicker cortex was associated (at p=.06, cluster-level family-wise corrected) with g-residualized Performance IQ scores in the superior portion of the mid-temporal region of the right hemisphere. However, these results for g-residualized Vocabulary and PIQ scores were not obtained when age was entered as a covariate in the regression equations, while most of the results for g scores themselves remained, albeit within somewhat less extensive clusters. In an ad hoc follow-up analysis of younger vs. older subsamples, the cortical thickness associations for g scores and g-residualized Vocabulary scores were demonstrated strongly by the younger group but not by the older group. Conversely, the older group demonstrated cortical thickness associations for g-residualized PIQ scores as well as g-residualized Block Design scores, typically the subtest most strongly correlated with PIQ in Wechsler IQ test batteries (see WASI score intercorrelations in Table 1).
The associations we obtained between cortical thickness and g scores are broadly consistent with recent structural neuroimaging mapping studies of intelligence test scores, as most studies have described cluster patterns that are widely distributed, bilateral, and focused in association regions of frontal, temporal, parietal, and extra-striate occipital cortex. In one of the more directly comparable studies, Karama and colleagues (2009) examined the relations between cortical thickness and WASI-derived g scores in a sample of children and adolescents (6 to 18 years old) and found positive associations widely distributed across both hemispheres. In the current study we found several clusters with foci similar to those reported by Karama et al. (2009), including regions of left frontal (Brodmann area 10, or BA 10), left parietal cortex (BA 40), right frontal (BA 10), and right occipital (BA 18) cortex. As is typical in this literature some findings do not overlap between the two studies, e.g., as compared to Karama et al. (2009) the current results demonstrate more equally distributed prefrontal clusters, an extra-striate cluster in the right hemisphere only, and a large posterior-medial cluster (at p=.08, cluster-level family-wise corrected) that only minimally includes aspects of the cingulate gyrus. These differences in clustering results are attributable at least in part to the many methodological differences between the two studies, such as multi-scanner data in the Karama et al. (2009) study, different methods of extraction of the cortical surface and measurement of cortical thickness, and different techniques to control p-values over the thousands of regressions computed in the cortical thickness mapping analysis. It is perhaps more noteworthy that core regions of a distributed network of cortical thickness correlates of general intelligence were obtained in both studies despite many methodological differences.
In a subsequent analysis, Karama and colleagues (Karama et al., 2011) reported that in the full 6 to 18 year old sample, cortical thickness associations with tests of specific cognitive abilities were eliminated after the test scores were regressed on g scores. In our 9 to 24 year old sample, cortical thickness associations were observed for g-residualized Vocabulary, Performance IQ, and Block Design scores, but only when age-related developmental variance was included in the analysis, as discussed below. When age was included as a covariate in the regression equations, as in the Karama et al. (2011) analysis, we obtained a similar result: statistically significant cortical thickness clusters were obtained only for g scores and not for any of the g-independent (residualized) measures of more specific cognitive abilities. Thus, we replicated the finding of Karama et al. (2011) regarding the predominance of findings in cortical thickness mapping for g-scores over findings for specific cognitive test scores, in a large independent sample and using different MRI quantification and statistical analysis methods.
Less agreement is found between the current results and other recent neuroimaging studies of general intelligence, although all studies converge on the prominence of higher-order association cortex in patterns of regional correlations. Goh, Bansal, Xu, Hao, Liu, and Peterson (2011) analyzed cortical thickness in a sample of participants with a wide age range of 7 to 57 years and reported clusters primarily restricted to left ventromedial prefrontal cortex and right medial-dorsal prefrontal cortex. Moreover, the associations with full scale IQ scores were negative, i.e., higher scores were associated with lower cortical thickness. Additionally, large sex differences were found, again restricted to prefrontal regions, and indicated that, in general, the IQ-cortical thickness associations were negative for males and positive for females. It is difficult to interpret these intriguing results with respect to the current study, which produced positive correlations with g scores and did not find significant sex differences, as our sample includes only participants in maturational neurodevelopmental phases (later childhood, adolescence, and adulthood) as opposed to the mixed maturational and aging phases that would be found in a 7–57 year age range. Once again, there are large methodological differences in quantification and statistical analysis of cortical thickness between the two studies, further complicating comparisons.
Sex differences also were reported by Narr et al. (2007) a study of associations between cortical thickness and IQ scores in sample ranging in age from 17 to 44 years. Significant positive associations were obtained in several regions similar to those for the current results, i.e., medial and dorsal prefrontal, temporal, and extra-striate occipital cortex. A general difference is that Narr et al. (2007) obtained clusters aligned primarily along the ventral and medial regions of the cortex and did not include large areas of the parietal lobe or the parietal-temporal-occipital junction region. Narr et al. (2007) also found sex differences in the anterior-posterior distribution of clusters for females vs. males, whereby IQ correlations were located more in prefrontal-temporal regions for females vs. temporal-occipital regions for males. Again, differences exist between the current study and that of Narr et al. (2007) in terms of sample, as our sample was much larger and spanned a significantly younger age range, and methodology, e.g., Narr et al. (2007) employed permutation control over p-values in a limited search region (prefrontal and temporal areas) defined a priori based on their prior work. With respect to sex differences, this approach to p-value control may have allowed Narr et al. (2007) to detect sex differences in those cortical regions that were not detected in the current whole-brain mapping analysis. On the other hand, the current sample is much larger (n=181 vs. 65) and the discrepancy in sex differences between the two studies may be an instance of a small-sample effect failing to replicate in a large sample.
Several findings were obtained regarding age differences in the current study. Younger participants (9 to 16 years old) demonstrated robust associations between cortical thickness and g scores while older participants (16 to 24 years old) did not. This pattern conflicts with Karama et al. (2009), who reported similar regional cortical associations of thickness with g scores between younger (6 to 12 years old) and older (12 to 18 years old) subsamples and an overall trend toward stronger effects sizes in older participants. Our results also do not conform to the developmental hypothesis of Haier et al. (2004), which would predict stronger anterior cingulate associations in our younger subsample vs. stronger medial frontal associations in our older subsample. However, these discrepancies may reflect incidental statistical confounds created by the median split of age used in our ad hoc age-group analysis. Although the two age groups had highly similar mean scores for g scores and WASI g-residualized subtest scores, their score distributions were different: the younger group showed approximately normal distributions while the older group showed leptokurtic (highly peaked) distributions, with smaller ranges and substantially less total variance. For example, the kurtosis values for g scores were .088 in the younger group vs. 1.173 in the older group, and the older group had approximately half as much total g score variance. Accordingly, correlations between cortical thickness and intelligence scores may have been attenuated in the older group and confounded the ad hoc group-wise analysis of developmental trends.
The older group did demonstrate significant positive associations for two measures of visual processing and visuomotor integration, specifically g-residualized scores for Performance IQ and Block Design. One cluster located in the banks of the superior temporal sulcus (BA 41) of the right hemisphere was obtained for g-residualized Performance IQ. Clusters for g-residualized Block Design spanned ventral-medial prefrontal, medial-superior frontal, precentral, posterior temporal, and superior parietal, and precuneus areas in the right hemisphere, while left hemisphere clusters extended over ventral-lateral prefrontal, medial-superior frontal, precentral, temporal, and inferior and superior parietal regions. It is noteworthy that the clusters extended toward motor-related frontal cortical regions, given that Block Design requires increasingly complex visual-motor processing as problem solving proceeds within and across trials. For the most part the clusters for g-residualized Block Design scores do not overlap with the clusters obtained for g scores in the full sample. Nevertheless, the clusters for g-residualized Block Design scores do fall within the broad regional brain parameters of the P-FIT model, and thus their potential independence from correlates of general intelligence was established by their prior regression on g scores rather than distinctiveness of cortical locations (see Karama et al., 2011).
Negative associations were obtained between cortical thickness and g-residualized Vocabulary scores in the younger subsample, as well as in the full sample when age was not included as a covariate. In a previous report (Porter, Collins, Muetzel, Lim & Luciana, 2011) we described negative associations of cortical thickness with performance on the Controlled Oral Word Association Test (COWAT) in an overlapping sample of 167 individuals within the same age range (9 to 24 years) as in the current study. WASI Verbal IQ scores were included as a regression covariate in the cortical thickness mapping analysis of COWAT scores, thereby residualizing COWAT scores on a reliable estimator of g. Although the cluster results of the two studies differ, they do overlap in the prefrontal and precuneus regions of the right hemisphere and the precuneus and supramarginal regions of the left hemisphere. In the current results the cluster extending over most of the left supramarginal region corresponds well to the anatomical area directly associated with vocabulary acquisition (e.g., Lee, Devlin, Shakeshaft, Stewart, Brennan, Glensman et al., 2007).
A related finding reported by Sowell et al. (Sowell, Thompson, Leonard, Welcome, Kan, & Toga, 2004) in a longitudinal study of children initially 6.3 to 9.5 years old provides a context for interpretation of the current results. Sowell et al. (2004) retested their sample after two years (at ages 7.4 to 11.8 years) and correlated the change in cortical thickness with vocabulary change scores, which would be more independent of general intelligence than scores from a single vocabulary test. In their longitudinal analysis, vocabulary change scores were correlated with two-year decreases in cortical thickness, presumably reflective of maturational cortical gray matter “pruning,” in regions of the left prefrontal and parietal cortices. In other words, the results indicated that the more robust the cortical gray matter thinning, the greater the increase in vocabulary over a two year interval (Sowell et al., 2004). We observed a similar developmental pattern in our cross-sectional analysis of the 9 to 16 year old sample, in which participants with thinner cortex (perhaps reflecting greater pruning) had higher g-residualized vocabulary scores. This result reflects an age-limited developmental maturational influence on cortical thickness correlates of vocabulary levels. Moreover, this result does not conflict with the positive associations obtained between cortical thickness and g scores in the full sample when age was included as a regression covariate. Cortical thinning is the second phase of a two-component developmental wave that consists of cortical thickening followed by thinning, or “blooming and pruning” (see Sowell et al., 2004; Giedd et al., 1999). Eventual adult thickness values will be higher if the amplitude of the two components are correlated, i.e., if more robust thinning were proceeded by more robust thickening. In our study, the association of more robust cortical thinning with higher g-residualized Vocabulary scores in younger participants may reflect the sensitivity of this period of brain development to structured experiences with verbal language that vary across individuals in at least partial independence from level of general intelligence, e.g., the highly formalized grade-level instruction in reading that occurs in most schools. It is unclear why similar maturational effects were not expressed for g-residualized scores on other specific cognitive tests in this study, given the pervasiveness of cortical thinning demonstrated in association with age. One possible factor is that the other tests depend more on abstract reasoning and novel problem solving, and lack the age-wise (grade-wise) linear increasing learning experience that reading instruction provides for vocabulary development.
Design strengths of this study include the large sample size, the developmental nature of the sample, the use of a well-validated test instrument to assess intellectual skills, the derivation of general intelligence scores from a principal factor analysis, the residualizing of specific cognitive test scores on the derived g scores, and a statistically stringent pattern of testing for associations between cortical thickness and intellectual ability. Limitations include the limited ethnic diversity of the participant sample (albeit representative of the regional population) and the skew toward higher parental education and participant IQs. Measurement sensitivity to detect cortical thickness associations of g-independent specific cognitive abilities was limited by the use of an abbreviated test battery, which is designed to provide a brief assessment of general intellectual functioning rather than a comprehensive profile of cognitive abilities.
Additionally, whole brain mapping analysis of the type used in this study is best suited to detect effects of moderate size within relatively large regions of the brain that are geometrically similar across individuals (e.g., with respect to gyral and sulcal patterns, gray/white tissue boundaries, etc.). This detection bias is due to methodological factors such as common-space alignments of MRI data of individual participants, moderately large FWHM kernel smoothing (e.g., 15mm as in this study), and family-wise error correction based on p-value distributions build up from Monte Carlo simulations under the null hypothesis. These analytical design factors and parameters are appropriate for comprehensive exploratory brain mapping of broad behavioral domains, such as general intellectual ability, but inherently sacrifice sensitivity to effects that are smaller in regional extent and/or magnitude, such as those that may be associated with specific cognitive abilities. Developing a more comprehensive understanding of brain-based correlates of intelligence at both the general and specific levels of a hierarchical model like Carroll’s (1993) may require use of a complementary analyses with greater sensitivity to smaller regional effects, e.g., an a priori regions-of-interest analysis with statistical tests performed on values derived from a targeted sampling of unsmoothed native-space cortical thickness data.
In summary, our cortical thickness mapping results provide an independent large-sample replication of the finding of Karama et al. (2011) that general intelligence scores demonstrate pervasive mediation of positive associations of cortical thickness with performance on tests of specific cognitive abilities. The results also provide further support for distributed models of human intelligence such as the P-FIT (Jung & Haier, 2007). We identified developmental effects that included cortical thickness correlates of g-independent visual-motor problem solving ability that were observed in a later adolescence and early adulthood age range, as well as cortical thinning correlates of g-independent vocabulary performance that were observed in a late childhood and early to middle adolescence age range. Major goals for future structural brain research include identifying correlates of specific cognitive abilities that complement (rather than derive from) those associated with general intelligence, and identifying age-bounded behavioral correlates of maturational cortical thinning for specific cognitive ability domains other than word knowledge.
Supplementary Material
Highlights.
Cortical thickness is positively associated with general intelligence (g) in a wide distribution of cortical association areas in both brain hemispheres.
g-residualized specific cognitive subtest scores are not associated with cortical thickness.
Associations between cortical thickness and specific aspects of intelligence vary according to developmental stage.
Footnotes
Conflicts of Interest
The authors have no conflicts of interest to declare.
Publisher's Disclaimer: This is a PDF file of an unedited manuscript that has been accepted for publication. As a service to our customers we are providing this early version of the manuscript. The manuscript will undergo copyediting, typesetting, and review of the resulting proof before it is published in its final citable form. Please note that during the production process errors may be discovered which could affect the content, and all legal disclaimers that apply to the journal pertain.
References
- Andreasen NC, Flaum M, Swayze V, O’Leary DS, Alliger R, Cohen G, et al. Intelligence and brain structure in normal individuals. American Journal of Psychiatry. 1993;150:130–134. doi: 10.1176/ajp.150.1.130. [DOI] [PubMed] [Google Scholar]
- Axelrod B. Validity of the Wechsler abbreviated scale of intelligence and other very short forms of estimating intellectual functioning. Assessment. 2002;9:17–23. doi: 10.1177/1073191102009001003. [DOI] [PubMed] [Google Scholar]
- Carroll JB. Human Cognitive Abilities: A Survey of Factor-Analytic Studies. Cambridge University Press; 1993. [Google Scholar]
- Choi Y, Shamosh N, Cho S, DeYoung C, Lee M, Lee J, Kim S, Cho Z, Kim K, Gray J, Lee K. Multiple bases of human intelligence revealed by cortical thickness and neural activation. Journal of Neuroscience. 2008;28:10323–10329. doi: 10.1523/JNEUROSCI.3259-08.2008. [DOI] [PMC free article] [PubMed] [Google Scholar]
- Colom R, Haier R, Head K, Alvarez-Linera J, Quiroga M, Shih PC, Jung R. Gray matter correlates of fluid, crystallized, and spatial intelligence: Testing the P-FIT model. Intelligence. 2009;37:124–135. [Google Scholar]
- Colom R, Jung RE, Haier RJ. Distributed brain sites for the g-factor of intelligence. NeuroImage. 2006;31:1359–1365. doi: 10.1016/j.neuroimage.2006.01.006. [DOI] [PubMed] [Google Scholar]
- Dale AM, Fischl B, Sereno MI. Cortical surface-based analysis. I. Segmentation and surface reconstruction. Neuroimage. 1999;9:179–194. doi: 10.1006/nimg.1998.0395. [DOI] [PubMed] [Google Scholar]
- Dale AM, Sereno MI. Improved localization of cortical activity by combining EEG and MEG with MRI cortical surface reconstruction: a linear approach. Journal of Cognitive Neuroscience. 1993;5:162–176. doi: 10.1162/jocn.1993.5.2.162. [DOI] [PubMed] [Google Scholar]
- Desikan RS, Segonne F, Fischl B, Quinn BT, Dickerson BC, Blacker D, Buckner RL, Dale AM, Maguire RP, Hyman BT, Albert MS, Killiany RJ. An automated labeling system for subdividing the human cerebral cortex on MRI scans into gyral based regions of interest. Neuroimage. 2006;31:968–980. doi: 10.1016/j.neuroimage.2006.01.021. [DOI] [PubMed] [Google Scholar]
- Fischl B, Dale AM. Measuring the thickness of the human cerebral cortex from magnetic resonance images. Proceedings of the National Academy of Sciences U S A. 2000;97:11050–11055. doi: 10.1073/pnas.200033797. [DOI] [PMC free article] [PubMed] [Google Scholar]
- Fischl B, Liu A, Dale AM. Automated manifold surgery: constructing geometrically accurate and topologically correct models of the human cerebral cortex. IEEE Trans Med Imaging. 2001;20:70–80. doi: 10.1109/42.906426. [DOI] [PubMed] [Google Scholar]
- Fischl B, Salat DH, Busa E, Albert M, Dieterich M, Haselgrove C, van der Kouwe A, Killiany R, Kennedy D, Klaveness S, Montillo A, Makris N, Rosen B, Dale AM. Whole brain segmentation: automated labeling of neuroanatomical structures in the human brain. Neuron. 2002;33:341–355. doi: 10.1016/s0896-6273(02)00569-x. [DOI] [PubMed] [Google Scholar]
- Fischl B, Salat DH, van der Kouwe AJ, Makris N, Segonne F, Quinn BT, Dale AM. Sequence-independent segmentation of magnetic resonance images. Neuroimage. 2004a;23(Suppl 1):S69–84. doi: 10.1016/j.neuroimage.2004.07.016. [DOI] [PubMed] [Google Scholar]
- Fischl B, Sereno MI, Dale AM. Cortical surface-based analysis. II: Inflation, flattening, and a surface-based coordinate system. Neuroimage. 1999a;9:195–207. doi: 10.1006/nimg.1998.0396. [DOI] [PubMed] [Google Scholar]
- Fischl B, Sereno MI, Tootell RB, Dale AM. High-resolution intersubject averaging and a coordinate system for the cortical surface. Hum Brain Mapp. 1999b;8:272–284. doi: 10.1002/(SICI)1097-0193(1999)8:4<272::AID-HBM10>3.0.CO;2-4. [DOI] [PMC free article] [PubMed] [Google Scholar]
- Fischl B, van der Kouwe A, Destrieux C, Halgren E, Segonne F, Salat DH, Busa E, Seidman LJ, Goldstein J, Kennedy D, Caviness V, Makris N, Rosen B, Dale AM. Automatically parcellating the human cerebral cortex. Cerebral Cortex. 2004b;14:11–22. doi: 10.1093/cercor/bhg087. [DOI] [PubMed] [Google Scholar]
- Giedd JN, Blumenthal J, Jeffries NO, et al. Brain development during childhood and adolescence: a longitudinal MRI study. Nature Neuroscience. 1999;2(10):861–863. doi: 10.1038/13158. [DOI] [PubMed] [Google Scholar]
- Gignac GE, Vernon PA, Wickett JC. Factors influencing the relationship between brain size and intelligence. In: Nyborg H, editor. The Scientific Study of General Intelligence: Tribute to Arthur R Jensen. Oxford: Pergamon; 2003. [Google Scholar]
- Goh S, Bansal R, Xu D, Hao X, Liu J, Peterson BS. Neuroanatomical correlates of intellectual ability across the life span. Developmental Cognitive Neuroscience. 2011;1(3):305–312. doi: 10.1016/j.dcn.2011.03.001. [DOI] [PMC free article] [PubMed] [Google Scholar]
- Gur RC, Turetsky BI, Matsui M, Yan M, Bilker W, Hughett P, et al. Sex differences in brain gray and white matter in healthy young adults: correlations with cognitive performance. Journal of Neuroscience. 1999;19:4065–4072. doi: 10.1523/JNEUROSCI.19-10-04065.1999. [DOI] [PMC free article] [PubMed] [Google Scholar]
- Haier RJ, Jung RE, Yeo RA, Head K, Alkire MT. Structural brain variation and general intelligence. NeuroImage. 2004;23:425–433. doi: 10.1016/j.neuroimage.2004.04.025. [DOI] [PubMed] [Google Scholar]
- Han X, Jovicich J, Salat D, van der Kouwe A, Quinn B, Czanner S, Busa E, Pacheco J, Albert M, Killiany R, et al. Reliability of MRI-derived measurements of human cerebral cortical thickness: The effects of field strength, scanner upgrade and manufacturer. Neuroimage. 2006;32(1):180–194. doi: 10.1016/j.neuroimage.2006.02.051. [DOI] [PubMed] [Google Scholar]
- Jovicich J, Czanner S, Greve D, Haley E, van der Kouwe A, Gollub R, Kennedy D, Schmitt F, Brown G, Macfall J, Fischl B, Dale A. Reliability in multi-site structural MRI studies: effects of gradient non-linearity correction on phantom and human data. Neuroimage. 2006;30:436–443. doi: 10.1016/j.neuroimage.2005.09.046. [DOI] [PubMed] [Google Scholar]
- Jung RE, Haier RJ. The parieto-frontal integration theory (P-FIT) of intelligence: Converging neuroimaging evidence. Behavioral and Brain Sciences. 2007;30:135–154. doi: 10.1017/S0140525X07001185. [DOI] [PubMed] [Google Scholar]
- Karama S, Ad-Dab’bagh Y, Haier R, Deary I, Lyttleton O, Lepage C, Evans A Brain Development Cooperative Group. Positive association between cognitive ability and cortical thickness in a representative US sample of healthy 6 to 18 year-olds. Intelligence. 2009;37:145–155. doi: 10.1016/j.intell.2008.09.006. [DOI] [PMC free article] [PubMed] [Google Scholar]
- Karama S, Colom R, Johnson W, Deary IJ, Haier R, Waber DP, Lepage C, Ganjavi H, Jung R, Evans AC. Cortical thickness correlates of specific cognitive performance accounted for by the general factor of intelligence in healthy children aged 6 to 18. Neuroimage. 2011;55:1443–1453. doi: 10.1016/j.neuroimage.2011.01.016. [DOI] [PMC free article] [PubMed] [Google Scholar]
- Kaufman J, Birmaher B, Brent D, Rao U, Ryan N. Kiddie-SADS-Present and Lifetime (K-SADS-PL) Version 1.0. Pittsburgh, PA: University of Pittsburgh School of Medicine, Western Psychiatric Institute and Clinics; 1996. [Google Scholar]
- Lee H, Devlin JT, Shakeshaft C, Stewart LH, Brennan A, Glensman J, Pitcher K, Crinion J, Mechelli A, Frackowiak RS, Green DW, Price CJ. Anatomical traces of vocabulary acquisition in the adolescent brain. Journal of Neuroscience. 2007;27:1184–1189. doi: 10.1523/JNEUROSCI.4442-06.2007. [DOI] [PMC free article] [PubMed] [Google Scholar]
- Luciana M, Collins PF, Olson EA, Schissel AM. Tower of London performance in healthy adolescents: The development of planning skills and associations with self-reported inattention and impulsivity. Developmental Neuropsychology. 2009;34(4):461–475. doi: 10.1080/87565640902964540. [DOI] [PMC free article] [PubMed] [Google Scholar]
- Luders E, Narr K, Thompson P, Toga A. Neuroanatomical correlates of intelligence. Intelligence. 2009;37:156–163. doi: 10.1016/j.intell.2008.07.002. [DOI] [PMC free article] [PubMed] [Google Scholar]
- MacLullich AM, Ferguson KJ, Deary IJ, Seckl JR, Starr JM, Wardlaw JM. Intracranial capacity and brain volumes are associated with cognition in healthy elderly men. Neurology. 2002;59:169–174. doi: 10.1212/wnl.59.2.169. [DOI] [PubMed] [Google Scholar]
- McDaniel MA. Big-brained people are smarter: A meta-analysis of the relationship between in vivo brain volume and intelligence. Intelligence. 2005;33:337–346. [Google Scholar]
- Muetzel R, Collins PF, Mueller B, Lim K, Luciana M. The development of corpus callosum microstructure and associations with bimanual task performance in healthy adolescents. Neuroimage. 2008;39(4):1918–1925. doi: 10.1016/j.neuroimage.2007.10.018. [DOI] [PMC free article] [PubMed] [Google Scholar]
- Narr KL, Woods RP, Thompson PM, Szeszko P, Robinson D, Dimtcheva T, et al. Relationships between IQ and regional cortical gray matter thickness in healthy adults. Cerebral Cortex. 2007;17:2163–2171. doi: 10.1093/cercor/bhl125. [DOI] [PubMed] [Google Scholar]
- Olson EA, Collins PF, Hooper CJ, Muetzel R, Lim KO, Luciana M. White matter integrity predicts delay discounting behavior in adolescents: a diffusion tensor imaging study. Journal of Cognitive Neuroscience. 2009;21(7):1406–1421. doi: 10.1162/jocn.2009.21107. [DOI] [PMC free article] [PubMed] [Google Scholar]
- Porter JN, Collins PF, Muetzel RL, Lim KO, Luciana M. Associations between cortical thickness and verbal fluency in childhood, adolescence, and young adulthood. Neuroimage. 2011;55:1865–1877. doi: 10.1016/j.neuroimage.2011.01.018. [DOI] [PMC free article] [PubMed] [Google Scholar]
- Posthuma D, de Geus EJ, Baare WF, Hulshoff Pol HE, Kahn RS, Boomsma DI. The association between brain volume and intelligence is of genetic origin. Nature Neuroscience. 2002;5:83–84. doi: 10.1038/nn0202-83. [DOI] [PubMed] [Google Scholar]
- Reiss AL, Abrams MT, Singer HS, Ross JL, Denckla MB. Brain development, gender and IQ in children. A volumetric imaging study. Brain. 1996;119(Pt 5):1763–1774. doi: 10.1093/brain/119.5.1763. [DOI] [PubMed] [Google Scholar]
- Segonne F, Dale AM, Busa E, Glessner M, Salat D, Hahn HK, Fischl B. A hybrid approach to the skull stripping problem in MRI. Neuroimage. 2004;22:1060–1075. doi: 10.1016/j.neuroimage.2004.03.032. [DOI] [PubMed] [Google Scholar]
- Segonne F, Pacheco J, Fischl B. Geometrically accurate topology-correction of cortical surfaces using nonseparating loops. IEEE Trans Med Imaging. 2007;26:518–529. doi: 10.1109/TMI.2006.887364. [DOI] [PubMed] [Google Scholar]
- Sowell ER, Thompson PM, Leonard CM, Welcome SE, Kan E, Toga AW. Longitudinal mapping of cortical thickness and brain growth in normal children. Journal of Neuroscience. 2004;24(38):8223–8231. doi: 10.1523/JNEUROSCI.1798-04.2004. [DOI] [PMC free article] [PubMed] [Google Scholar]
- Spearman C. “General intelligence” objectively determined and measured. American Journal of Psychology. 1904;15:201–293. [Google Scholar]
- Talairach J, Tournoux P. Co-Planar Stereotactic Atlas of the Human Brain. Georg Thieme Verlag/Thieme Medical Publishers; Stuttgart, New York: 1988. [Google Scholar]
- Wechsler D. Manual for the Wechsler Abbreviated Scale of Intelligence. San Antonio, TX: The Psychological Corporation; 1999. [Google Scholar]
- Wickett JC, Vernon PA, Lee DH. Relationships between factors of intelligence and brain volume. Personality and Individual Differences. 2000;29:1095–1122. [Google Scholar]
- Wilke M, Sohn JH, Byars AW, Hollanda SK. Bright spots: correlations of gray matter volume with IQ in a normal pediatric population. Neuroimage. 2003;20:202–215. doi: 10.1016/s1053-8119(03)00199-x. [DOI] [PubMed] [Google Scholar]
- Witelson SF, Beresh H, Kigar DL. Intelligence and brain size in 100 postmortem brains: sex, lateralization and age factors. Brain. 2006;129:386–398. doi: 10.1093/brain/awh696. [DOI] [PubMed] [Google Scholar]
- Woodcock RW, McGrew KS, Mather N. Woodcock–Johnson III Tests of Achievement. Riverside Publishing; Itasca, Illinois: 2001. [Google Scholar]
Associated Data
This section collects any data citations, data availability statements, or supplementary materials included in this article.