Abstract
Study Objectives:
This study investigated the minimum recording time needed during out-of-center sleep testing (OCST) to accurately diagnose the presence and severity of obstructive sleep apnea (OSA).
Design and Setting:
A retrospective analysis was conducted of OCSTs performed from October 2009 to May 2012 at the Mayo Clinic Center of Sleep Medicine using the portable Embletta™ system.
Patients or Participants:
Demographic information was collected for patients who underwent OCSTs during the study period, including presenting symptoms, examination findings, and comorbidities.
Intervention:
Each study was divided into 60-, 120-, 180-, 240-, 300-, 360-, and 420-min intervals beginning at the recording start time to determine the respiratory event index (REI) for each of these time intervals. These interval values were then compared to the original REI derived from the total recording time (REITRT) by a paired t-test and concordance correlation coefficient (CCC).
Measurements and Results:
There were significant differences between the REITRT and the REI from the 60-min (P < 0.0001), 120-min (0.0001), 180-min (0.003) and 240-min (0.006) intervals with a lack of concordance, suggesting these intervals are poor diagnostic correlates for the REITRT. REIs determined at 300, 360, and 420 min were not significantly different from the REITRT and had highly significant CCCs, 0.963, 0.987, and 0.995, respectively.
Conclusions:
The results suggest that at least 300 min recording time during out-of-center sleep testing is needed for accurate diagnosis of obstructive sleep apnea and determination of obstructive sleep apnea severity.
Citation:
Wittine LM, Olson EJ, Morgenthaler TI. Effect of recording duration on the diagnostic accuracy of out-of-center sleep testing for obstructive sleep apnea. SLEEP 2014;37(5):969-975.
Keywords: home sleep test, obstructive sleep apnea, out-of-center sleep test
INTRODUCTION
Obstructive sleep apnea (OSA) is a relatively common disorder, with a prevalence ranging from 3–17% in the general population.1,2 It is a risk factor for several other potentially disabling conditions, including stroke,3 cardiovascular disease,4 atrial fibrillation,5,6 hypertension,7 and daytime sleepiness that can result in motor vehicle accidents or work-related injuries.8 Untreated OSA is not only associated with significant morbidity9,10 but also with increased health care costs estimated in the billions of dollars.11 There is a need for timely, accessible, accurate, and cost-effective testing.
Several out-of-center sleep tests (OCSTs) have been validated to diagnose OSA in patients without comorbid medical conditions and who have a high pretest probability of having moderate to severe OSA.12–14 These portable devices are increasingly being used as an alternative to laboratory-based, attended polysomnography and touted for their low cost and the convenience of testing. However, technical difficulties can occur during the course of these unattended studies, such as channel failure or disconnection of sensors that results in poor-quality data or lost data in 5.6–39% of studies.15,16 Incomplete information may ultimately limit the utility, expedience, and cost benefit of home sleep studies.
The minimum recording time to project an accurate diagnosis of OSA has not yet been established for OCST devices. The literature on home sleep tests reports a wide range of recording times from 250 to 390 or more min of data used to diagnose OSA.15,17 The purpose of this study is to determine the minimum recording time required to accurately diagnose OSA during unattended type 3 OCSTs.
METHODS
After obtaining approval from the Mayo Clinic Institutional Review Board (IRB 12-007702), a retrospective analysis was conducted of 140 consecutive unattended OCSTs performed through the Center for Sleep Medicine at the Mayo Clinic from October 2009 to May 2012. Only studies with the original technician-scored data available were included in this analysis. Studies with 3 h or less of recording time were excluded. Of the 140 OCSTs performed, 129 studies met these criteria. Two studies were excluded because the total recording time (TRT) was less than 3 h. The remaining nine studies were not included because the scored data was not retained on our computer server. For the 129 complete studies, a chart review was performed to obtain demographic information including age, sex, presenting clinical features (snoring, witnessed apneas, Epworth Sleepiness Scale score), pertinent examination findings (body mass index [BMI], neck circumference, Freidman oropharynx classification),18 and comorbid medical conditions.
Out-of-Center Sleep Test Measurements
All OCSTs were performed using the Embletta system™ (Kanata, ON), which has previously been validated for patients with suspected OSA.19 Measurements obtained included nasal pressure (Salter Labs, Arvin, CA), airflow by thermistor (Salter Labs), respiratory effort by impedance plethysmography (Embla, Broomfield, CO), sonography, and finger pulse oximetry. The Embletta devices were programmed to automatically begin recording at 22:00 and stop at 06:00. Based on sleep logs and OCST actigraphy (an intrinsic component of the Embletta system), the scoring technologist modified the analysis start time and end time, resulting in a TRT that attempted to approximate total sleep time (TST) as closely as possible. Respiratory events (apneas and hypopneas) were scored according to the American Academy of Sleep Medicine (AASM) Scoring Manual.20 The total number of respiratory events was divided by the TRT to determine the respiratory event index (REITRT). The scored respiratory events and REITRT were established during the original testing for diagnostic purposes and were not manipulated during this study. For the purpose of this study, the REITRT was used as the diagnostic standard against which shorter time intervals were compared.
By maintaining the same analysis start time as the original study, but stopping the analysis after the first 60 min, the REI was calculated for this time interval using the number of respiratory events that occurred during the first hour of the study and dividing this by the new recording period of 60 min. This resulted in the REI for the first hour of the recording period (REI60). Each study was reanalyzed at 60-, 120-, 180-, 240-, 300-, 360-, and 420-min time intervals from the original start time, resulting in corresponding REIs for each time interval (REI60, REI120, REI180, REI240, REI300, REI360, and REI420).
In addition, each OCST was manually reviewed to find the “best 2 hours” of continuous data that were most free of motion artifact. The “best 2 hours” of data were determined by condensing the recording time into 2-h intervals, and examining each interval for the lack of movement (determined from actigraphy) and equipment artifact as well as position stability as surrogate markers for uninterrupted sleep. The REIBEST was calculated by dividing the number of respiratory events that occurred during these “best 2 hours” and dividing by 120 min; this was also compared with the REITRT.
Any malfunctions that occurred during the OCSTs were recorded, including the nature of the difficulty, the length of time the signal was lost or inadequate, and when the failure occurred during the course of the study. Any malfunction lasting longer than 2 h was considered potentially significant because it reduced the valid recording time to less than 6 h.
Data Analysis
The REITRT established during the original OCST was compared with the REI calculated for each time interval (REI60, REI120, REI180, REI240, REI300, REI360, REI420 and REIBEST). Statistical analysis was performed using a paired t-test (with P < 0.05 considered significant) as well as a Bland-Altman analysis. Correlation and agreement of each time interval REI with the REITRT was determined using the concordance correlation coefficient (CCC), where CCC ≥ 0.95 was considered strong correlation (excellent or substantial concordance according to the analysis method of McBride).21,22
The data were then further stratified based on the original REITRT into those diagnosed with mild (REI 5-14), moderate (REI 15-29), and severe (REI ≥ 30) OSA. The sensitivity and specificity was calculated for each time point for the endpoints of REI ≥ 5 and REI ≥ 15.
To determine if data loss due to significant malfunction affected the comparison of the REITRT to each time interval (REI60, REI120, REI180, REI240, REI300, REI360, and REI420), these calculations were repeated after the studies with significant data compromise were removed from the analysis.
Statistical Analysis
Normally distributed data are presented as the mean ± standard deviation, whereas nonnormally distributed data are presented as the median (25th-75th percentile). To determine an appropriate sample size, estimates of Lin concordance coefficient and variance term were obtained using the first 25 studies as preliminary data. For the agreement between REI120 versus REITRT, which was estimated to have a CCC of 0.922 with a variance term of 0.9214, a sample size of 100 was needed to yield a lower limit of 0.894 from a one-sided 95% confidence interval. Based on this, our total sample of size of n = 129 would achieve even greater precision in the CCC analysis. JMP® 9.0.1 software (SAS Institute Inc., Cary, NC) was used for all analyses except the determination of the CCC, which required MedCalc® version 12.1.3.0 software (Medcalc Software, Ostend, Belgium).
RESULTS
Demographics
Of the 129 patients undergoing OCSTs, 80 (62%) were male and 49 (38%) were female. There were no significant differences between male and female patients, except that males had more witnessed apneas (P = 0.004) and larger neck circumferences (P < 0.0001), whereas the mean BMI was greater for females (P < 0.0001).
The mean age at the time of the OCST was 52.3 ± 12 y. On clinical presentation, the mean Epworth Sleepiness Scale score was 8 ± 4.3; 94% had a presenting complaint of snoring, and 49% had witnessed apneas. The mean BMI was 35.1 ± 7.6, the mean neck circumference was 42.3 ± 4.3 cm, and the majority of patients (82%) had a crowded posterior oropharynx (Friedman 3 or 4) using the Friedman scoring system.18 Sixty-six percent of the patients had a screening overnight oximetry performed as part of their clinical evaluation.
Comorbid cardiac disease included hypertension (n = 63, 49%) atrial fibrillation/supraventricular tachycardia (n = 7, 5%), coronary artery disease (n = 12, 9%), or diastolic dysfunction (n = 1, 0.8%). Pulmonary comorbidities included asthma (n = 10, 8%) and mild chronic obstructive pulmonary disease (n = 2, 2%).
Baseline OCST Measurements
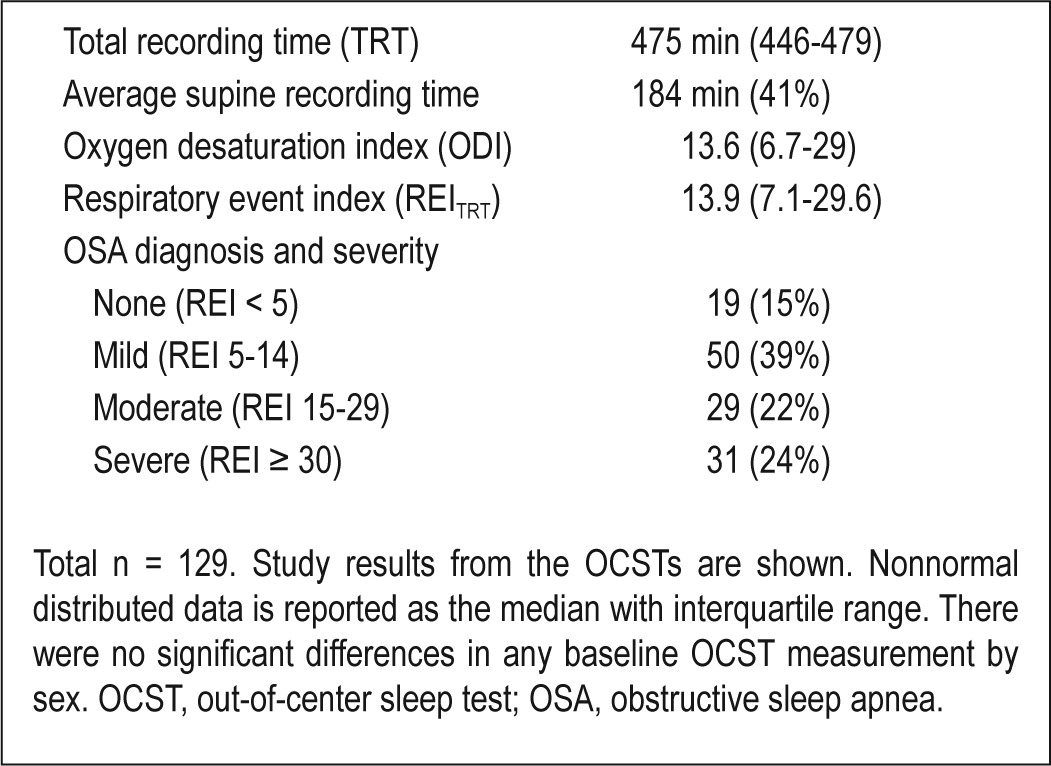
Data measurements from the original OCSTs are summarized in Table 1. TRTs of at least 6 h were achieved during 126 of the OCSTs (98%) and at least 7 h were captured in 112 (85%). The diagnosis of OSA was made in 110 patients (85%).
Table 1.
Baseline out-of-center sleep test measurements
Analysis of the Truncated Recording Intervals
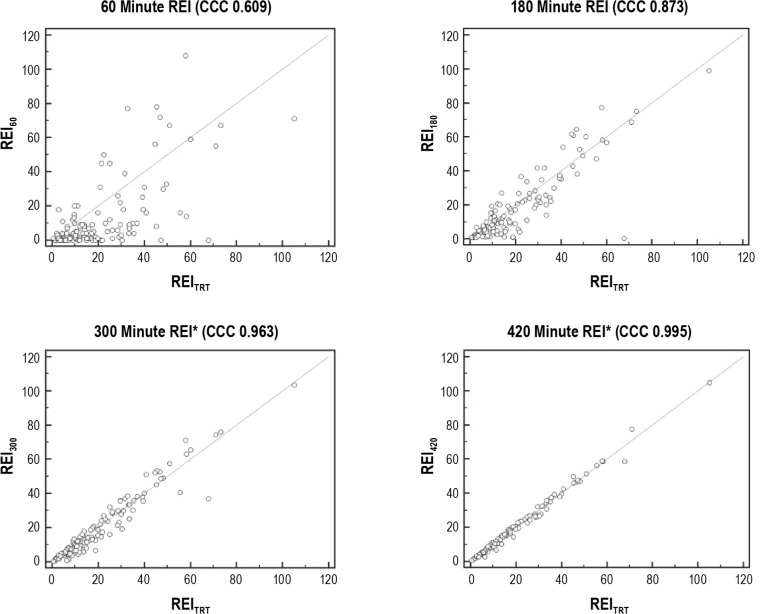
There were significant differences between the REIs obtained during the 60-min (P < 0.0001), 120-min (P = 0.0001), 180-min (P = 0.003), and 240-min (0.006) time intervals compared with the REITRT, indicating that a REI obtained during the first 4 h of the OCST recording period poorly reflected the final REI from a full night recording. Accordingly, there was poor correlation and agreement between the REI60 (CCC = 0.609), REI120 (CCC = 0.825), REI180 (CCC = 0.873), REI240 (CCC = 0.929), and the REITRT. The REI300 was not significantly different from the REITRT (P = 0.10) and there was strong agreement and correlation between these values (CCC = 0.963). Additional hours of recording only strengthened this correlation: REI360 (P = 0.20, CCC = 0.987) and REI420 (P = 0.71, CCC = 0.995). This is depicted in Figures 1 and 2.
Figure 1.
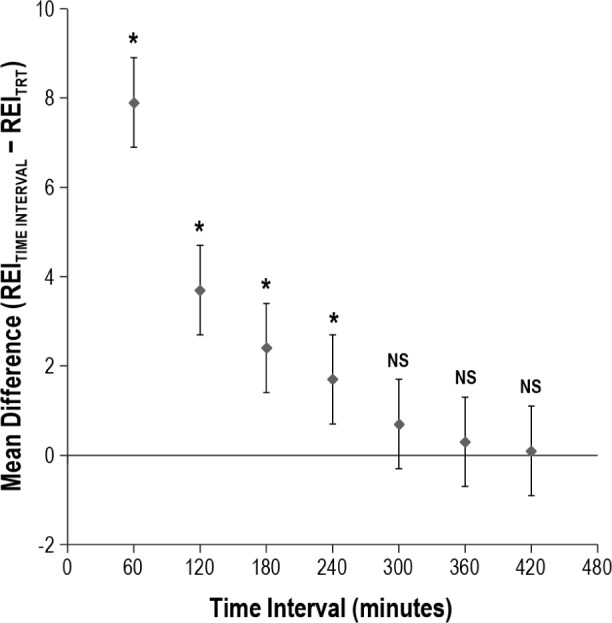
Plot of mean difference between the respiratory event index (REI) at each time interval and the REI for the total recording time (REITRT). The mean difference between the REI measured at each time interval and the REITRT is plotted for each respective time interval. Statistical significance is denoted by the asterisk.
Figure 2.
Scatterplots for the respiratory event index (REI) at each time interval versus the REI for the total recording time (REITRT). The concordance correlation coefficient (CCC) measures the amount of variation from the y = x line and ranges from -1 to 1, where 1 is perfect positive agreement and 0 is no agreement. The scatterplots for the 60-, 180-, 300-, and 420-min intervals demonstrate improving agreement with increasing recording time duration. Strong concordance is denoted by the asterisk.
Sensitivity and Specificity Based on OSA Severity
The diagnosis of OSA involves a categorization of OSA by severity based on the REITRT into no OSA (REI < 5), mild (REI 5-14), moderate (REI 15-29), and severe (REI ≥ 30). Our data were examined to determine how the derived REI at each time interval may have changed the diagnosis or severity classification. Figure 3 depicts the number of patients that would have been misclassified by the interval REI when compared with the final diagnosis and severity based on the REITRT. At each time interval, most misclassifications occurred because the REI underestimated the final REI disease state, but improved with each additional hour of recording included in the analysis.
Figure 3.
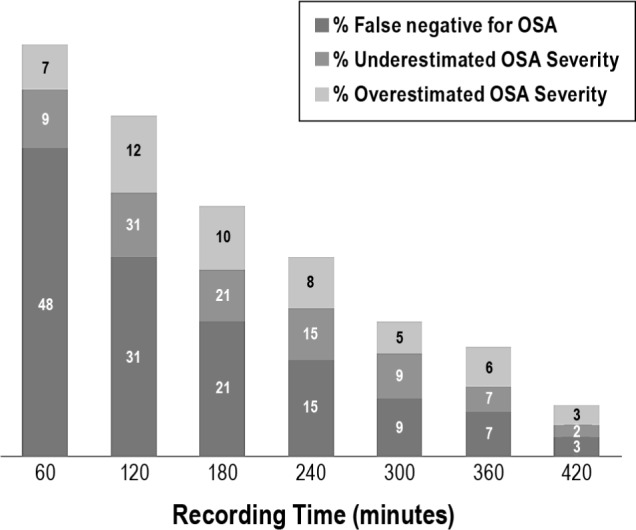
Misclassification of obstructive sleep apnea (OSA) presence and severity as a function of hour(s) studied. The respiratory event index (REI) measured at each time interval was compared with the final REITRT for each patient to determine whether the measured REI would have rendered a diagnosis or severity classification different from the REITRT. If the misclassification would have resulted in a reduced severity designation, it was considered an underestimate. The most extreme underestimate is a false negative, which is shown distinctly from those that underestimated disease severity. Conversely, if the misclassification would have resulted a false positive diagnosis of OSA or a higher severity level, these were both considered an overestimate. TRT, total recording time.
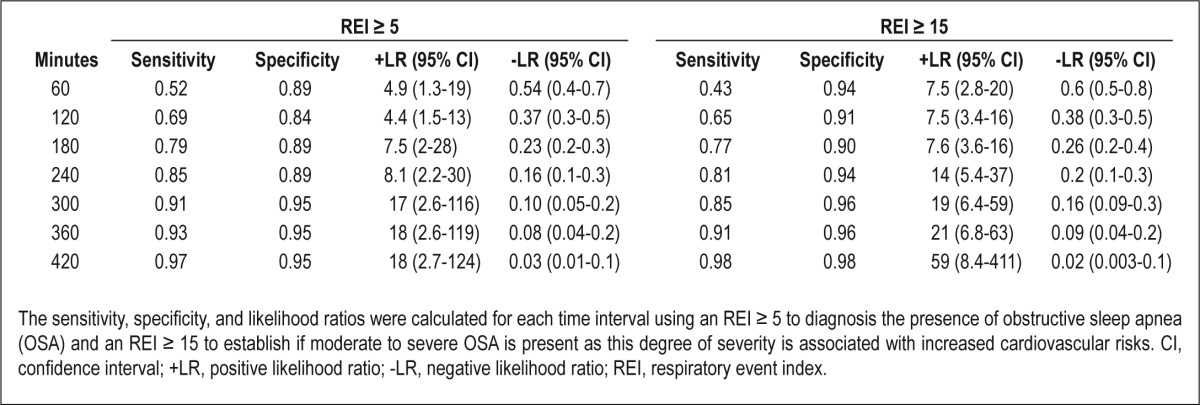
Because a REI ≥ 5 is used to establish the diagnosis OSA, the sensitivity and specificity for this cutoff was determined for each time interval. A recording time of 300 min, which is the point where significant agreement and correlation with the REITRT was observed, resulted in a sensitivity of 91% and specificity of 95% for determining the presence of OSA. This is detailed in Table 2. Sensitivities and specificities were also calculated for each time interval for a REI ≥ 15. A 300-min recording time achieves a sensitivity of 85% and specificity of 96% for an REI ≥ 15. Sensitivities and specificities improved further with each additional hour of recording time for both endpoints analyzed (Table 2).
Table 2.
Sensitivity and specificity for determining the presence of obstructive sleep apnea (respiratory event index ≥ 5) and moderate to severe obstructive sleep apnea (respiratory event index ≥ 15)
“Best 2 Hours”
For each OCST performed, the best 2 contiguous hours of recording were selected as described in the Methods section. This could not be determined for four of the studies because there was movement detected continuously through the night. Figure 4 demonstrates the distribution of these 2-h periods, which do not appear to aggregate specifically to any portion of the recording. For the 125 studies with a “best 2 hours” period, the REIBEST was calculated and found to be significantly different from the REITRT with a mean difference of 2.16 (0.6–3.7, P = 0.007) and lacking correlation and agreement (CCC = 0.885) per Figure 5. This was only slightly better correlation and agreement than for the first 120 min of the recording (CCC = 0.825). We also explored our data to determine if there was any significant difference in the REI according to any 1 hour of recording (not selected best 1-h segments) by dividing the data into 60-min intervals and calculating the mean and median REI for each interval. We found that there was no significant difference in REI between hours of recording (data shown in supplemental material in Table S1 and Figure S1).
Figure 4.
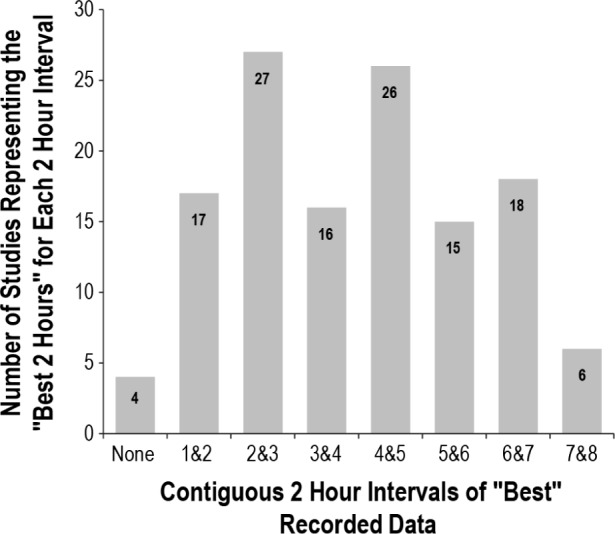
Distribution of the “best 2 hours” during the recording period This represents the distribution of the “best contiguous 2 hours” chosen out of the total recording time. For example, the 17 studies listed for “1 & 2” means that the best 2 hours occurred during the first and second hours of the recording for those studies.
Figure 5.
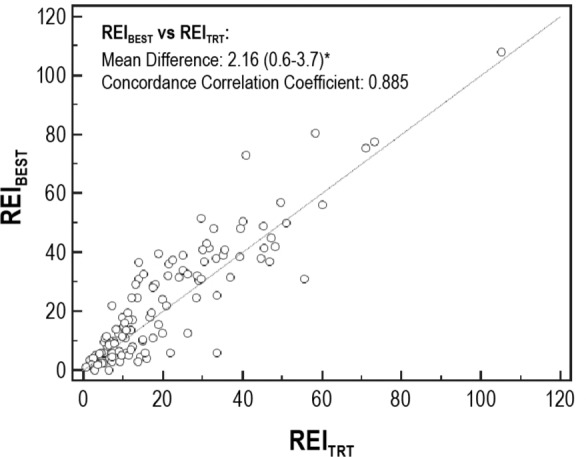
Scatterplot of the respiratory event index for the “best 2 hours” (REIBEST) versus the REI for the total recording time (REITRT). This scatterplot demonstrates the weak correlation between the REIBEST and REITRT with the results straying from the y = x line, with a concordance correlation coefficient of 0.885, which is not strongly concordant. Statistical significance is denoted by the asterisk.
Data Analysis for Valid and Complete Studies
Thirty-three studies (26%) had lost or incomplete data due to malfunctioning monitors or loose leads in the unattended setting. The types of malfunction that occurred included oximetry loss (n = 13), nasal flow loss (n = 13), multichannel loss (n = 5), and dead battery (n = 2). Twenty-two studies (17%) had significant data loss where the study was terminated with less than 6 h TRT or led to less than 6 h of valid data being obtained.
When these 22 studies were excluded, analysis of the remaining OCSTs still demonstrated that a minimum of 300 min recording time was necessary for strong correlation and agreement with the REITRT (P = 0.08, CCC = 0.969). When all 33 studies with any missing data were removed from the analysis, nearly identical findings were obtained, with 300 min of recording time needed to ensure appropriate accuracy, correlation, and agreement (P = 0.19, CCC = 0.972).
DISCUSSION
OCSTs are an increasingly utilized diagnostic instrument for OSA. Although many OCSTs have been validated by comparison to laboratory-based polysomnography, information regarding the optimal recording time of an OCST to ensure diagnostic accuracy is lacking. Our study shows that when performing an OCST, obtaining at least 300 min of recording time should allow conclusions to be drawn regarding the presence and severity of OSA that are not significantly different from those obtained with longer recordings (Figure 1). Shorter intervals, even the “best” intervals, may lead to misclassification, mostly because of an underestimation of severity more than 23% of the time. Other than our results, one other study found that time in bed less than 390 min was associated with a significantly larger mean difference between the OCST REI and the polysomnography apnea-hypopnea index (AHI), but no specific conclusions were drawn regarding the minimum OCST recording time necessary for accuracy.17
Determining an optimal OCST recording time is especially critical when an unattended study has been affected by loss of data from technical failure or sensor displacement. How these losses affect the integrity of the test's outcome has not been systematically evaluated. Doubt in the validity of OCST findings may result in an OCST being repeated or transitioned to an attended polysomnography, which increases delays in and costs of care. Our study attempts to bring clarity to this issue showing that obtaining at least 300 min of valid recording time provides results significantly similar to longer recordings.
Even positive tests with shorter recording times might suffice to rule in OSA, assuming that the likelihood ratio adds enough to the pretest probability to ensure a posttest probability of at least 90%.23 Patients undergoing OCSTs should already have a high pretest probability (greater than 50%) for OSA. For example, a patient with a 70-80% pretest probability of having moderate to severe OSA has a positive OCST with 240 min of recording; this yields a likelihood ratio of 8.1, and provides a 95% posttest probability of OSA.13 But, as demonstrated in this study, shorter recording intervals underestimate severity 23-57% of the time (Figure 3), and this needs to be taken into account when counseling a patient regarding the cardiovascular morbidity associated with their OSA diagnosis.
Three hundred min of recording time needed for OCSTs is much greater than the 120 min of TST needed during split-night laboratory-based polysomnography to accurately reflect a full-night polysomnography result.24 Given the prior work regarding split-night studies, the most undisturbed, contiguous 2 h of recording time were chosen based on the actigraphy as a surrogate marker of steady sleep. However, even when the most intact 2 h of data were analyzed, the REIBEST did not lead to a reliable conclusion regarding the presence or severity of OSA. Therefore, longer recording times are necessary for OCSTs than for laboratory-based polysomnography to ensure the accurate diagnosis and severity of OSA. The reason for this may be that OCSTs do not directly assess for sleep, so the TRT may be much larger than TST, especially during the early parts of the recording period. A longer recording duration may be required to overcome this inherent limitation of OCSTs. It also may be possible that the frequency of respiratory events is different between the home environment and sleep laboratory because of positionality or a heightened vigilance of the patient during OCSTs that does not allow for the same continuity and depth of sleep.
Our study has several strengths. Our patient population is typical of those referred to a sleep center for consideration of sleep testing. There was no manipulation of the original technician scoring of respiratory events for each study, so no bias could be introduced in the scoring of respiratory events at the various time intervals analyzed. Because the studies were performed solely for clinical purposes to render a decision regarding the presence and severity of OSA, our results should be clinically applicable. Most patients (98%) had 6 h or more of recording time and 85% had 7 h or more. Even when all studies that had potentially been compromised by malfunctioning equipment were removed from the analysis, we were still able to demonstrate that a minimum of 5 h of recording time is necessary.
A limitation of this study is that it used the REITRT as the gold standard to compare with the interval REIs and not a polysomnography-generated AHI. Because the validation of the Embletta OCST did not demonstrate a significant difference in the REI from the polysomnography AHI,19 we are assuming for the purposes of this study that the original REITRTs were adequate to establish an accurate diagnosis of OSA. Because respiratory events are likely unevenly distributed across the recording period, an analysis starting at the beginning of the night may be different from that toward the end of the night. The time intervals chosen for analysis during this study were not chosen randomly during the night, but instead began at the beginning of the night and were truncated early at the time intervals listed in our methods. This methodology was chosen based on our assumption that data loss is more likely to occur during the middle to end of the night as sensors became detached, rather than the signal starting poorly and regaining signal quality by the end of the study. Relatively few OCSTs were performed during the more than 2.5 y of the study period, indicating a slow adoption of this testing strategy in our institution and may account for our high data loss.
Because OSA is a common disorder associated with several disease states, as well as diminished quality of life and a large health care burden, timely diagnosis with accurate identification of disease severity is paramount. Our study indicates that when using OCSTs to establish the diagnosis of OSA, 300 min of quality recording time should suffice to rule in OSA. The importance of these findings stems from the realization that data loss will occur during unattended testing. Valid recording times less than 300 min should prompt careful clinical consideration to either repeat the testing or careful assessment of the posttest probability of a positive study ruling in OSA.
DISCLOSURE STATEMENT
This was not an industry supported study. The Mayo Clinic Center for Translational Science Activities (CTSA), which is supported by Grant Number UL1 TR000135 from the National Center for Advancing Translational Sciences (NCATS), assisted in data analysis. The contents of this paper are solely the responsibility of the authors and do not necessarily represent the official views of the National Institutes of Health. The authors have indicated no financial conflicts of interest. Research was performed at the Mayo Clinic, Rochester, MN.
ACKNOWLEDGMENTS
The authors are grateful to Thomas Finstuen for assistance in accessing and analyzing the OCST results, and to Nancy Slocumb for assistance in data organization.
SUPPLEMENTAL MATERIAL
In home sleep testing, it is typical for data failure to occur some time after the study is begun rather than various segments where the data are lost (for example, a good 1 hour followed by a loss of 2 hours, and subsequently uncompromised data for an additional 4 hours. This possibility, though infrequent, may prompt the desire to determine if there are significant predictable differences in the respiratory event index (REI) according to the hour of recording. We performed two analyses to explore this. In Table S1, the mean and median REI for all tests according to the hour of study are shown. We found no significant differences in REI across hour of recording (the standard deviation and interquartile range overlap). In addition, we graphed the cumulative apneas and hypopneas by hour of study (Figure S1). This shows a nearly perfect line (R2 = 0.99822), indicating that there is no particular REI rate in any given hour that is likely to be different from another. These data, combined with the prior analysis (in the manuscript) that at least 5 hours of recording are required, suggest that any 5 hours of valid data should approximate what would be found should ≥ 5 hours of recording be obtained.
Mean and median respiratory event index and total number of apneas and hypopneas at each hour of the recording
Cumulative apneas and hypopneas by hour of recording. Depicted are the cumulative apneas and hypopneas by hour of recording for all tests in the solid blue line, and the linear fit in the dashed line. The line is extremely linear (R2 = 0.99822), indicating that there is no significant difference in the rate of respiratory events by hour of recording.
REFERENCES
- 1.Peppard P, Young T, Barnet J, Palta M, Hagen E, Hia KM. Increased prevalence of sleep-disordered breathing in adults. Am J Epidemiol. 2013;177:1006–14. doi: 10.1093/aje/kws342. [DOI] [PMC free article] [PubMed] [Google Scholar]
- 2.Young T, Palta M, Dempsey J, Peppard PE, Neito FJ, Hla KM. Burden of sleep apnea: rationale, design, and major finding of the Wisconsin Sleep Cohort Study. Wisc Med J. 2009;108:246–9. [PMC free article] [PubMed] [Google Scholar]
- 3.Yaggi HK, Concato J, Kernan WN, Lichtman JH, Brass LM, Mohsenin V. Obstructive sleep apnea as a risk factor for stroke and death. N Engl J Med. 2005;353:2034–41. doi: 10.1056/NEJMoa043104. [DOI] [PubMed] [Google Scholar]
- 4.Peker Y, Hedner J, Norum J, Kraiczi H, Carlson J. Increased incidence of cardiovascular disease in middle-aged men with obstructive sleep apnea. AmJ Respir Crit Care Med. 2002;166:159–65. doi: 10.1164/rccm.2105124. [DOI] [PubMed] [Google Scholar]
- 5.Gami AS, Pressman G, Caples SM, et al. Association of atrial fibrillation and obstructive sleep apnea. Circulation. 2004;110:364–7. doi: 10.1161/01.CIR.0000136587.68725.8E. [DOI] [PubMed] [Google Scholar]
- 6.Gami AS, Hodge DO, Herges RM, et al. Obstructive sleep apnea, obesity, and the risk of incident atrial fibrillation. J Am Coll Cardiol. 2007;49:565–71. doi: 10.1016/j.jacc.2006.08.060. [DOI] [PubMed] [Google Scholar]
- 7.Peppard PE, Young T, Palta M, Skatrud J. Prospective Study of the Association between Sleep-Disordered Breathing and Hypertension. N Engl J Med. 2000;342:1378–84. doi: 10.1056/NEJM200005113421901. [DOI] [PubMed] [Google Scholar]
- 8.Rodenstein D. Sleep apnea: traffic and occupational accidents—individual risks, socioeconomic and legal implications. Respiration. 2009;78:241–8. doi: 10.1159/000222811. [DOI] [PubMed] [Google Scholar]
- 9.Marin JM, Carrizo SJ, Vicente E, Agusti AGN. Long-term cardiovascular outcomes in men with obstructive sleep apnea-hypopnea with or without treatment with continuous positive airway pressure: an observational study. Lancet. 2005;365:1046–53. doi: 10.1016/S0140-6736(05)71141-7. [DOI] [PubMed] [Google Scholar]
- 10.Marshall NS, Wong KKH, Liu PY, Cullen SRJ, Knuiman MW, Grunstein RR. Sleep apnea as an independent risk factor for all-cause mortality: The Busselton Health Study. Sleep. 2008;31:1079–85. [PMC free article] [PubMed] [Google Scholar]
- 11.Kapur V, Blough DK, Sandblom RE, et al. The medical cost of undiagnosed sleep apnea. Sleep. 1999;22:749–55. doi: 10.1093/sleep/22.6.749. [DOI] [PubMed] [Google Scholar]
- 12.Flemons WW, Littner MR, Rowley JA, et al. Home diagnosis of sleep apnea: a systematic review of the literature. Chest. 2003;124:1543–79. doi: 10.1378/chest.124.4.1543. [DOI] [PubMed] [Google Scholar]
- 13.Collop NA, Tracy SL, Kapur V, et al. Obstructive sleep apnea devices for out-of-center (OOC) testing: technology evaluation. J Clin Sleep Med. 2001;7:531–48. doi: 10.5664/JCSM.1328. [DOI] [PMC free article] [PubMed] [Google Scholar]
- 14.Portable Monitoring Task Force of American Academy of Sleep Medicine. Clinical guidelines for the use of unattended portable monitors in the diagnosis of obstructive sleep apnea in adult patients. J Clin Sleep Med. 2007;3:737–47. [PMC free article] [PubMed] [Google Scholar]
- 15.Yin M, Miyazaki S, Ishikawa K. Evaluation of type 3 portable monitoring in unattended home setting for suspected sleep apnea: factors that may affect its accuracy. Otolaryngol Head Neck Surg. 2006;134:204–9. doi: 10.1016/j.otohns.2005.10.019. [DOI] [PubMed] [Google Scholar]
- 16.Oliveira MG, Nery LE, Santos-Silva R, et al. Is portable monitoring accurate in the diagnosis of obstructive sleep apnea in chronic pulmonary obstructive cisease? Sleep Med. 2012;13:1033–8. doi: 10.1016/j.sleep.2012.06.011. [DOI] [PubMed] [Google Scholar]
- 17.Michaelson PG, Allan P, Chaney J, Mair EA. Validations of a portable home sleep study with twelve-lead polysomnography: comparisons and insights into a variable gold standard. Ann Otol RhinolLaryngol. 2006;115:802–9. doi: 10.1177/000348940611501102. [DOI] [PubMed] [Google Scholar]
- 18.Friedman M, Schalch P. Surgery of the palate and oropharynx. Otolaryngol Clin North Am. 2007;40:829–43. doi: 10.1016/j.otc.2007.04.010. [DOI] [PubMed] [Google Scholar]
- 19.Ng SSS, Chan T, To K, et al. Validation of Embletta Portable Diagnostic System for identifying patients with suspected obstructive sleep apnea syndrome (OSAS) Respirology. 2010;15:336–42. doi: 10.1111/j.1440-1843.2009.01697.x. [DOI] [PubMed] [Google Scholar]
- 20.Iber C, Ancoli-Israel S, Chesson A, Quan SF for the American Academy of Sleep Medicine. Westchester, IL: American Academy of Sleep Medicine; 2007. The AASM manual for the scoring of sleep and associated events: rules, terminology and technical specifications. [Google Scholar]
- 21.Lin LI. A concordance correlation coefficient to evaluate reproducibility. Biometrics. 1989;45:255–68. [PubMed] [Google Scholar]
- 22.McBride GB. Hamilton, New Zealand: 2005. A proposal for strength-of-agreement criteria for Lins concordance correlation coefficient. National Institute of Water & Atmospheric Research Ltd, Project MOH05201. [Google Scholar]
- 23.McGee S. Simplifying likelihood ratios. J Gen Intern Med. 2002;17:647–50. doi: 10.1046/j.1525-1497.2002.10750.x. [DOI] [PMC free article] [PubMed] [Google Scholar]
- 24.Khawaja IS, Olson EJ, van der Walt C, et al. Diagnostic accuracy of split-night polysomnograms. J Clin Sleep Med. 2010;6:357–362. [PMC free article] [PubMed] [Google Scholar]
Associated Data
This section collects any data citations, data availability statements, or supplementary materials included in this article.
Supplementary Materials
Mean and median respiratory event index and total number of apneas and hypopneas at each hour of the recording
Cumulative apneas and hypopneas by hour of recording. Depicted are the cumulative apneas and hypopneas by hour of recording for all tests in the solid blue line, and the linear fit in the dashed line. The line is extremely linear (R2 = 0.99822), indicating that there is no significant difference in the rate of respiratory events by hour of recording.


