Abstract
Pulse techniques in electron paramagnetic resonance (EPR) allow for a reduction in measurement times and increase in sensitivity but require the synthesis of paramagnetic probes with long relaxation times. Here it is shown that the recently synthesized phosphonated trityl radical possesses long relaxation times that are sensitive to probe the microenvironment, such as oxygenation and acidity of an aqueous solution. In principle, application of Fourier transform EPR (FT-EPR) spectroscopy makes it possible to acquire the entire EPR spectrum of the trityl probe and assess these microenvironmental parameters within a few microseconds. The performed analysis of the FT-EPR spectra takes into consideration oxygen-, proton-, buffer-, and concentration-induced contributions to the spectral shape, therefore enabling quantitative and discriminative assessment of pH, pO2, and concentrations of the probe and inorganic phosphate.
Keywords: biosensors, EPR spectroscopy, relaxation times, radicals
Pulsed electron paramagnetic resonance (EPR) spectroscopy is currently undergoing rapid developments based on the advances in radiofrequency (RF) electronics and synthesis of the probes with comparatively long relaxation times.[1–7] Recently we synthesized dual function oxygen- and pH-sensitive phosphonated trityl probes and demonstrated their application in vitro and in vivo for concurrent assessment of pO2 and pH using continuous-wave (CW) EPR spectroscopy.[8] In principle, long relaxation times of the trityl probes allow extending these functional measurements using FT-EPR techniques. In contrast to applied FT-NMR spectroscopy, and in spite of the principal advantages in high sensitivity and low detection time, FT-EPR spectroscopy has been rarely used in studies of aqueous solutions because of the lack of suitable functional probes.
Table 1 lists the values of longitudinal, T1, and transverse, T2, relaxation times of the p1TAM probe measured in aqueous solutions of different pH values that correspond to different ionization states of the phosphono group (see Scheme 1) in ambient air or under anoxic conditions. The values measured under anoxic conditions are in a good agreement with the previously reported data for symmetrical deuterated Finland trityl (T1 = 17 μs, T2 = 11 μs).[5]
Table 1.
Relaxation times of the p1TAM probe.
| pH 10[a] | pH 10[b] | pH 4.5[a] | pH 4.5[b] | |
|---|---|---|---|---|
| T1 [μs] | 21 ± 1 | 0.57 ± 0.05 | 18 ± 1 | 0.62 ± 0.05 |
| T2 [μs] | 11 ± 1 | 0.54 ± 0.05 | 6.0 ± 0.5 | 0.61 ± 0.05 |
Measured in anoxic solution of 0.2 mM p1TAM;
Measured in ambient air.
Scheme 1.
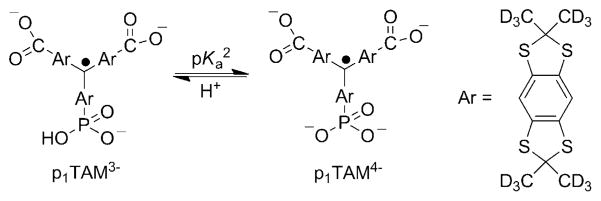
The acid–base equilibrium for the monophosphonated trityl radical, p1TAM (pKa2 = 6.9). The pKa1 value for the first dissociation of the phosphono group is about 1.3 and the pKa value for the dissociation of the carboxy groups is about 2.6.[8]
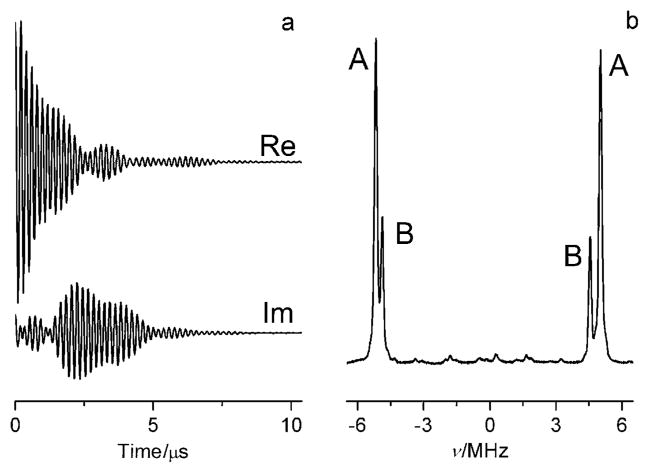
Long relaxation times of p1TAM allow for excitation of the whole EPR spectrum using a 20 ns π/2 pulse followed by detection of the free induction decay (FID; Figure 1a). Figure 1b shows the absorption EPR spectrum obtained by Fourier transformation (FT) of the time-domain FID signal. The FT-EPR spectrum represents a superposition of two ionization states of the probe, A (p1TAM3−) and B (p1TAM4−) with protonated and unprotonated phosphono groups, respectively (see Scheme 1), which have different phosphorus hyperfine constants, aP(A) = 10191 kHz and aP(B) = 9422 kHz, and different g-factors (Δg =90 kHz).
Figure 1.
Real (Re) and imaginary (Im) parts of the X-band EPR FID signal of 0.2 mM p1TAM solution, pH 6.4, measured a) after applying a nonselective 20 ns π/2 pulse and b) the corresponding FT-EPR spectrum. The EPR spectral lines correspond to the four trityl radical states: A (Sp = −1/2), B (Sp = −1/2), B (Sp = 1/2), and A (Sp = 1/2).
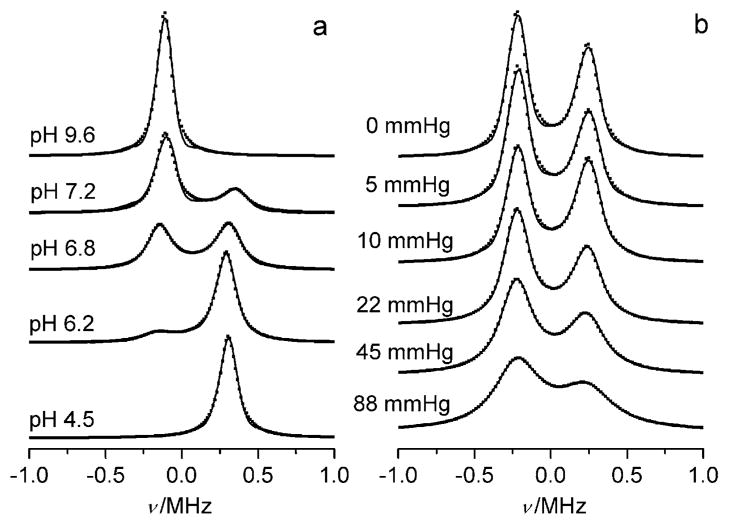
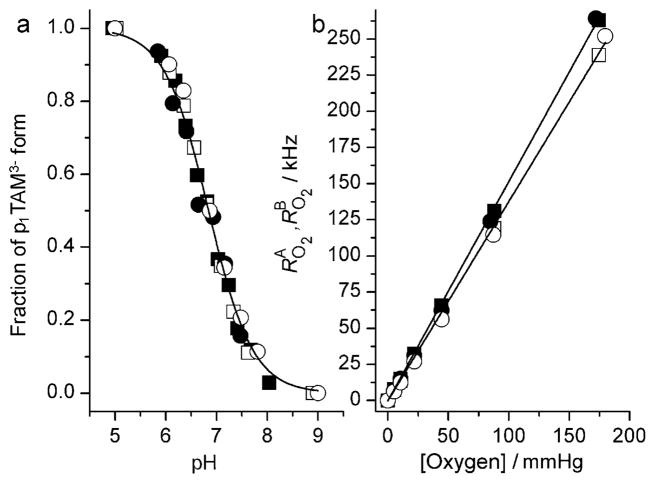
Figure 2 shows the high-frequency component of the FT-EPR spectra of p1TAM solutions at different pH values and oxygen concentrations measured after application of selective 96 ns pulse. Figure 2 clearly demonstrates the independent character of pH and oxygen spectral sensitivities, signal intensity ratio (Figure 2a), and linewidth (Figure 2b). Accordingly, the simulation of the spectra yields the values of the probe fractions, pA and pB, and oxygen-induced relaxation rates, RO2A and RO2B, for the forms A and B, respectively (see the Supporting Information). Figure 3a shows the dependence of the fraction pA on the pH value which is described by a standard titration curve with pKa2 = 6.85 ± 0.05. Figure 3b shows the dependencies of RO2A and RO2B on the oxygen partial pressure that can be fitted by linear functions yielding the values of the corresponding bimolecular rate constants of the spin exchange between the trityl probe and oxygen, kO2A =1.51 kHzmmHg−1 and kO2B = 1.38 kHzmmHg−1. Assuming an oxygen solubility in 150 mM NaCl aqueous solution at 22°C and pO2 = 760 mmHg of about 1.28 mM, we obtain values of kO2A ==0.9 × 10⁹M−1s−1 and kO2B =0.82 × 10⁹M−1s−1 being close to the rate constants for diffusion-controlled reactions.
Figure 2.
High-frequency component of the FT-EPR spectra of 0.2 mM p1TAM in 150 mM aqueous NaCl solutions a) at different pH values and b) under different oxygen partial pressures in the presence of a a) 2 mM or b) 0.5 mM Na-phosphate buffer. The dotted lines are calculated spectra.
Figure 3.
a) Dependency of the fraction pA of the p1TAM3− form on the pH calculated from FT-EPR spectra measured in Na-phosphate buffer, 150 mM NaCl, at different buffer concentrations: 0 (○), 1 (●), 2 (■), and 5 mM (□). Solid lines represent the best fit by a conventional titration curve yielding identical values of pKa2 =(6.85 ± 0.05). b) The dependency of oxygen-induced relaxation rates, RO2A (filled symbols) and RO2b (open symbols), on the oxygen partial pressure calculated from FT-EPR spectra acquired at pH 4.5, pH 10 (circles), and pH 6.9 (squares). Lines represent the best linear fits yielding the values of the bimolecular rate constants, kO2A =1.51 kHzmmHg−1 and kO2B =1.38 kHzmmHg−1.
In general, three different types of exchange reactions may contribute to the FT-EPR spectra of the p1TAM probe, namely spin exchange of p1TAM with oxygen, spin self-exchange between trityl radicals, and proton exchange between different ionization states of p1TAM. Fortunately, the manifestation of these reactions in the EPR spectra have distinguished features and can be quantitatively separated.
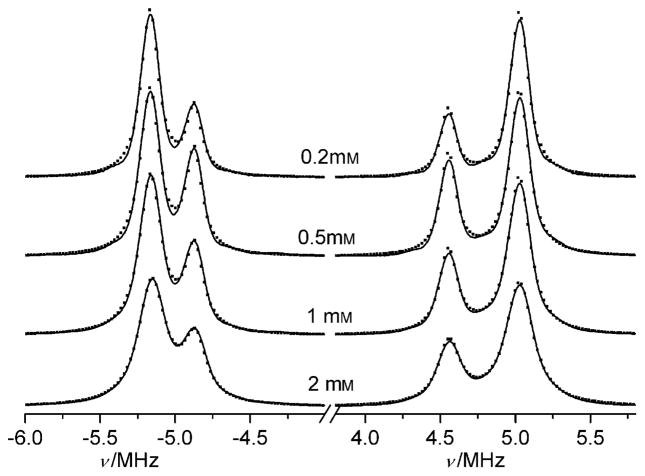
In contrast to oxygen-induced line broadening, proton exchange also results in narrowing the distance between the EPR lines that correspond to different ionization states but the same projections of the nuclear spin of phosphorus, namely, A (Sp = 1/2) and B (Sp = 1/2); and A (Sp = −1/2) and B (Sp = −1/2) (see Figure 1 and section 1 in the Supporting Information). The normalized rates (in Hz) of proton loss by the phosphono group of the p1TAM3− form, RAH+, and proton addition to the phosphono group of the p1TAM4− form, RBH+, in the reaction of p1TAM with solvated protons at neutral pH are too low to affect the EPR spectrum because of the low proton concentrations. However, the proton exchange reactions between radical and buffer molecules with the pKaB close to the pKa2 of p1TAM may significantly enhance the rates RAH+ and RBH+. Figure 4 shows FT-EPR spectra measured in deoxygenated saline solutions at low probe concentration but different concentrations of phosphate buffer (pKaB =6.66).[9] The observed spectral changes are characteristic for frequency exchange induced by a proton exchange reaction between phosphonated trityl groups and phosphate anions described by Equation (1).[8,10,11]
Figure 4.
FT-EPR spectra of 0.2 mM p1TAM measured in 150 mM NaCl aqueous solutions at different Na-phosphate buffer concentrations, pH 6.53. The dotted lines are calculated spectra.
| (1) |
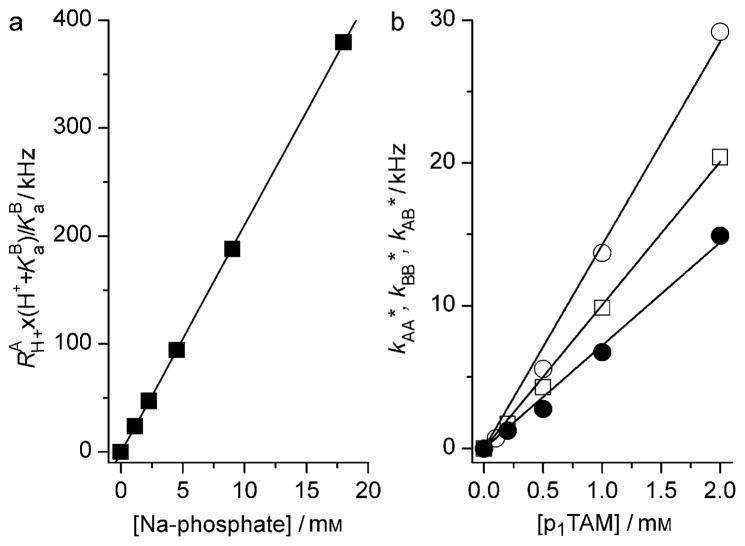
The ratio RAH+/RBH+ is equal to the ratio of inverse lifetimes of the radical in the forms A and B or the fraction ratio, so RBH+ = RAH+ × pA/(1−pA). Figure 6a shows that the RAH+ values obtained from spectra fittings are directly proportional to the phosphate buffer concentration. The linear approximation yields the value of the bimolecular rate constants, kf = 2.1 × 10⁷M−1s−1 and kr = 3.3 × 10⁷M−1s−1 (see the Supporting Information).
Figure 6.
a) Dependency of the term RAH+ × (KaB +H+)/KaB on the concentration of the Na-phosphate buffer obtained by fitting the EPR spectra shown in Figure 4. The solid line represents a linear fit yielding the value of kf = 21 kHzmM −1. b) The dependency of the observed rates of spin self-exchange, kAA* (○), kBB* (●), and kAB* (□) on the concentration of the p1TAM probe. Solid lines represent linear fits yielding the values of bimolecular rate constants, kAA = 14.3 kHzmM−1, kBB = 7.2 kHzmM−1, and kAB = 10 kHzmM−1.
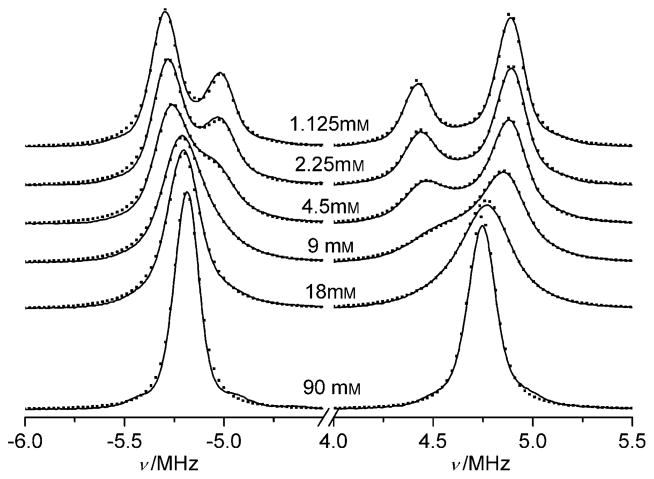
Spin self-exchange between trityl radicals in addition to line broadening results in a shift of the positions of all the EPR lines of p1TAM (see Figure SI1 for the details). Figure 5 shows the effect of spin self-exchange between trityl radicals on the EPR spectra of p1TAM measured in deoxygenated saline solutions in the absence of phosphate buffer but at different probe concentrations. The simulation of the spectra yields values of the observed rates of spin self-exchange, kAA*, kBB*, and kAB* (in Hz), between p1TAM in the ionization states p1TAM3−, p1TAM4− and between the radicals in different ionization states. Figure 6b shows the dependencies of the rates kAA*, kBB*, and kAB*, on the p1TAM concentration that allows for linear approximation yielding the value of the corresponding bimolecular rate constants of spin self-exchange, kAA = 1.43 × 10⁷M−1s−1, kBB = 0.74 × 10⁷M−1s−1, and kAB = 107M−1s−1.
Figure 5.
FT-EPR spectra of various concentrations of p1TAM (indicated near the spectra) in anoxic 150 mM NaCl solutions in the absence of phosphate buffer. The dotted lines are calculated spectra.
The bimolecular rate constants were found to have values 1) about 109M−1s−1 for the spin exchange of p1TAM with a small oxygen diradical molecule, 2) almost two orders of magnitude lower, in the range (2.1–3.3) × 107M−1s−1, for the proton exchange reactions of p1TAM with phosphate anions, and 3) the lowest values, (0.74–1.43) × 107M−1s−1, for the spin self-exchange between large trityl radicals. This tendency is consistent with the significant contribution of steric hindrance in the reactivity of trityl radicals.
In the general case, analysis of the FT-EPR spectrum of p1TAM allows for simultaneous extraction pH, pO2, and the concentrations of inorganic phosphate, [Pi], and of the probe, [p1TAM]. Table 2 lists the values of these four parameters calculated from the spectra (see Figure SI3) of various p1TAM solutions that are in a good agreement with the sample compositions. An accuracy of determination of pO2 is about 1 mmHg (or 1 mμ [O2]) which is two orders of magnitude higher than that for concentrations of Pi or p1TAM, about 0.1 mM. This is in agreement with an accuracy of spectral linewidth analysis of about 1 kHz, and the rate constant values for oxygen-induced spin exchange of about 109M−1s−1 and for proton exchange and spin self-exchange reactions of about 107M−1s−1.
Table 2.
The values of pH, pO2, [Pi], and [p1TAM] calculated from FT-EPR spectra measured in p1TAM solutions of different compositions.
| pH, ± 0.03 | pO2 [mmHg], ± 1 mmHg | [Pi] [mM], ± 0.1 mM | [p1TAM] [mM], ± 0.1 mM | ||||
|---|---|---|---|---|---|---|---|
| Prep. | Calc. | Prep. | Calc. | Prep. | Calc. | Prep. | Calc. |
| 7.40 | 7.42 | 10 | 9 | 0.05 | 0.1 | 0.05 | 0.0 |
| 7.10 | 7.07 | 13 | 14 | 0.5 | 0.4 | 0.5 | 0.6 |
| 7.00 | 7.02 | 6 | 6 | 0.5 | 0.4 | 0.5 | 0.6 |
| 6.95 | 6.93 | 0 | 1 | 0.5 | 0.4 | 0.5 | 0.6 |
| 6.50 | 6.54 | 0 | −1 | 4.5 | 4.5 | 0.2 | 0.2 |
| 6.50 | 6.45 | 0 | 0 | 0 | 0 | 2.0 | 2.0 |
In summary, FT-EPR spectroscopy using the p1TAM probe makes possible the concurrent measurement of the four parameters of the probe microenvironment, namely pO2, pH, [Pi], and [p1TAM]. Taking into account a sufficient depth of low radiofrequency penetration into aqueous samples, this provides a new tool for simultaneous in vivo assessment of several tissue parameters that play important roles in physiology and pathophysiology of living organisms including: tissue oxygenation, acidosis, Pi concentrations, and perfusion (probe distribution).[12,13] Tissue pO2 and extracellular pH are well-recognized hallmarks in solid tumors while extracellular Pi has been recently identified as a new signaling molecule of importance in tumorigenesis.[14–16] Importantly, an extraordinary high sensitivity of p1TAM to pO2 allows to detect a oxygen tension as low as the threshold of anoxia, about 1 mmHg. p1TAM possesses a pH sensitivity in a physiologically important pH range that makes it possible to monitor the acidity both in normal tissues and in acidic tumors. The range of Pi measured by pTAM from 0.1 to 20 mM covers the physiological range of the Pi values previously reported in the literature.[17,18] This unique multifunctional sensitivity of the p1TAM probe decreases the method invasiveness and will allow for a better correlation of the parameters independent of the distribution of the probe. The demonstrated FT-EPR application can be extended to imaging modalities[19–21] taking into account the simple EPR spectrum and long relaxation times of the p1TAM probe (Table 1).
Supplementary Material
Footnotes
Financial support from NIH grant numbers EB014542, EB016859, and EB016096 is acknowledged.
Supporting information for this article is available on the WWW under http://dx.doi.org/10.1002/anie.201310841.
Contributor Information
Dr. Andrey A. Bobko, Dorothy M. Davis Heart & Lung Research Institute and Division of Pulmonary, Allergy Critical Care & Sleep Medicine, Department of Internal Medicine, The Ohio State University, 201 HLRI, 473 W 12th Ave, Columbus, OH 43210 (USA)
Dr. Ilirian Dhimitruka, Dorothy M. Davis Heart & Lung Research Institute and Division of Pulmonary, Allergy Critical Care & Sleep Medicine, Department of Internal Medicine, The Ohio State University, 201 HLRI, 473 W 12th Ave, Columbus, OH 43210 (USA)
Prof. Dr. Jay L. Zweier, Dorothy M. Davis Heart & Lung Research Institute and Division of Cardiovascular Medicine, Department of Internal Medicine, The Ohio State University, Ohio (USA)
Prof. Dr. Valery V. Khramtsov, Email: Valery.Khramtsov@osumc.edu, Dorothy M. Davis Heart & Lung Research Institute and Division of Pulmonary, Allergy Critical Care & Sleep Medicine, Department of Internal Medicine, The Ohio State University, 201 HLRI, 473 W 12th Ave, Columbus, OH 43210 (USA)
References
- 1.Schweiger A, Jeschke G. Principles of pulse electron paramagnetic resonance. Oxford University Press; Oxford, New York: 2001. [Google Scholar]
- 2.Murugesan R, Cook JA, Devasahayam N, Afeworki M, Subramanian S, Tschudin R, Larsen JA, Mitchell JB, Russo A, Krishna MC. Magn Reson Med. 1997;38:409. doi: 10.1002/mrm.1910380309. [DOI] [PubMed] [Google Scholar]
- 3.Prisner T, Rohrer M, MacMillan F. Annu Rev Phys Chem. 2001;52:279. doi: 10.1146/annurev.physchem.52.1.279. [DOI] [PubMed] [Google Scholar]
- 4.Sicoli G, Wachowius F, Bennati M, Hobartner C. Angew Chem. 2010;122:6588. doi: 10.1002/anie.201000713. [DOI] [PubMed] [Google Scholar]; Angew Chem Int Ed. 2010;49:6443. [Google Scholar]
- 5.Yong L, Harbridge J, Quine RW, Rinard GA, Eaton SS, Eaton GR, Mailer C, Barth E, Halpern HJ. J Magn Reson. 2001;152:156. doi: 10.1006/jmre.2001.2379. [DOI] [PubMed] [Google Scholar]
- 6.Reginsson GW, Kunjir NC, Sigurdsson ST, Schiemann O. Chem Eur J. 2012;18:13580. doi: 10.1002/chem.201203014. [DOI] [PubMed] [Google Scholar]
- 7.Yang Z, Liu Y, Borbat P, Zweier JL, Freed JH, Hubbell WL. J Am Chem Soc. 2012;134:9950. doi: 10.1021/ja303791p. [DOI] [PMC free article] [PubMed] [Google Scholar]
- 8.Dhimitruka I, Bobko AA, Eubank TD, Komarov DA, Khramtsov VV. J Am Chem Soc. 2013;135:5904. doi: 10.1021/ja401572r. [DOI] [PMC free article] [PubMed] [Google Scholar]
- 9.Butler JN. Ionic equilibrium: solubility and pH calculations. Wiley; New York: 1998. [Google Scholar]
- 10.Bobko AA, Dhimitruka I, Komarov DA, Khramtsov VV. Anal Chem. 2012;84:6054. doi: 10.1021/ac3008994. [DOI] [PMC free article] [PubMed] [Google Scholar]
- 11.Driesschaert B, Marchand V, LevÞque P, Gallez B, March-and-Brynaert J. Chem Commun. 2012;48:4049. doi: 10.1039/c2cc00025c. [DOI] [PubMed] [Google Scholar]
- 12.Siemann DW, editor. Tumor Microenvironment. Wiley; Chi-chester: 2011. [Google Scholar]
- 13.Bobko AA, Eubank TD, Voorhees JL, Efimova OV, Kirilyuk IA, Petryakov S, Trofimiov DG, Marsh CB, Zweier JL, Grigor’ev IA, Samouilov A, Khramtsov VV. Magn Reson Med. 2012;67:1827. doi: 10.1002/mrm.23196. [DOI] [PMC free article] [PubMed] [Google Scholar]
- 14.Chang SH, Yu KN, Lee YS, An GH, Beck GR, Jr, Colburn NH, Lee KH, Cho MH. Am J Respir Cell Mol Biol. 2006;35:528. doi: 10.1165/rcmb.2005-0477OC. [DOI] [PMC free article] [PubMed] [Google Scholar]
- 15.Spina A, Sapio L, Esposito A, Di Maiolo F, Sorvillo L, Naviglio S. BioResources. 2013;2:47. doi: 10.1089/biores.2012.0266. [DOI] [PMC free article] [PubMed] [Google Scholar]
- 16.Khoshniat S, Bourgine A, Julien M, Weiss P, Guicheux J, Beck L. Cell Mol Life Sci. 2011;68:205. doi: 10.1007/s00018-010-0527-z. [DOI] [PMC free article] [PubMed] [Google Scholar]
- 17.Stubbs M, Bhujwalla ZM, Tozer GM, Rodrigues LM, Maxwell RJ, Morgan R, Howe FA, Griffiths JR. NMR Biomed. 1992;5:351. doi: 10.1002/nbm.1940050606. [DOI] [PubMed] [Google Scholar]
- 18.Fogh-Andersen N, Altura BM, Altura BT, Siggaard-Andersen O. Clin Chem. 1995;41:1522. [PubMed] [Google Scholar]
- 19.Epel B, Sundramoorthy SV, Mailer C, Halpern HJ. Concepts Magn Reson Part B. 2008;33B:163. doi: 10.1002/cmr.b.20119. [DOI] [PMC free article] [PubMed] [Google Scholar]
- 20.Yasui H, Matsumoto S, Devasahayam N, Munasinghe JP, Choudhuri R, Saito K, Subramanian S, Mitchell JB, Krishna MC. Cancer Res. 2010;70:6427. doi: 10.1158/0008-5472.CAN-10-1350. [DOI] [PMC free article] [PubMed] [Google Scholar]
- 21.Blank A, Freed JH. Isr J Chem. 2006;46:423. [Google Scholar]
Associated Data
This section collects any data citations, data availability statements, or supplementary materials included in this article.


