Abstract
Segmentation of the lungs within magnetic resonance (MR) scans is a necessary step in the computer-based analysis of thoracic MR images. This process is often confounded by image acquisition artifacts and disease-induced morphological deformation. We have developed an automated method for lung segmentation that is insensitive to these complications. The automated method was applied to 23 thoracic MR scans (413 sections) obtained from 10 patients. Two radiologists manually outlined the lung regions in a random sample of 101 sections (n=202 lungs), and the extent to which disease or artifact confounded lung border visualization was evaluated. Accuracy of lung regions extracted by the automated segmentation method was quantified by comparison with the radiologist-defined lung regions using an area overlap measure (AOM) that ranged from 0 (disjoint lung regions) to 1 (complete overlap). The AOM between each observer and the automated method was 0.82 when averaged over all lungs. The average AOM in the lung bases, where lung segmentation is most difficult, was 0.73.
Keywords: segmentation, magnetic resonance imaging (MRI), image processing, cardiac motion artifact, pulmonary motion artifact, computer-aided diagnosis (CAD)
I. INTRODUCTION
Segmentation is a necessary preprocessing step in computer-based analysis of medical images. Many computer-aided diagnostic (CAD) systems apply segmentation as a first step within the larger methodology. This step increases both the specificity and sensitivity of the task and decreases computation time by limiting analysis to specific structures of interest. Segmentation of lung regions has been extensively researched in thoracic computed tomography (CT) scans;1-7 however, the need for lung segmentation in magnetic resonance (MR) scans of the thorax has been limited because long acquisition times and severe image artifacts have, until recently, restricted the clinical utility of thoracic MR scans. Increased in-plane resolution, improved pulse sequences, decreased acquisition time, and use of new contrast media (e.g. hyperpolarized gas) have made thoracic MR a viable imaging study, which has renewed interest in lung segmentation.8-17 Previous segmentation methods concentrated on edge-based and model-based11 methods instead of the alternative region-based segmentation method presented in this paper. The edge-based methods include application of active contours using non-linear diffusion,15 merging of multiple active contours,17 and an active contour/neural network combination16 to minimize the impact of imaging artifacts on segmentation accuracy.
Magnetic resonance imaging has value in differentiating normal lung tissue from other anatomic structures and diseases. Although normal lung produces almost no MR signal, many diseases (for example mesothelioma) exhibit a high signal intensity even without the introduction of a contrast agent.8 Unfortunately, image acquisition artifacts can still corrupt MR images and complicate subsequent attempts at image segmentation. Examples of such artifacts include, but are not limited to, partial volume effects, localized signal loss (shadowing), chemical shift artifacts, and motion artifacts.
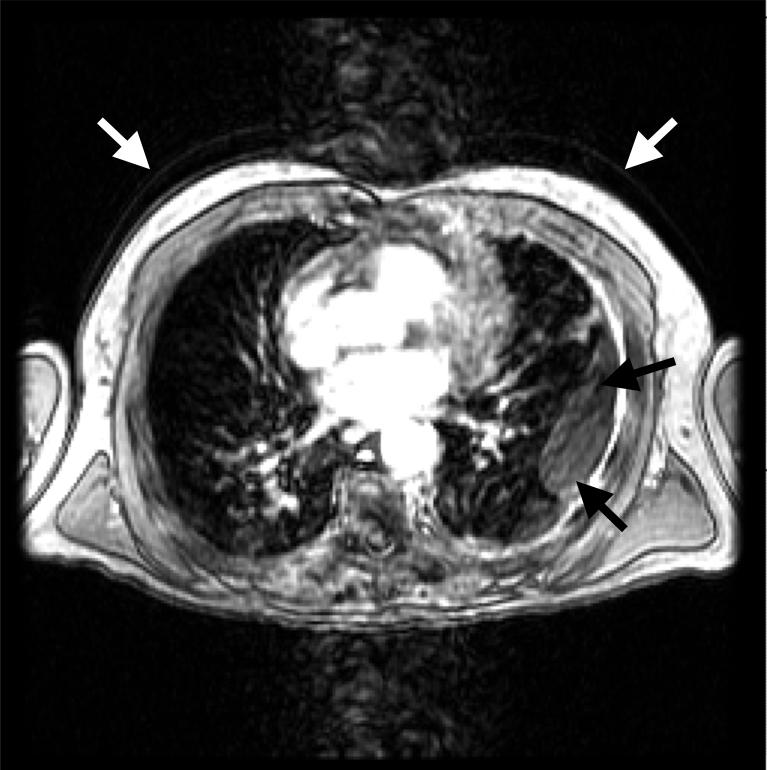
One of the most common and severe artifacts is image ghosting due to patient motion. Ghosting along the phase-encoding dimension results when any repetitive motion (e.g., cardiac and pulmonary motion) occurs during image acquisition.18 The cardiac motion artifact appears as a large column of noise (image ghosting) that extends along the anteroposterior dimension of the image. This column often masks the underlying lung, as demonstrated in Figure 1. Injection of a contrast agent such as gadolinium further enhances the gray-level intensities in the heart and thus exacerbates this artifact. Two types of pulmonary motion artifact related to respiration may be present in thoracic MR scans. The first (Fig. 1) creates ghost contours of the chest, while the second results when the motion and high gray-level values of the diaphragm artificially increase the signal in the lung bases.
FIG. 1.
Common artifacts occurring in thoracic MR sections. Cardiac motion creates a large column of noise along the anteroposterior direction. Also note the pulmonary motion artifact present as recurring contours of the thorax (white arrows) and lung deformation due to disease (black arrows).
Disease may also adversely impact automated lung segmentation. The morphologic deformation of the lungs caused by diseases such as mesothelioma and pleural effusion can degrade the results of segmentation methods based on lung-shape descriptors and gray-level thresholding alone (Fig. 1). In this study, we developed an automated method for lung segmentation that accounts for common thoracic MR image artifacts and morphological lung deformation due to disease.19 This method was validated based on the manual lung segmentations of two radiologists using an area of overlap measure and observer ratings of disease/artifact extent and level of lung boundary obscuration.
II. MATERIALS AND METHODS
A) Database
Twenty-three thoracic MR scans (413 total sections) were collected retrospectively from ten patients (7 males and 3 females; age range: 59-77 years, mean: 68 years) with appropriate IRB approval. The 256×256 T1-weighted spoiled GRASS (SPGR) MR scans were acquired on a 1.5T scanner (Genesis Signa; GE Medical Systems, Fairfield, CT) with repetition times between 150-200ms, 3.1-4.2ms echo times, mean slice thickness of 8mm, and spatial resolutions between 1.63 and 1.77mm. Eight pair of scans consisted of the same patient before and after the administration of contrast agent. Five patients had multiple pre-contrast and/or post-contrast scans (mean separation time: 21 days). Sections containing anatomy superior to the lung apices or inferior to the lung bases were manually removed from each scan. Twenty of the 23 patient scans (9 of 10 patients) were abnormal and included pathology such as mesothelioma, scarring, pleural plaques, enlarged lymph nodes, hydropneumothorax, lung resection, lung nodules, intrathoracic extrapleural fat, and pericardial effusion.
B) Automated Segmentation Method
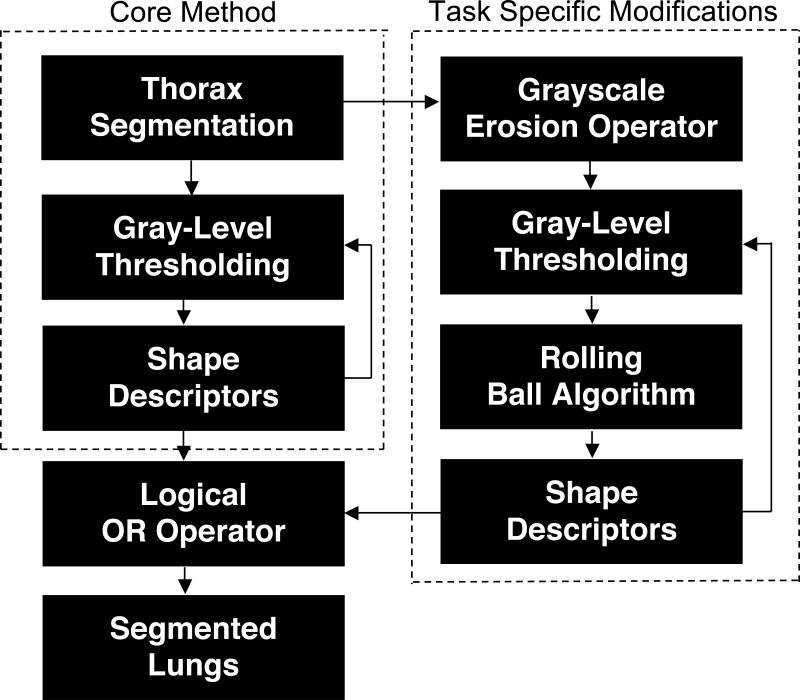
The automated lung segmentation method was based on a core segmentation method2 (Fig. 2). The thorax is segmented from the background within each section of the MR scan using a gray-level threshold obtained by analyzing the slope of the average cumulative gray-level histogram constructed along two lines extending from the center of the image to its top corners. After application of this threshold to create a binary image from the original image, the contour of the largest contiguous group of “on” pixels in the binary image defines the “thoracic contour.” All pixels of the original image that lie within the thoracic contour then constitute the thoracic region. Shape descriptors that mathematically quantify morphological characteristics of image regions (e.g., area and compactness20) are calculated from the thoracic region and compared with empirically determined descriptor thresholds (Table 1). If the thoracic descriptors fall outside their respective thresholds, then the gray-level threshold is lowered by a value of 5 and the process is repeated. If the threshold reaches zero, then we assume the initial threshold was too low. The process is then repeated with an initial threshold equal to half the mean gray-level value of the image. After the thorax is detected, a series of erosion and dilation filters is applied to smooth the thoracic contour prior to lung segmentation.
FIG. 2.
Block diagram of the automated method for segmentation of lung regions from thoracic MR scans.
Table 1.
Parameters and empirically determined shape descriptor thresholds
| Thoracic Segmentation | Core Segmentation | Complete Segmentation | |
|---|---|---|---|
| Minimum Area (pixels) | (Field of View)/(2*Pixel Dimension)2 | 350/(Pixel Dimension)2 | 550/(Pixel Dimension)2 |
| Maximum Area (pixels) | - | (Thoracic Size)/2 | (Thoracic Size)/2 |
| Minimum Contour Length | - | 45/(Pixel Dimension) | 60/(Pixel Dimension) |
| Minimum Compactness* | 15 | 2 | 5 |
| Center of Mass Thresholds | - | - |
x ∈ [50,215] y ∈ [50,200] |
| Maximum number of pixels crossing rolling ball surface (Contortion) | - | - | 85% of filter boundary arc |
| Minimum number of pixels for contour segment to be identified as a possible protrusion by the rolling ball filter | - | - | 8 pixels |
| Minimum Circularity | - | - | 0.4 |
Compactness20 (C) is defined as:
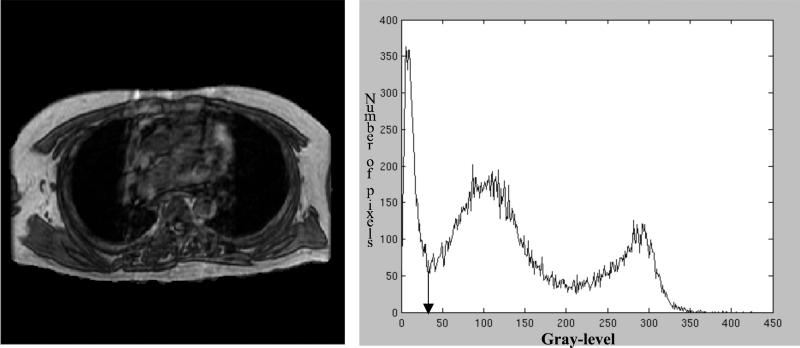
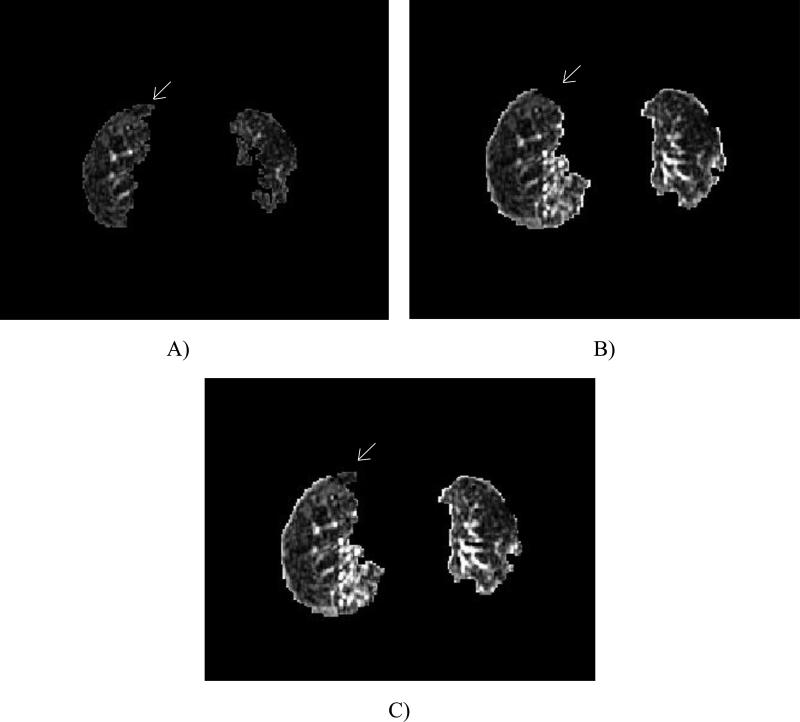
Once the thorax-segmented image is created, histogram-based gray-level thresholding techniques are applied to create a lung-thresholded image. A gray-level threshold for lung segmentation is determined by searching the gray-level histogram of the segmented thorax for the local minimum with the lowest overall gray-level value (Fig. 3). After application of this threshold to create a binary image from the thorax-segmented image, the contours of all contiguous groups of “on” pixels in the binary image define the “lung contours.” All pixels of the thorax-segmented image that lie within a lung contour then constitute a lung region. Area, compactness, center of mass, and contour length shape descriptors are computed for each region and non-lung regions are eliminated based on empirically determined descriptor thresholds (Table 1). If no regions exist in the thresholded image, then the gray-level threshold is automatically lowered by a value of 2 and the process is repeated. If the threshold is set to zero, then the initial threshold was set too low. The initial threshold is then increased by a third of the difference between the thoracic and the initial thresholds and the process is repeated. If no lung is found after eighty tries, then the image is determined to contain no viable lung regions; otherwise a lung-segmented image is formed (Fig. 4).
FIG. 3.
Thorax-segmented image and its associated gray-level histogram. The arrow in the histogram indicates the threshold applied for lung segmentation.
FIG. 4.
Images demonstrating segmentation due to: A) core method, B) core method with the addition of the grayscale erosion and rolling ball filters, and C) complete method. Note the anterior right lung region present in A and C, but lost in B due to the rolling ball (ovals).
The presence of disease or artifact has the potential to confound the core method, which generates acceptable segmentation results for only a narrow subset of MR sections. Task-specific modifications were added to the core method to increase segmentation accuracy and robustness (Fig. 2). In parallel with the core method, a second lung-thresholded image is created to capture valid lung areas that might be absent from the first lung-thresholded image because of artifact or disease. First, a 3×3-pixel grayscale erosion operator is applied to the segmented thorax. This filter lowers the gray levels of the lung regions masked by artifact or disease by assigning the minimum of the local neighborhood to the pixel of interest (Figs. 2 and 5). The filtered lung pixels more accurately approximate the actual gray levels of the lung because artifact and disease are typically not homogeneous. Thus, masked lung pixel values are simultaneously lowered and homogenized by the filter. Gray-level thresholding techniques, morphological filters, and shape descriptors (Table 1), as described previously, are then applied to the filtered section.
Fig. 5.
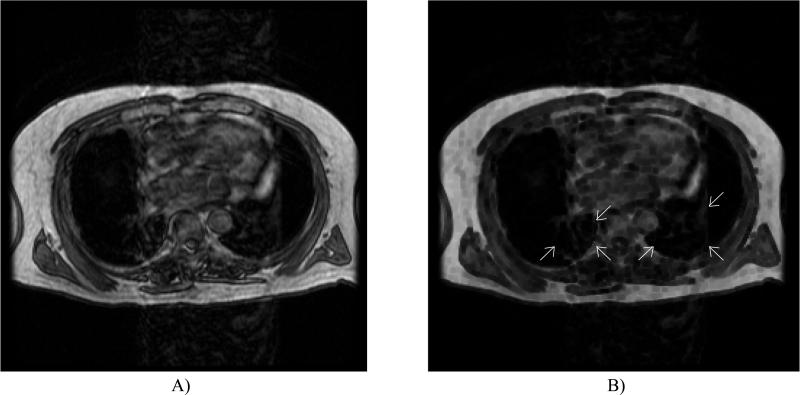
Demonstration of improved lung homogeneity after application of a grayscale erosion filter. A) Original MR section with cardiac motion artifact prominent in both lungs. B) Section after application of the filter shows a reduction in the cardiac motion artifact within both lungs (ovals).
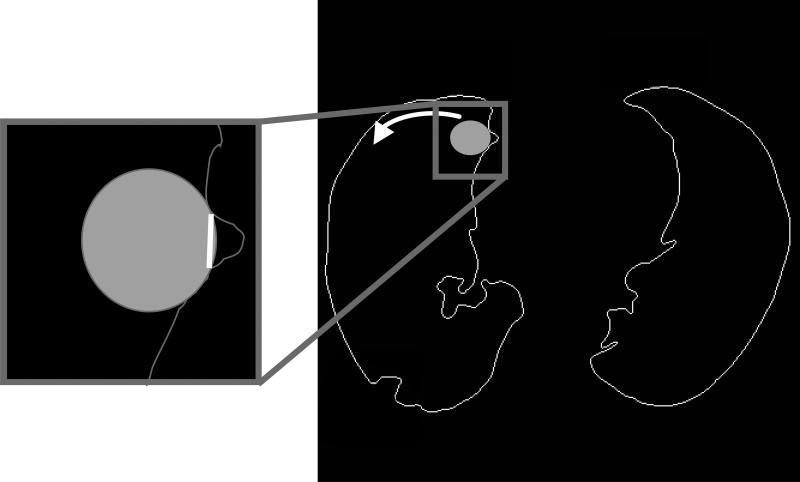
Application of the grayscale erosion filter is indiscriminate and often results in the incorporation of non-lung areas within the thresholded lung regions. These non-lung areas typically include pixels representing surrounding soft tissue with gray levels that had been modified by the grayscale erosion filter. To eliminate these non-lung areas a closing and opening filter are applied to the lung regions, and a series of rolling ball filters1 (with diameters of 9, 7, and 5 pixels, respectively) is applied to the internal aspect of the lung segmentation contours to eliminate these non-lung “protrusions” (Fig. 2). At each lung contour pixel, a disc is placed inside the contour (Fig. 6) with an orientation that yields the greatest amount of overlap between the lung contour and the disc boundary. The segment of lung contour that exists between the two extreme points of contact with the disc boundary is analyzed. If the lung contour segment exceeds a predefined fraction of the corresponding disc boundary segment (Table 1), then a line is drawn to connect the two contact points; if the intersection of the new connecting line and the original lung contour exceeds a predefined threshold (Table 1), then the lung contour is considered to be too contorted, and the original contour is maintained to avoid creating a contour that might be inconsistent. With both length and contortion checks passed, the non-lung portion of the contour (i.e. beyond the new connecting line) is eliminated. Thus, these disc-shaped filters locate and eliminate protrusions in the lung contour based on shape characteristics.
FIG. 6.
Diagram of the rolling ball filter. The filter is applied to the internal aspect of all lung contour points and searches for a contour protrusion composed of non-lung pixels. When a protrusion is found, the filter creates a new contour segment (inset) and eliminates the protrusion.
Application of the rolling ball filters in the second lung-thresholded image may eliminate valid lung areas along with the non-lung areas. These incorrectly eliminated lung areas, however, are often present in the first lung-thresholded image and thus can be correctly retained. The lung region shape characteristics from the second lung-thresholded image are analyzed and those that are within predetermined values are combined with regions from the first lung-thresholded image through application of a logical OR operator to construct the final lung-segmented image. The circularity21 for each new region added to the first lung-thresholded image is calculated. Circularity is defined as
| (1) |
where Rcircle is the number of region pixels falling within an area-equivalent circle that is centered at the region's center of mass and Rtotal is the total number of pixels in the region. The region is eliminated if it is not within an empirically determined circularity threshold (Table 1). This process eliminates rinds of non-lung pixels that are incorrectly segmented due to the grayscale erosion filter, but not eliminated by the rolling ball. The result is a lung-segmented image using the complete method (Figs. 4 and 7). This automated lung segmentation method was applied to all 413 sections of the 23-case database of thoracic MR scans.
FIG. 7.
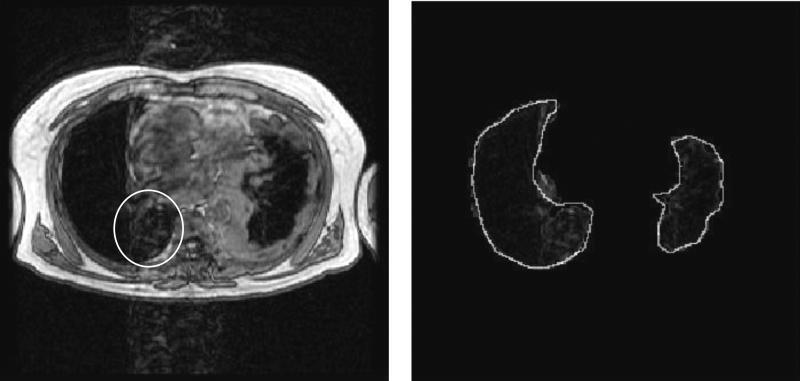
Example of a typical segmentation result from the complete method. The left image is the original artifact corrupted image and the right is the resulting automated lung segmentation with a radiologist outline superimposed (white outline). Note that window and level have been set to illustrate the presence of cardiac motion artifact. Also note that lung regions severely impacted by cardiac motion artifact have been properly segmented (oval).
C) Automated Method Evaluation
A random sample of 101 sections was chosen from the 413-section database. Two thoracic radiologists independently manually outlined the lung regions in each section through a computer interface. For each lung in each section, one of the radiologists rated the impact of artifact and disease on the visualization of the lung contour on four separate scales. The percentage of the lung contour affected by imaging artifacts (“extent”) was rated on a scale from 1 (no artifact present along the lung contour) to 5 (75 to 100 percent of the lung contour affected). The degree to which artifact caused uncertainty in the visualization of the lung contour (“obscuration”) was rated on a scale from 1 (does not obscure lung contour) to 5 (completely obscures lung contour). Similarly, the extent and obscuration due to disease was rated for each lung.
An area of overlap measure (AOM) was used to compare the observer-outlined lung regions with each other and with regions created by the complete and the core automated method. The AOM measure is defined as:
| (2) |
where A is a lung region from one observer or method and B is a lung region from another observer or method. AOM is defined on the scale [0, 1], with a value of 0 corresponding to disjoint regions and a value of 1 corresponding to complete overlap.
III. RESULTS
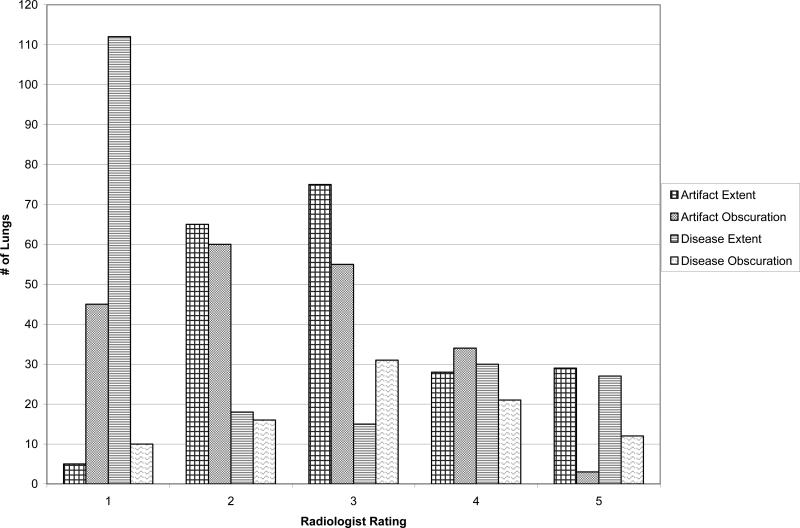
The distributions of radiologist extent and obscuration ratings for the randomly sampled sections are shown in Figure 8. The radiologist rated n=5 lungs as artifact free and n=112 lungs as disease free. Obscuration was rated only for those lung regions in which either disease or artifact existed (i.e., extent greater than 1). These ratings served to characterize the complexity of the database.
FIG. 8.
Radiologist ratings for disease/artifact extent and contour obscuration. Extent of artifact or disease was rated from 1 (none present) to 5 (75 to 100 percent of lung contour affected), and contour obscuration from either artifact or disease was rated from 1 (does not obscure lung contour) to 5 (completely obscures lung contour).
The AOM values between the manual lung contours of the two radiologists are shown in Table 2. The two disjoint lung regions between the radiologists were located in the base sections of the lungs; severe motion and partial volume artifacts due to the diaphragm rendered the composition of these regions difficult to ascertain so that one radiologist identified lung in a base section while the other did not. There was a substantial increase in the standard deviation of the AOM and decrease in average AOM for lung bases compared with the AOM for all lungs.
Table 2.
AOM values for Radiologist 1 vs. Radiologist 2
| Radiologist 1 vs. Radiologist 2 (All Sections) | ||||
|---|---|---|---|---|
| Right Lung | Left Lung | |||
| Avg. AOM | 0.88 | 0.79 | ||
| St. Dev. of AOM | 0.10 | 0.16 | ||
| Disjoint Lung Regions | 2 | |||
| Radiologist 1 vs. Radiologist 2 (Base Sections Only) | ||||
|---|---|---|---|---|
| Right Lung | Left Lung | |||
| Avg. AOM | 0.80 | 0.67 | ||
| St. Dev. of AOM | 0.18 | 0.30 | ||
| Disjoint Lung Regions | 2 | |||
The AOM values between the manual lung contours of each radiologist and the contours generated by the complete automated method are shown in Tables 3 and 4. The average AOM values over all lung regions with respect to Radiologist 1 and Radiologist 2 were 0.82 + 0.16 and 0.83 + 0.13 respectively. A comparison between each radiologist and the core automated method applying only thresholding and shape descriptors (excluding the use of the second grayscale eroded image) is also shown in Tables 3 and 4 for comparison. The average AOM was increased when the complete method was applied to the MR sections. A paired Student's t-test for differences in means showed that this accuracy increase between the core method and the complete method was statistically significant, with p<0.01 when the two automated methods were evaluated with the manual contours of Radiologist 1 and p<0.001 when evaluated with the manual contours of Radiologist 2. The task specific modifications included in the complete method reduced the number of disjoint lung regions by five for each radiologist when compared with the core automated method. There was a substantial increase in the standard deviation of the AOM and decrease in average AOM (1) for lung bases compared with the AOM for all lungs and (2) for left lung regions compared with right lung regions.
Table 3.
AOM values for Radiologist 1 vs. Automated Methods
| Radiologist 1 vs. Automated Method (All Sections) | ||||
|---|---|---|---|---|
| Rad.1 vs. Complete Method | Rad.1 vs. Core Method | |||
| Right Lung | Left Lung | Right Lung | Left Lung | |
| Avg. AOM | 0.86 | 0.77 | 0.83 | 0.73 |
| St. Dev. of AOM | 0.12 | 0.18 | 0.17 | 0.24 |
| Disjoint Lung Regions | 4 | 9 | ||
| Radiologist 1 vs. Automated Method (Base Sections Only) | ||||
|---|---|---|---|---|
| Rad.1 vs. Complete Method | Rad.1 vs. Core Method | |||
| Right Lung | Left Lung | Right Lung | Left Lung | |
| Avg. AOM | 0.78 | 0.61 | 0.72 | 0.48 |
| St. Dev. of AOM | 0.23 | 0.30 | 0.28 | 0.35 |
| Disjoint Lung Regions | 2 | 4 | ||
Table 4.
AOM values for Radiologist 2 vs. Automated Methods
| Radiologist 2 vs. Automated Method (All Sections) | ||||
|---|---|---|---|---|
| Rad.2 vs. Complete Method | Rad.2 vs. Core Method | |||
| Right Lung | Left Lung | Right Lung | Left Lung | |
| Avg. AOM | 0.86 | 0.80 | 0.83 | 0.72 |
| St. Dev. of AOM | 0.11 | 0.14 | 0.15 | 0.22 |
| Disjoint Lung Regions | 2 | 7 | ||
| Radiologist 2 vs. Automated Method (Base Sections Only) | ||||
|---|---|---|---|---|
| Rad.2 vs. Complete Method | Rad.2 vs. Core Method | |||
| Right Lung | Left Lung | Right Lung | Left Lung | |
| Avg. AOM | 0.78 | 0.74 | 0.77 | 0.59 |
| St. Dev. of AOM | 0.22 | 0.21 | 0.22 | 0.33 |
| Disjoint Lung Regions | 0 | 2 | ||
To further analyze the performance of the complete automated method compared with radiologists, a Student's t-test was performed between 1) the AOM of Radiologist 1 and the complete automated method vs. the AOM of Radiologist 2 and the complete automated method (p=0.96), 2) the AOM of Radiologist 1 and the complete automated method vs. the AOM of Radiologist 1 and Radiologist 2 (p=0.67), and 3) the AOM of Radiologist 2 and the complete automated method vs. the AOM of Radiologist 1 and Radiologist 2 (p=0.61).
The complete automated method utilizes several empirically determined shape descriptor thresholds (Table 1) to segment lung regions. However, the empirically determined nature of these thresholds introduces the possibility of reducing robustness by over-training based on a given data set. The sensitivity of the complete method to each threshold was determined by varying each parameter threshold individually by both +30% and –30% and by determining the resulting AOM value between the complete automated method (with modified parameter thresholds) and both radiologists for the same 101 randomly selected sections. The maximum area threshold was not increased because lung region area should never exceed half the thoracic area. The complete set of mean AOM values is presented in Table 5. The greatest change in mean AOM value that results between the two modified thresholds for a single descriptor occurred for the x-axis center-of-mass range; the resulting change in mean AOM was 0.5%, suggesting that the complete automated method is robust to variations in shape descriptor thresholds.
Table 5.
Mean AOM values (±standard deviation) that result when different descriptor thresholds are implemented. Each threshold was varied by +30% and by –30% from the nominal value shown in Table 1.
| Descriptor | Nominal Threshold + 30% | Nominal Threshold – 30% |
|---|---|---|
| Core Maximum Area | - | 0.821 ± 0.145 |
| Core Minimum Area | 0.821 ± 0.145 | 0.821 ± 0.145 |
| Core Minimum Compactness | 0.821 ± 0.145 | 0.821 ± 0.145 |
| Core Minimum Contour Length | 0.821 ± 0.145 | 0.821 ± 0.145 |
| Complete Maximum Area | - | 0.822 ± 0.145 |
| Complete Minimum Area | 0.822 ± 0.144 | 0.821 ± 0.137 |
| Complete Minimum Compactness | 0.818 ± 0.155 | 0.821 ± 0.145 |
| Complete Minimum Contour Length | 0.821 ± 0.145 | 0.821 ± 0.145 |
| Complete Center of Mass Range (y-axis) | 0.821 ± 0.145 | 0.820 ± 0.145 |
| Complete Center of Mass Range (x-axis) | 0.817 ± 0.150 | 0.821 ± 0.145 |
| Minimum Circularity | 0.821 ± 0.145 | 0.821 ± 0.145 |
IV. DISCUSSION
The main goal of this study was to develop a fully automated method to segment lung regions from transverse MR sections. The method was run using unoptimized code written in Matlab 7 on an AMD XP 2500+ with 1 Gigabyte of RAM and the Linux operating system. The average total time per section for complete segmentation was 21 seconds. The average time per section to calculate acceptable thoracic and lung thresholds is 1.6s (corresponding to 7 iterations) and 0.6s (corresponding to 3 iterations) respectively. The remaining time per section is spent applying the rolling ball, minimizing filter, morphological filters, logical OR, grayscale erosion filter, and retrieving DICOM header information.
This study differs from previous MR segmentation studies by using an area-based segmentation approach and in the evaluation methodology by segmenting in the presence of disease. Previous segmentation methods concentrated on edge-based and model-based11 methods. The edge-based methods include application of active contours using non-linear diffusion,15 merging of multiple active contours,17 and an active contour/neural network combination16 to minimize the impact of imaging artifacts on segmentation accuracy. These studies utilize databases with vastly different size and composition and report results based on disparate evaluation methods. Specifically, most of these previous studies reported segmentation results from analysis of partial thoracic MR scans, MR scans without the specification of image acquisition parameters, or MR images without a description of possible diseases. The fully automated method presented in this study was evaluated on a large database of MR scans that contained a range of diseases, image artifacts, and acquisition parameters, including both contrast and non-contrast enhanced sections. The randomly sampled sections displayed a range of values for both extent and obscuration due to artifact and disease, thus making the sample set diverse. The application of the complete automated method to such a diverse clinical database and the resulting high AOM values suggest an encouraging level of robustness.
The first assessment of performance compared the core automated method with the complete automated method. The core method used only gray-level thresholding and regional shape descriptors to segment lung regions, while the complete method included the additional steps of grayscale erosion and rolling ball filtering. These additional steps substantially increased the segmentation accuracy as demonstrated by the AOM values of Tables 3 and 4. The AOM values between each radiologist and the complete automated method were both comparable with the AOM values achieved between radiologists. This suggests that, overall, the complete automated method performed very well when compared with differences among radiologists. The results of the paired Student's t-test support our notion that the automatically segmented lung regions are comparable to radiologist segmented lung regions and that the task specific lung segmentation modifications minimized the extent to which disease and artifact easily confounded the automated method.
The AOM values for the left lung were consistently lower than those for the right lung across all comparisons. This asymmetry is primarily due to cardiac motion artifact. The decision of how much of the great vessels to include within the lung regions complicates construction of the lung contour along the mediastinal aspects of both lungs; however, the position of the heart in the left hemithorax makes the left lung field especially susceptible to cardiac motion artifact, which increases the difficulty of constructing the mediastinal aspect of the left lung contour and increases the likelihood that left lung mediastinal contours will be constructed differently, thus decreasing the AOM value.
The lung bases are the most difficult part of the lung to automatically segment. The large regions are replaced by thin, irregular, C-shaped regions due to the intrusion of the diaphragm into the imaging plane. These sections are made even more irregular due to patient respiration, which introduces both motion and partial volume artifacts into the lung base regions. These sections had the lowest AOM values for radiologists vs. complete and core automated methods and for radiologist 1 vs. radiologist 2 as shown in Table 2. It should be noted, however, that although the AOM values were low between the complete automated method and the radiologists, these values were still comparable to the between-radiologist AOM values, thus implying satisfactory segmentation even in the difficult lung base sections.
V. CONCLUSION
Segmentation of MR images is complicated by severe image artifacts from multiple sources. We have created a method that is able to accurately segment lung regions even in the presence of artifact and disease. The automated methods were applied to the MR scans of patients with various disease states and levels of disease involvement. Comparison of the complete automated method with radiologists yielded AOM values that suggest segmentation accuracy comparable to human radiologists. The accuracy and robustness demonstrate the potential of these methods in larger research or clinical CAD systems for MR images analysis.
ACKNOWLEDGMENTS
The authors would like to thank Heber MacMahon, M.D., Charles Croteau, D.O., Devang Doshi, M.D., Nandini Menon, M.D., Milica Medved, Ph.D., and Gregory Karczmar, Ph.D. for their assistance with this project.
This work was supported in part by the Mesothelioma Applied Research Foundation, NIH Grant EB002103, and funding from The University of Chicago Cancer Research Center.
S.G. Armato holds warrants to shares in R2 Technology, Inc. (Sunnyvale, CA).
Footnotes
* Presented in part at the 2004 annual meeting of the AAPM and SPIE Medical Imaging 2005.
REFERENCES
- 1.Armato SG, 3rd, Giger ML, MacMahon H. Automated detection of lung nodules in CT scans: Preliminary results. Med Phys. 2001;28(8):1552. doi: 10.1118/1.1387272. [DOI] [PubMed] [Google Scholar]
- 2.Armato SG, 3rd, Sensakovic WF. Automated lung segmentation for thoracic CT impact on computer-aided diagnosis. Acad Radiol. 2004;11(9):1011. doi: 10.1016/j.acra.2004.06.005. [DOI] [PubMed] [Google Scholar]
- 3.Brown MS, Goldin JG, McNitt-Gray MF, et al. Knowledge-based segmentation of thoracic computed tomography images for assessment of split lung function. Med Phys. 2000;27(3):592. doi: 10.1118/1.598898. [DOI] [PubMed] [Google Scholar]
- 4.Brown MS, McNitt-Gray MF, Mankovich NJ, et al. Method for segmenting chest CT image data using an anatomical model: Preliminary results. IEEE Trans Med Imaging. 1997;16(6):828. doi: 10.1109/42.650879. [DOI] [PubMed] [Google Scholar]
- 5.Hoffman EA, Reinhardt JM, Sonka M, et al. Characterization of the interstitial lung diseases via density-based and texture-based analysis of computed tomography images of lung structure and function. Acad Radiol. 2003;10(10):1104. doi: 10.1016/s1076-6332(03)00330-1. [DOI] [PubMed] [Google Scholar]
- 6.Kalender WA, Fichte H, Bautz W, et al. Semiautomatic evaluation procedures for quantitative CT of the lung. J Comput Assist Tomogr. 1991;15(2):248. doi: 10.1097/00004728-199103000-00011. [DOI] [PubMed] [Google Scholar]
- 7.Morgan MD. Detection and quantification of pulmonary emphysema by computed tomography: A window of opportunity. Thorax. 1992;47(12):1001. doi: 10.1136/thx.47.12.1001. [DOI] [PMC free article] [PubMed] [Google Scholar]
- 8.Eibel R, Tuengerthal S, Schoenberg SO. The role of new imaging techniques in diagnosis and staging of malignant pleural mesothelioma. Curr Opin Oncol. 2003;15(2):131. doi: 10.1097/00001622-200303000-00003. [DOI] [PubMed] [Google Scholar]
- 9.Entwisle J. The use of magnetic resonance imaging in malignant mesothelioma. Lung Cancer 45 Suppl. 2004;1:S69. doi: 10.1016/j.lungcan.2004.04.015. [DOI] [PubMed] [Google Scholar]
- 10.Evans AL, Gleeson FV. Radiology in pleural disease: State of the art. Respirology. 2004;9(3):300. doi: 10.1111/j.1440-1843.2004.00599.x. [DOI] [PubMed] [Google Scholar]
- 11.Lelieveldt BP, van der Geest RJ, Rezaee MR, et al. Anatomical model matching with fuzzy implicit surfaces for segmentation of thoracic volume scans. IEEE Trans Med Imaging. 1999;18(3):218. doi: 10.1109/42.764893. [DOI] [PubMed] [Google Scholar]
- 12.Levin DL, Chen Q, Zhang M, et al. Evaluation of regional pulmonary perfusion using ultrafast magnetic resonance imaging. Magn Reson Med. 2001;46(1):166. doi: 10.1002/mrm.1172. [DOI] [PubMed] [Google Scholar]
- 13.Semelka RC, Cem Balci N, Wilber KP, et al. Breath-hold 3d gradient-echo MR imaging of the lung parenchyma: Evaluation of reproducibility of image quality in normals and preliminary observations in patients with disease. J Magn Reson Imaging. 2000;11(2):195. doi: 10.1002/(sici)1522-2586(200002)11:2<195::aid-jmri18>3.0.co;2-q. [DOI] [PubMed] [Google Scholar]
- 14.Weber MA, Bock M, Plathow C, et al. Asbestos-related pleural disease: Value of dedicated magnetic resonance imaging techniques. Invest Radiol. 2004;39(9):554. doi: 10.1097/01.rli.0000131888.39636.c5. [DOI] [PubMed] [Google Scholar]
- 15.Wei M, Zhou Y, Wan M. A fast snake model based on non-linear diffusion for medical image segmentation. Comput Med Imaging Graph. 2004;28(3):109. doi: 10.1016/j.compmedimag.2003.12.002. [DOI] [PubMed] [Google Scholar]
- 16.Middleton I, Damper RI. Segmentation of magnetic resonance images using a combination of neural networks and active contour models. Med Eng Phys. 2004;26(1):71. doi: 10.1016/s1350-4533(03)00137-1. [DOI] [PubMed] [Google Scholar]
- 17.Ray N, Acton ST, Altes T, et al. Merging parametric active contours within homogeneous image regions for MRI-based lung segmentation. IEEE Trans Med Imaging. 2003;22(2):189. doi: 10.1109/TMI.2002.808354. [DOI] [PubMed] [Google Scholar]
- 18.Hashemi RH, Bradley WG. MRI: The basics. Lippincott Williams, & Wilkins; Baltimore: 1997. [Google Scholar]
- 19.William F, Sensakovic, Samuel G, Armato, Starkey Adam. the Medical Imaging 2005: Image Processing. San Diego, CA, USA: 2005. [Google Scholar]
- 20.Sonka M, Hlavac V, Boyle R. Image processing, analysis, and machine vision. 2nd ed. International Thomson Publishing Inc.; 1999. [Google Scholar]
- 21.Giger ML, Doi K, MacMahon H. Image feature analysis and computer-aided diagnosis in digital radiography. 3. Automated detection of nodules in peripheral lung fields. Med Phys. 1988;15(2):158. doi: 10.1118/1.596247. [DOI] [PubMed] [Google Scholar]


