Abstract
Rationale and Objectives
Pulmonary hypertension (PH) is a complex and fatal disease that is difficult to diagnose non-invasively. This study evaluated previously published CT-based vessel measurement criteria and investigated the predictive power and diagnostic ability of the main pulmonary artery diameter (MPAD) and the ratio of MPAD to aorta diameter (rPA).
Materials and Methods
The database for this study consisted of 175 PH patients (for whom mean pulmonary artery pressure (mPAP) was known), 16 patients without PH but with known mPAP (non-PH patients), and 114 “normal” patients without known mPAP. The performance of previously published criteria, MPAD > 29 mm and rPA > 1, was determined. The relationship between vessel measurements and mPAP was evaluated through correlation and linear regression analysis. The ability of these measurements to discriminate between patients with and without PH was determined by receiver operating characteristic analysis.
Results
For discriminating between PH and “normal” patients, the sensitivity and specificity of the criterion MPAD>29mm were 0.89 (0.84-0.93) and 0.83 (0.76-0.90), respectively, and the sensitivity and specificity of the criterion rPA>1 were 0.89 (0.85-0.94) and 0.82 (0.74-0.89), respectively. At a specificity of 0.95 in the task of separating PH and “normal” patients, the sensitivity of MPAD was 0.81 (0.72-0.90) and the sensitivity of rPA was 0.76 (0.66-0.85), but the specificity for both decreased when non-PH patients were included. For the combined PH and non-PH patient groups, the correlation between the vessel measurements and mPAP was significant but low, and the ability of the vessel measurements to predict mPAP was limited.
Conclusion
This study found that the sensitivity of previously published vessel criteria for identifying PH patients is high but the specificity may not be high enough for routine use in a clinical patient population.
Keywords: Pulmonary hypertension, vessel measurement, pulmonary arterial hypertension, pulmonary artery diameter, pulmonary arterial pressure
INTRODUCTION
Pulmonary hypertension (PH) is a fatal disease that is not diagnosed early as patients typically present to their doctor with symptoms associated with advanced disease [1-3]. PH has a wide range of etiologies and requires a complex clinical classification scheme [4,5]. PH is classified into five groups. PH Group 1, which is known as pulmonary arterial hypertension (PAH), includes idiopathic PAH and heritable PAH among others, and PH Groups 2-5 include PH due to left heart disease, lung diseases and/or hypoxia, chronic thromboembolic disease, or multifactorial mechanisms, respectively. A mean arterial pulmonary pressure (mPAP) greater than 25mmHg at rest or greater than 30mmHg with exercise as determined by right heart catheterization is required but not sufficient to be diagnosed with PH since additional criteria must be met [4].
PH has non-specific symptoms that make it difficult to diagnose non-invasively. Consequently, patient evaluation normally requires numerous diagnostic tests. The diagnostic evaluation of PH includes physical exam, electrocardiography, pulmonary function tests, blood gas analysis, ventilation/perfusion (V/Q) scan, echocardiography, and RHC with vasodilatory testing. Although RHC is the gold standard for the diagnosis of PH [6], RHC is an invasive procedure. Echocardiography is a non-invasive means to assess heart function and blood pressures, but the accuracy of the pressure measurements obtained through echocardiography is suboptimal due to differences when compared with RHC [7-9].
Suspected PH patients have a thoracic computed tomography (CT) scan to investigate the lung parenchyma, to detect thromboembolic disease, and to evaluate anatomic adaptations that may result from PH, such as increased pulmonary artery diameter and vascular pruning. Previous research has investigated rule-based criteria for the diagnostic evaluation of PH based on vessel measurements on CT scans, including the main pulmonary artery diameter (MPAD) and the ratio of the MPAD to the diameter of the aorta (rPA) at the level of the bifurcation of the main pulmonary artery [10-20]. Some investigators have combined CT-based vessel measurements with parameters derived from echocardiography for improved accuracy in the diagnosis of PH [21, 22].
With regard to CT-based vessel measurements alone, an MPAD > 29 mm at the level of the PA bifurcation [10,11,13,15] and an rPA >1 [13-15] has been associated with PH. PH also may be identified by a segmental artery-to-bronchus diameter ratio >1 in at least three lobes in addition to a MPAD > 29mm in patients with parenchymal lung disease. Threshold analyses, however, may not be the best method for discrimination [16-18], and the present classification and differentiation between types of PH are not accounted for in these studies. The purpose of the present study was to investigate the sensitivity and specificity of existing vessel-diameter-based criteria, to evaluate the correlation between image-based MPAD, rPA, and catheterization measurements, and to determine the discriminatory capability of PA measurements to differentiate PH patients from “normal” patients using the current clinical definition of PH.
MATERIALS AND METHODS
The patients whose data were used for this study included 191 patients from an existing PH database [2] who had undergone RHC and, therefore, had known pulmonary arterial pressures and other relevant clinical information. A clinical thoracic CT scan acquired within 7 months of RHC was collected from the clinical picture archiving and communications system (PACS) for each of these patients; the time difference between CT scan acquisition and RHC was less than one month for 128 (67%) of these 191 patients. Of the patients who had undergone RHC, 175 (92%) patients were ultimately diagnosed with PH (“PH patients”), and the remaining 16 patients were not diagnosed with PH (“non-PH patients”). Both PH and non-PH were diagnosed according to the current definition and classification scheme [4]. Additionally, a clinical contrast-enhanced thoracic CT scan interpreted as “normal” was collected from 114 different patients (“normal patients”) based on a keyword search of the PACS; these scans were re-reviewed by an attending radiologist to ensure the absence of pulmonary or cardiac disease. RHC data was not available for these “normal” patients, although previous studies have investigated the normal range of CT-based MPAD in patients without pulmonary pathology and with normal mean pulmonary artery pressure (mPAP) [23]. It should be noted that the non-PH patients were not considered “normal,” since the diagnostic workup of their underlying cardiac and/or pulmonary disease necessitated RHC. All applicable Health Insurance Portability and Accountability Act (HIPAA) regulations were observed during this Institutional Review Board (IRB) approved study.
The CT scans used in this study had been acquired between 2004 and 2010. Of the 305 CT scans, 301 scans had been acquired at our institution on Philips (Cleveland, Ohio) scanners, and four scans had been performed at other institutions. CT scans had been acquired with a tube voltage of 120 kVp (n=261) or 140 kVp (n=44); reconstruction interval of 1 mm (n=294), 2 mm (n=1), 3 mm (n=7), or 5 mm (n=3); and slice thickness less than 1.0 mm (n=2), 1.0-1.9 mm (n=279), 2.0-2.9 mm (n=14), or 3.0-5.0 mm (n=10). 250 CT scans had been acquired infused with contrast, and 55 CT scans were non-infused.
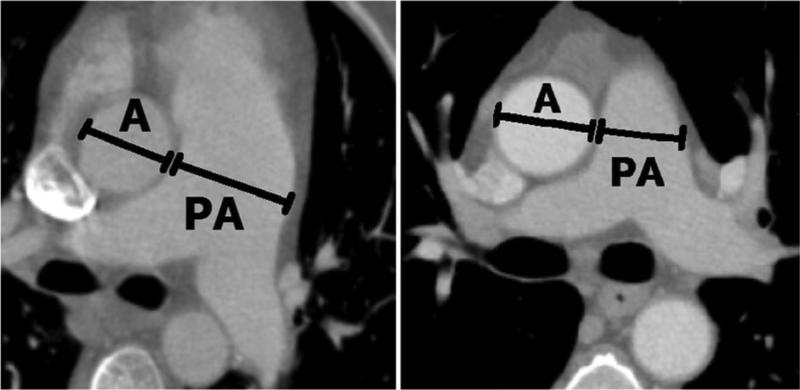
Each CT scan was displayed on a computer interface through which an observer [NC] identified the axial CT section that depicted the bifurcation of the main pulmonary artery and manually measured the diameters of the main pulmonary artery and the aorta (see Figure 1). The observer was blinded to the pulmonary arterial pressure data. The locations, lengths, and orientations of all measurements were recorded for analysis.
Figure 1.
Vessel measurements obtained from CT scans. (a) The diameter of an enlarged pulmonary artery (PA) from an IPAH patient (compare with the aorta (A) diameter). (b) An aorta and pulmonary artery diameter from a “normal” patient.
Statistics
The previously published vessel diameter criteria (MPAD > 29 mm and rPA > 1) were applied to the CT scans of all 305 patients [10,11,13-15]. The sensitivity and specificity of these criteria in the task of distinguishing between patients with and without PH were determined.
For the 191 patients with RHC data (the PH patients and the non-PH patients), Pearson and Spearman correlations between vessel measurements (MPAD and rPA) and vessel pressure (mPAP) were computed. Correlations also were computed for patients within the four PH subgroups: idiopathic PAH/heritable PAH (IPAH/HPAH), connective tissue diseases (CTD), PH due to left heart disease (PHLHD), and chronic thromboembolic PH (CTEPH). Linear regression analysis was performed to assess the relationship between MPAD and rPA measurements and mPAP. A variety of vessel-diameter-based models were tested; the models tested were standard mathematical models of increasing complexity, ranging from linear to quadratic to linear-quadratic (MPAD, MPAD2, MPAD+MPAD2, rPA, rPA2, and (MPAD+MPAD2)/(A+A2), where A is aorta diameter). Age, gender, and body surface area were tested independently. For each model, the interaction between the covariate age and the vessel diameter variables also was evaluated. The Akaike information criterion (AIC) [24], a measure of a statistical model's goodness of fit, was calculated and used to rank the models.
Receiver operating characteristic (ROC) analysis [25] was used to evaluate the ability of MPAD and rPA to classify patients with and without PH. These analyses were performed for two pairs of patient groups: PH patients (n=175) versus “normal” patients (n=114) and PH patients versus “normal” and non-PH patients (n=114+16). The abilities of MPAD and rPA to distinguish between “normal” patients and each of the four subgroups of PH patients (IPAH/HPAH, CTD, PHLHD, and CTEPH) also were evaluated.
RESULTS
Table 1 presents demographic information for all three groups of patients along with mPAP, pulmonary capillary wedge pressure, and body surface area for the PH patients and non-PH patients (the “normal” patients did not undergo RHC). Table 2 illustrates the distribution of the 175 PH patients according to the current clinical classification of PH [4]. Four subgroups were analyzed as subsets of PH: Idiopathic/Heritable PAH (IPAH/HPAH), PAH associated with connective tissue diseases (CTD), PH associated with left heart diseases (PHLHD), and chronic thromboembolic pulmonary hypertension (CTEPH).
Table 1.
Summary of patient demographic and clinical information.
| Patient Group | Total | Male/Female | Mean Age (Range) (yrs) | CT scan Infused/Non-Infused | Mean mPAP (range) (mmHg) | Mean Pulmonary Capillary Wedge Pressure (range) (mmHg) | Mean Body Surface Area (m2) |
|---|---|---|---|---|---|---|---|
| PH | 175 | 42/133 | 54 (14-86) | 125/50 | 46 (15-78) | 13 (1-45) | 1.9 (1.3-2.6) |
| non-PH | 16 | 5/11 | 57 (27-79) | 11/5 | 18 (12-37) | 10 (5-32) | 1.9 (1.5-2.4) |
| “normal” | 114 | 49/65 | 47 (13-83) | 114/0 | N/A | N/A | N/A |
mPAP = mean pulmonary artery pressure
Table 2.
Distribution of PH patients (n=175) by clinical classification.
| Total | Clinical Classification of PH | |
|---|---|---|
| 89 | 1. Pulmonary Arterial Hypertension (PAH) | |
| IPAH/HPAH | n=28 | |
| Assoc with CTD | n=36 | |
| Assoc with portal hypertension | n=13 | |
| Assoc with congenital heart | n=6 | |
| Other within PAH | n=6 | |
| 5 | 1'. PVOD and/or PCH | |
| 33 | 2. PHLHD | |
| 10 | 3. PH assoc with lung diseases and/or hypoxia | |
| 19 | 4. CTEPH | |
| 19 | 5. PH with unclear multifactorial mechanisms | |
| Sarcoidosis | n=17 | |
| Other | n=2 | |
IPAH = idiopathic PAH
HPAH = heritable PAH
CTD = connective tissue disease
PVOD = pulmonary veno-occlusive disease
PCH = pulmonary capillary hemangiomatosis
PHLHD = PH associated with left heart diseases
CTEPH = chronic thromboembolic pulmonary hypertension
Demographics
Figure 1 demonstrates the vessel diameters captured in this study. The vessel measurements acquired from the 305 patients in this study (175 PH patients, 16 non-PH patients, and 114 “normal” patients) are summarized in Table 3. For PH patients, the mean MPAD was 36.4 mm, and the mean rPA was 1.27. For “normal” patients, the mean MPAD was 24.9 mm, and the mean rPA was 0.87. For the combined non-PH and “normal” patient groups, the mean MPAD was 25.4 mm, and the mean rPA was 0.88. Application of previously published vessel measurement criteria for the diagnosis of PH (MPAD > 29 mm and rPA > 1) to the present patient cohort generated the sensitivities and specificities presented in Table 4. Specificities tended to decrease with the combined “normal” patients and non-PH patients relative to those attained with the “normal” patients alone.
Table 3.
Vessel measurements by patient group. “Aorta” refers to the diameter of the aorta. MPAD and “Aorta” were measured at the level of the bifurcation of the main pulmonary artery on the same CT section. p values are based on Student's t-test.
| Patient Group | Total | MPAD (mm) Mean ± SD (range) | p* | rPA Mean ± SD (range) | p* | Aorta (mm) Mean ± SD (range) | p* |
|---|---|---|---|---|---|---|---|
| PH | 175 | 36.4 ± 6.68 (24.2-70.6) | < 0.05 | 1.27 ± 0.28 (0.70-2.20) | < 0.05 | 29.3 ± 4.37 (18.8-39.9) | 0.2 |
| non-PH | 16 | 28.6 ± 5.48 (17.7-35.6) | 0.98 ± 0.17 (0.55-1.26) | 29.4 ± 3.44 (22.9-36.1) | |||
| “normal” | 114 | 24.9 ± 3.66 (17.7-34.0) | 0.87 ± 0.13 (0.56-1.24) | 29.0 ± 4.40 (17.3-44.3) | |||
| “normal” + non-PH | 130 | 25.4 ± 4.08 (17.7-35.6) | 0.88 ± 0.14 (0.55-1.26) | 29.1 ± 4.28 (17.3-44.3) |
p-values comparing PH vs “normal”
SD=standard deviation
Table 4.
Sensitivity or specificity (with 95% confidence intervals) obtained from application of the previously reported vessel measurement criteria for PH diagnosis to the present patient cohort.
| Vessel Measurement Criteria | ||
|---|---|---|
| Patient Group | MPAD > 29 mm | rPA > 1 |
| PH (sensitivity) | 0.89 (0.84-0.93) | 0.89 (0.85-0.94) |
| “normal” (specificity) | 0.83 (0.76-0.90) | 0.82 (0.74-0.89) |
| “normal” + non-PH (specificity) | 0.79 (0.71-0.86) | 0.79 (0.71-0.86) |
Correlations and Linear Regression Analyses
Table 5 presents the Pearson's correlation coefficients and the Spearman's correlation coefficients between MPAD or rPA and mPAP for the combined PH and non-PH patient groups. Also presented in Table 5 are the Pearson's and Spearman's correlation coefficients relating MPAD and rPA to mPAP for the PH subgroups IPAH/HPAH, CTD, PHLHD, and CTEPH.
Table 5.
Pearson's/Spearman's correlation coefficients relating mPAP to vessel measurements for the combined PH and non-PH patient groups and for different PH subgroups.
| Patient Group | MPAD | rPA |
|---|---|---|
| PH + non-PH | 0.34*/0.35* | 0.40*/0.40* |
| IPAH/HPAH | 0.093/−0.14 | 0.034/−0.019 |
| CTD | 0.19/0.35* | 0.12/0.20 |
| PHLHD | 0.32/0.35* | 0.40*/0.30 |
| CTEPH | 0.43/0.49* | 0.39/0.43 |
p<0.05
IPAH = idiopathic PAH
HPAH = heritable PAH
CTD = connective tissue disease
PHLHD = PH owing to left heart diseases
CTEPH = chronic thromboembolic pulmonary hypertension
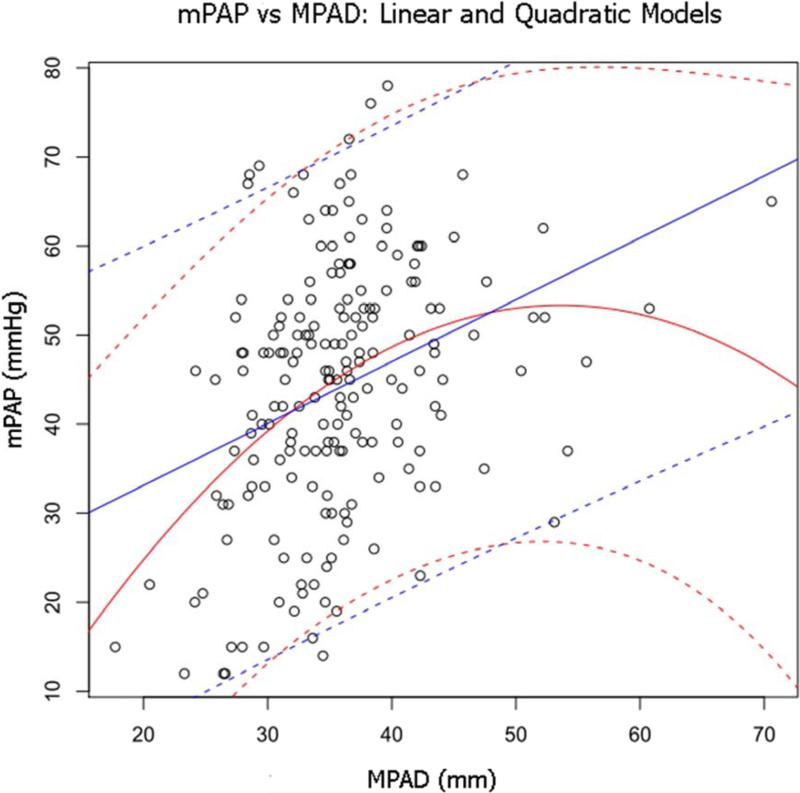
The linear regression analysis that investigated the relationship between vessel measurements and mPAP for the two patient groups with pressure measurements from RHC (the PH and non-PH patients) also investigated the patient variables age, sex, and body surface area, of which only age was found to be significantly related to mPAP in univariate analysis at the p=0.05 level. Three MPAD-based models were found to be significantly related to mPAP at the p=0.05 level: MPAD, MPAD2, and MPAD + MPAD2. When these models were ranked by AIC, the linear-quadratic model (MPAD + MPAD2) was ranked first with the lowest AIC value (AIC=1513). This model yielded coefficients for the MPAD and MPAD2 terms of 2.71 and −0.025, respectively, both with p < 0.05, and an intercept of −19.3. When age was added to this model, the age term was not significant, and there was no significant interaction between age and MPAD + MPAD2. Figure 2 shows the MPAD linear model (ranked second with an AIC value of 1537) and the MPAD + MPAD2 linear-quadratic model, both with 95% confidence bands, superimposed on a scatter plot of mPAP versus MPAD.
Figure 2.
Scatter plot of mPAP versus MPAD for the combined PH and non-PH patient groups. Superimposed on the scatter plot is the line of regression from the linear model (MPAD) (straight solid line) with 95% prediction bands (straight dashed lines) and the line of regression from the linear-quadratic model (MPAD + MPAD2) (curved solid line) with 95% prediction bands (curved dashed lines).
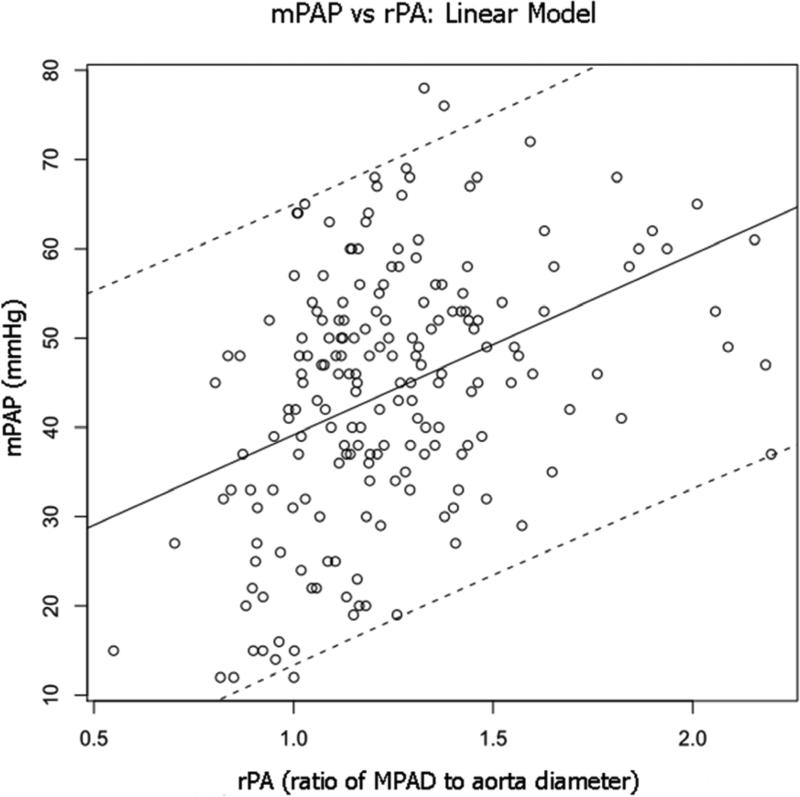
Linear regression analysis revealed three rPA-based models that were significantly related to mPAP at the p=0.05 level: rPA, rPA2, and (MPAD+MPAD2)/(A+A2). When these models were ranked by the AIC, the linear model (rPA) was ranked first with the lowest AIC value (AIC=1526). This model yielded a coefficient for rPA of 20.2 (p < 0.05) and an intercept of 19.0. When age was added to the model, the age term was not significant, and there was no significant interaction between age and rPA. Figure 3 shows the rPA model, with 95% confidence bands, superimposed on a scatter plot of mPAP versus rPA.
Figure 3.
Scatter plot of mPAP versus rPA for the combined PH and non-PH patient groups. Superimposed on the scatter plot is the line of regression for the linear model (rPA) (solid line) with 95% prediction bands (dashed lines).
ROC analyses
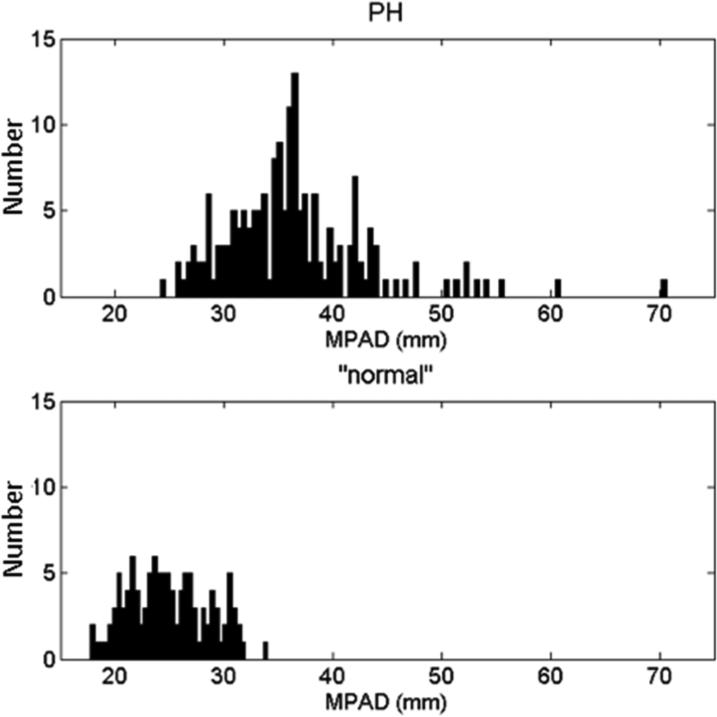
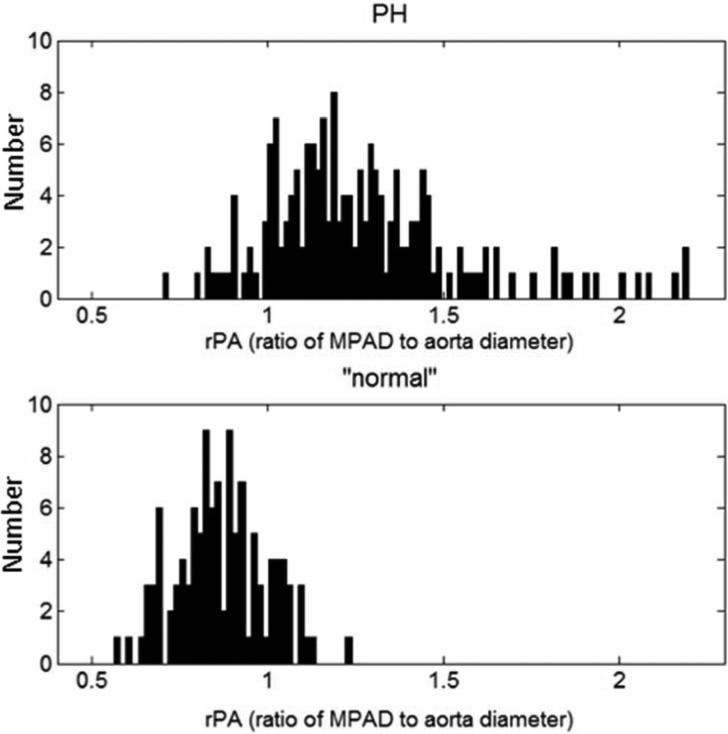
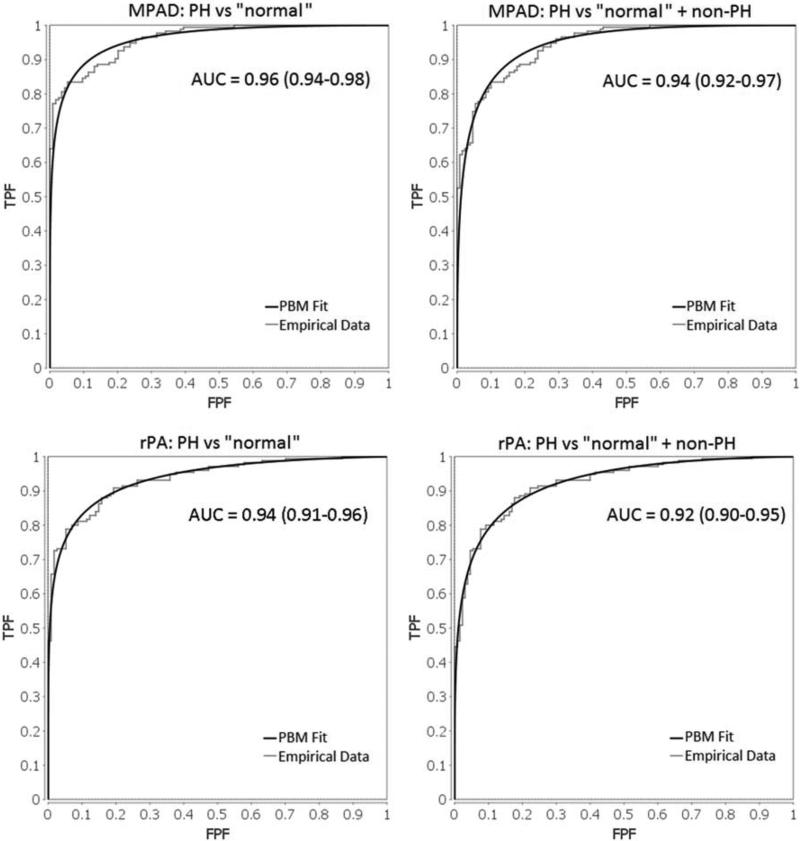
Histograms of MPAD and rPA for the PH and “normal” patient groups are shown in Figure 4. Note that the distributions of MPAD and rPA are wider for the PH patient group than for the “normal” patient group, which indicates that these vessel measurements are more variable among PH patients. ROC analysis was performed to evaluate the overall ability of MPAD and rPA to individually classify patients into two groups (those with PH and those without PH) without predefined thresholds. The area under the ROC curve (AUC) value, a measure of classification performance, for this task is presented in Table 6 for each vessel measurement. Also presented in Table 6 are AUC values that reflect the ability of MPAD and rPA to distinguish different PH subgroups from “normal” patients. Based on AUC value, MPAD performed slightly better than rPA for all classification tasks. The empirical and proper binormal model (PBM) [25] ROC curves that capture the ability of MPAD and rPA to individually classify patients into two groups (those with PH and those without PH) are shown in Figure 5. Those without PH include “normal” or the combined group of “normal” and non-PH.
Figure 4.
Distributions of (a) measured MPAD values and (b) measured rPA values for the PH patients and the “normal” patients.
Table 6.
AUC values (with 95% confidence intervals) obtained from ROC analysis performed to evaluate the ability of vessel measurements to distinguish between different patient groups.
| Vessel Measurement | ||
|---|---|---|
| Classification Task | MPAD | rPA |
| PH vs. “normal” | 0.96 (0.94-0.98) | 0.94 (0.91-0.96) |
| PH vs. “normal” + non-PH | 0.94 (0.92-0.97) | 0.92 (0.90-0.95) |
| IPAH/HPAH vs. “normal” | 0.98 (0.94-1.00) | 0.97 (0.93-1.00) |
| CTD vs. “normal” | 0.92 (0.87-0.98) | 0.88 (0.81-0.96) |
| PHLHD vs. “normal” | 0.98 (0.95-1.00) | 0.92 (0.86-0.98) |
| CTEPH vs. “normal” | 0.96 (0.91-1.00) | 0.95 (0.89-1.00) |
IPAH = idiopathic PAH
HPAH = heritable PAH
CTD = connective tissue disease
PHLHD = PH owing to left heart diseases
CTEPH = chronic thromboembolic pulmonary hypertension
Figure 5.
Emprical and proper binormal model (PBM) ROC curves for the ability of MPAD (top left: PH vs “normal ”, top right: PH vs “normal ” + non-PH) and rPA (bottom left: PH vs “normal ”, bottom right: PH vs “normal ” + non-PH) to individually classify patients into two groups (those with PH and those without PH).
The sensitivities at a specificity of 0.95 and 0.90 as computed by the PBM are shown in Table 7 for the tasks of using MPAD and rPA to distinguish between the PH patients and “normal” patients (or “normal” patients plus non-PH patients). If MPAD or rPA is used to differentiate between PH patients and “normal” patients plus non-PH patients, the sensitivities are lower than the corresponding sensitivities achieved for the differentiation between PH patients and “normal” patients alone. Empirical sensitivities and their vessel measurement thresholds are shown in Table 8 and differ from the proper binormal model sensitivities reported in Table 7. Empirically, the sensitivities of 0.82 and 0.85 at specificities of approximately 0.95 and 0.90, respectively, correspond to MPAD thresholds of MPAD> 31.0mm and a MPAD > 30.5mm, respectively. Empirically, the sensitivities of 0.75 and 0.81 at specificities of approximately 0.95 and 0.90, respectively, correspond to rPA thresholds of rPA > 1.08 and rPA > 1.04, respectively.
Table 7.
Sensitivities (with 95% confidence intervals) obtained at specificities of 0.95 and 0.90 when MPAD and rPA are evaluated in the task of separating PH patients from “normal” patients and from “normal” patients plus non-PH patients as computed by the proper binormal model.
| Vessel Measurement | |||
|---|---|---|---|
| Classification Task | Spec | MPAD | rPA |
| PH vs. “normal” | 0.95 | 0.81 (0.72-0.90) | 0.76 (0.66-0.85) |
| 0.90 | 0.88 (0.83-0.94) | 0.83 (0.76-0.90) | |
| PH vs. “normal” + non-PH | 0.95 | 0.73 (0.62-0.84) | 0.70 (0.60-0.80) |
| 0.90 | 0.83 (0.76-0.91) | 0.79 (0.71-0.87) | |
Spec = specificity
Table 8.
Empirical sensitivities and vessel measurement thresholds obtained at specificities of approximately 0.95 and 0.90 when MPAD and rPA are evaluated in the task of separating PH patients from “normal” patients.
| PH vs. “normal” | |||
|---|---|---|---|
| Vessel Measurement | Spec | Sensitivity | |
| MPAD | 0.95 | MPAD > 31.0mm | 0.82 |
| 0.90 | MPAD > 30.5mm | 0.85 | |
| rPA | 0.95 | rPA > 1.08 | 0.75 |
| 0.90 | rPA > 1.04 | 0.81 | |
Spec = specificity
DISCUSSION
This study evaluated the relationship between CT-based vessel measurements and (1) pulmonary pressures and (2) disease status among 175 PH patients, 16 non-PH patients, and 114 “normal” patients. While previous studies investigated rule-based criteria for the diagnosis of PH, the present study investigated the relationship of two CT-based vessel measurements (MPAD and rPA) and mPAP through correlation, linear regression analysis, and the ability of these vessel measurements to discriminate between patients with and without PH through ROC analysis. Based on the findings of the present study, the sensitivity of the previously published criteria is likely sufficiently high, but the specificity for “normal” patients might be too low given the low prevalence of PH, although the prevalence of PH is expected to be higher among patients with clinical conditions that warrant a thoracic CT scan. Since specificity decreased when non-PH patients were included, it is expected that the specificity of these vessel-measurement criteria in a real-world clinical setting (i.e. a mixed population of PH and non-PH patients who are not “normal” patients) may be even lower. Consequently, based on previously published criteria alone, radiologists may flag too many patients without PH for further PH-based workup. Given the low prevalence of pulmonary hypertension, 5 or less per one million, the positive predictive value (PPV) will be low since PPV is prevalence dependent, unlike sensitivity. A more practical specificity could be achieved if the vessel-measurement thresholds were increased; however, such an increase would detrimentally affect sensitivity.
The mean MPAD and rPA for the PH patients significantly exceeded the corresponding mean values for the “normal” patient group. The correlation coefficients between vessel measurements and mPAP were low but significant for PH and non-PH patients. The correlation coefficients between vessel measurements and mPAP for the PH subgroups were all low and mostly non-significant. Although the linear regression models that related mPAP to vessel measurements were found to be significant, the large width of the 95% prediction bands for both the linear and quadratic models demonstrate the inability of either MPAD or rPA, considered as continuous variables, to reliably predict mPAP.
Lastly, the vessel measurements were evaluated by ROC analysis to determine their ability to classify different groups of patients. For each classification task, the vessel measurement MPAD appeared to perform better than rPA. For the distinction between PH and “normal” patients, the AUC values for all vessel measurements are optimistic, since the “normal” patients are the “healthiest” patients that undergo thoracic CT scanning. For a low-prevalence disease such as PH, the sensitivity at a high specificity of 0.95 or 0.90 is a more important practical value than the overall AUC, since increased sensitivity comes at the expense of more false positives.
The low but statistically significant correlations between (1) MPAD and mPAP and (2) rPa and mPAP ( r = 0.34 and r = 0.40, respectively) found in this study were determined for the combined group of PH patients and non-PH patients. Mahammedi reported moderate but statistically significant correlations, r= 0.51 and r= 0.53, for a group of 298 PH patients and 102 non-PH patients (who underwent RHC but did not have PH) [20]. Devaraj reported a moderate but statistically significant correlation of r = 0.45 between rPa and mPAP for a group of 56 PH patients and 21 non-PH patients (RHC, but not PH) [22]. The low-to-moderate correlations found in both studies reflect the limited ability of vessel measurements to predict mPAP, which ultimately manifests as a limited ability of vessel measurements to identify (screen) PH patients. As demonstrated by Mahammedi, the vessel measurement method utilized in the present study is the method found to have the highest correlation with mPAP.
A meaningful comparison between the results of previous studies and the present study is difficult due to the different types of controls used. The controls in the present study were patients with a normal (unremarkable) chest CT scan that was required as part of the patients’ medical workup, while the controls in the Mahammedi study were patients that required RHC and chest CT as part of their workup, but did not have PH. The severity of illness is probably greater in patients that required RHC, so the underlying patient populations of the two control groups are different. Additionally, the goal of non-invasive CT vessel measurements is to identify people that may have PH and require RHC, not to diagnose PH, which, by definition, requires RHC for diagnosis. Once a patient has received RHC, noninvasive CT vessel measurements are not used for diagnosis.
Limitations
Data regarding patient treatment for PH at the time of RHC and CT scan were not collected; if a patient were on treatment, a lower mPAP would be expected. Ideally, the CT scan and RHC would occur on the same day, but this situation was relatively rare. The requirement that the span of time between RHC and CT scan acquisition not exceed 7 months was an arbitrary criterion approved by a cardiologist with a PH specialty. A less stringent requirement would have increased the number of patients available for this study, but the “truth” about the disease state captured by the CT scan becomes less reliable as the time between CT scan and RHC increases.
The 114 “normal” patients lacked any evident cardiac or pulmonary disease, as indicated in the corresponding radiology report and confirmed by a radiologist who re-reviewed these CT scans specifically for this study. It is possible that some of the “normal” patients had a disease process that was not evident on their thoracic CT scan. Indeed, some indication must have led to the ordering of the scan. Furthermore, since the “normal” patients did not undergo RHC, it is possible that a “normal” patient could have had an elevated mPAP. To obtain the data necessary for the analyses performed in this study, data from three different groups of patients were collected retrospectively, which may represent a selection bias; the clinical value of the results of this study must be evaluated through a larger prospective study that captures the clinical workflow of patients with suspected PH.
CONCLUSION
The purpose of this study was to investigate the correlation of vessel-based measurements obtained from CT scans with mPAP and to evaluate the ability of such measurements to discriminate between patients with and without PH. When applied to the patient cohort in this study, previous rule-based vessel-measurement criteria for PH diagnosis have a specificity that may be too low in a clinical setting to identify patients for further PH workup, namely because of the low prevalence of PH. Linear regression analysis of two vessel measurements, MPAD and rPA, demonstrated the inability of either to accurately predict mPAP. While the AUC values for MPAD and rPA in the classification of patients with and without PH appear high, perhaps the more important performance metric is sensitivity at a high specificity, and these values are lower. The non-invasive diagnosis of PH is a worthwhile pursuit; this study further investigated CT-based measurements of vessel diameters as a diagnostic tool in this setting and found that, while the sensitivity of such measurements is high, the specificity may not be high enough for routine use in a clinical patient population. A future prospective study that specifically targets patients who undergo CT scanning for relevant indications must be conducted.
ACKNOWLEDGMENTS
Supported, in part, by the Medical Scientist Training Program of the Pritzker School of Medicine at The University of Chicago and by the Carl J. Vyborny Translational Laboratory for Breast Imaging Research. The authors would like to thank Lorenzo Pesce, Ph.D., for helpful discussions.
Footnotes
Publisher's Disclaimer: This is a PDF file of an unedited manuscript that has been accepted for publication. As a service to our customers we are providing this early version of the manuscript. The manuscript will undergo copyediting, typesetting, and review of the resulting proof before it is published in its final citable form. Please note that during the production process errors may be discovered which could affect the content, and all legal disclaimers that apply to the journal pertain.
Disclosure statement: SGA receives royalties and licensing fees through The University of Chicago related to computer-aided diagnosis.
REFERENCES
- 1.Brown LM, Chen H, Halpern S, et al. Delay in recognition of pulmonary arterial hypertension: factors identified from the REVEAL Registry. Chest. 2011;140:19–26. doi: 10.1378/chest.10-1166. [DOI] [PMC free article] [PubMed] [Google Scholar]
- 2.Thenappan T, Shah SJ, Rich S, Gomberg-Maitland M. A USA-based registry for pulmonary arterial hypertension: 1982-2006. Eur Respir J. 2007;30:1103–1110. doi: 10.1183/09031936.00042107. [DOI] [PubMed] [Google Scholar]
- 3.Humbert M, Sitbon O, Chaouat A, et al. Pulmonary arterial hypertension in France: results from a national registry. Am J Respir Crit Care Med. 2006;173:1023–1030. doi: 10.1164/rccm.200510-1668OC. [DOI] [PubMed] [Google Scholar]
- 4.Simonneau G, Robbins IM, Beghetti M, et al. Updated clinical classification of pulmonary hypertension. J Am Coll Cardiol. 2009;54:S43–54. doi: 10.1016/j.jacc.2009.04.012. [DOI] [PubMed] [Google Scholar]
- 5.Barst RJ, McGoon M, Torbicki A, et al. Diagnosis and differential assessment of pulmonary arterial hypertension. J Am Coll Cardiol. 2004;43:40S–47S. doi: 10.1016/j.jacc.2004.02.032. [DOI] [PubMed] [Google Scholar]
- 6.Badesch DB, Champion HC, Sanchez MA, et al. Diagnosis and assessment of pulmonary arterial hypertension. J Am Coll Cardiol. 2009;54:S55–66. doi: 10.1016/j.jacc.2009.04.011. [DOI] [PubMed] [Google Scholar]
- 7.Bossone E, Bodini BD, Mazza A, Allegra L. Pulmonary arterial hypertension: the key role of echocardiography. Chest. 2005;127:1836–1843. doi: 10.1378/chest.127.5.1836. [DOI] [PubMed] [Google Scholar]
- 8.Hsu VM, Moreyra AE, Wilson AC, et al. Assessment of pulmonary arterial hypertension in patients with systemic sclerosis: comparison of noninvasive tests with results of right-heart catheterization. J Rheumatol. 2008;35:458–465. [PubMed] [Google Scholar]
- 9.Swanson KL, Utz JP, Krowka MJ. Doppler echocardiography-right heart catheterization relationships in patients with idiopathic pulmonary fibrosis and suspected pulmonary hypertension. Med Sci Monit. 2008;14:CR177–82. [PubMed] [Google Scholar]
- 10.Kuriyama K, Gamsu G, Stern RG, Cann CE, Herfkens RJ, Brundage BH. CT-determined pulmonary artery diameters in predicting pulmonary hypertension. Invest Radiol. 1984;19:16–22. doi: 10.1097/00004424-198401000-00005. [DOI] [PubMed] [Google Scholar]
- 11.Edwards PD, Bull RK, Coulden R. CT measurement of main pulmonary artery diameter. Br J Radiol. 1998;71:1018–1020. doi: 10.1259/bjr.71.850.10211060. [DOI] [PubMed] [Google Scholar]
- 12.Tan RT, Kuzo R, Goodman LR, Siegel R, Haasler GB, Presberg KW. Chest. Vol. 113. Medical College of Wisconsin Lung Transplant Group.; 1998. Utility of CT scan evaluation for predicting pulmonary hypertension in patients with parenchymal lung disease. pp. 1250–1256. [DOI] [PubMed] [Google Scholar]
- 13.Sanal S, Aronow WS, Ravipati G, Maguire GP, Belkin RN, Lehrman SG. Prediction of moderate or severe pulmonary hypertension by main pulmonary artery diameter and main pulmonary artery diameter/ascending aorta diameter in pulmonary embolism. Cardiol Rev. 2006;14:213–214. doi: 10.1097/01.crd.0000181619.87084.8b. [DOI] [PubMed] [Google Scholar]
- 14.Ng CS, Wells AU, Padley SP. A CT sign of chronic pulmonary arterial hypertension: the ratio of main pulmonary artery to aortic diameter. J Thorac Imaging. 1999;14:270–278. doi: 10.1097/00005382-199910000-00007. [DOI] [PubMed] [Google Scholar]
- 15.Perez-Enguix D, Morales P, Tomas JM, Vera F, Lloret RM. Computed tomographic screening of pulmonary arterial hypertension in candidates for lung transplantation. Transplant Proc. 2007;39:2405–2408. doi: 10.1016/j.transproceed.2007.07.055. [DOI] [PubMed] [Google Scholar]
- 16.Zisman DA, Karlamangla AS, Ross DJ, et al. High-resolution chest CT findings do not predict the presence of pulmonary hypertension in advanced idiopathic pulmonary fibrosis. Chest. 2007;132:773–779. doi: 10.1378/chest.07-0116. [DOI] [PMC free article] [PubMed] [Google Scholar]
- 17.Moore NR, Scott JP, Flower CD, Higenbottam TW. The relationship between pulmonary artery pressure and pulmonary artery diameter in pulmonary hypertension. Clin Radiol. 1988;39:486–489. doi: 10.1016/s0009-9260(88)80205-8. [DOI] [PubMed] [Google Scholar]
- 18.Haimovici JB, Trotman-Dickenson B, Halpern EF, et al. Relationship between pulmonary artery diameter at computed tomography and pulmonary artery pressures at right-sided heart catheterization. Massachusetts General Hospital Lung Transplantation Program. Acad Radiol. 1997;4:327–334. doi: 10.1016/s1076-6332(97)80111-0. [DOI] [PubMed] [Google Scholar]
- 19.Froelich JJ, Koenig H, Knaak L, Krass S, Klose KJ. Relationship between pulmonary artery volumes at computed tomography and pulmonary artery pressures in patients with- and without pulmonary hypertension. Eur J Radiol. 2008;67:466–471. doi: 10.1016/j.ejrad.2007.08.022. [DOI] [PubMed] [Google Scholar]
- 20.Mahammedi A, Oshmyansky A, Hassoun PM, Thiemann DR, Siegelman SS. Pulmonary artery measurements in pulmonary hypertension: the role of computed tomography. J Thorac Imaging. 2013;28:96–103. doi: 10.1097/RTI.0b013e318271c2eb. [DOI] [PubMed] [Google Scholar]
- 21.Condliffe R, Radon M, Hurdman J, et al. CT pulmonary angiography combined with echocardiography in suspected systemic sclerosis-associated pulmonary arterial hypertension. Rheumatology (Oxford) 2011;50:1480–1486. doi: 10.1093/rheumatology/ker114. [DOI] [PubMed] [Google Scholar]
- 22.Devaraj A, Wells AU, Meister MG, Corte TJ, Wort SJ, Hansell DM. Detection of pulmonary hypertension with multidetector CT and echocardiography alone and in combination. Radiology. 2010;254:609–616. doi: 10.1148/radiol.09090548. [DOI] [PubMed] [Google Scholar]
- 23.Karazincir S, Balci A, Seyfeli E, et al. CT assessment of main pulmonary artery diameter. Diagn Interv Radiol. 2008;14:72–74. [PubMed] [Google Scholar]
- 24.Akaike H. A new look at the statistical model identification. IEEE Transactions on Automatic Control. 1974;19:716–723. [Google Scholar]
- 25.Metz CE, Pan X. “Proper” Binormal ROC Curves: Theory and Maximum-Likelihood Estimation. J Math Psychol. 1999;43:1–33. doi: 10.1006/jmps.1998.1218. [DOI] [PubMed] [Google Scholar]


