

Abstract

Identifying determinant(s) of protein thermostability is key for rational and data-driven protein engineering. By analyzing more than 130 pairs of mesophilic/(hyper)thermophilic proteins, we identified the quality (residue-wise energy) of hydrophobic interactions as a key factor for protein thermostability. This distinguishes our study from previous ones that investigated predominantly structural determinants. Considering this key factor, we successfully discriminated between pairs of mesophilic/(hyper)thermophilic proteins (discrimination accuracy: ∼80%) and searched for structural weak spots in E. coli dihydrofolate reductase (classification accuracy: 70%).
Thermostable enzymes are sought after in industrial biotechnology because they allow carrying out biocatalysis at elevated temperatures, leading to an increase in reaction rates and, thus, making industrial processes economically more favorable.1,2 Proteins from thermophilic and hyperthermophilic organisms tend to be more thermostable than their counterparts from mesophilic organisms.1,3 This makes identifying and using enzymes from (hyper)thermophilic organisms an obvious approach in industrial biotechnology.4,5 Screening large metagenomic libraries in search of a protein with desired properties is cumbersome, however.6 Engineering proteins to improve thermostability is a promising alternative.7 Directed evolution,8 rational design,9 and data-driven approaches10 have been successfully applied for this.
The latter two approaches require knowledge of the mechanisms of how a protein can be made more thermostable. Comparisons of pairs of meso- and (hyper)thermophilic proteins have revealed several such mechanisms,11,12 including improved hydrogen bonding,13 ion pair and salt bridge networks,12 better hydrophobic packing,14 shortening of loops,15 higher secondary structure content,16 and increased rigidity of a protein.17−21 As this list indicates, the focus of these analyses has been on structural factors, which may be the reason why different determinants of thermostability have been revealed.
In the present study, we systematically analyze a large data set of 132 pairs of mesophilic/thermophilic and 149 pairs of mesophilic/hyperthermophilic homologous protomers with the aim to identify the dominant determinant(s) of protein thermostability. To do so, we compared residue-wise interaction energy components and developed a hierarchical 3-D clustering of residues in a protein structure based on the energy components for discriminating mesophilic and (hyper)thermophilic proteins. The clustering reveals that (hyper)thermophilic proteins have larger clusters of residues of good hydrophobic contacts than their mesophilic counterparts. Compared to previous studies,12,14,22,23 our results thus emphasize the quality (energy) of hydrophobic interactions as a discriminating factor rather than the sheer size of a cluster of hydrophobic residues. Thereby, our approach also allows suggesting residues where mutations should be incorporated for improving thermostability, as we demonstrate below.
The data set used here is an updated version of the one described in a previous study by Taylor et al.21 in that it does not have duplicate (hyper)thermophilic protomers. The protomers in this data set are characterized by a high crystallographic quality (crystallographic resolution ≤ 2.2 Å and R-factor ≤ 0.23) and a high sequence diversity (sequence identity < 30% between structures of two different pairs). Furthermore, structures of a pair in the data set (I) show root-mean-square deviations less than 4 Å, (II) lead to structural alignments that include greater than or equal to 80% of each structure, and (III) have identical or closely related EC numbers or functional annotations (see Tables S1 and S2, Supporting Information (SI), for PDB IDs and chain IDs of protomer pairs in the data set). Finally, the data set we used is highly diverse in that the structures come from a variety of structural classes and vary in size (67–732 residues) (Figure S1, SI).
Rather than analyzing thermostability in terms of structural or geometric properties, we focused on energetic factors with the aim to identify (the) most significant determinant(s) of protein thermostability. Initially, we calculated for all protomers in the data set several residue-wise components to the interaction energy, i.e., electrostatic, van der Waals (vdW), hydrophobic, and hydrogen bond parts (supplemental experimental procedures, SI). We chose these interaction energy components because these were identified as determinants for protein thermostability in previous studies using a small number of proteins.13,14,24,25 All energy terms except the hydrogen bond energy were calculated using the Prime module version 3.0 of the Schrödinger software (Schrödinger, LLC, New York, NY, 2011).26,27 The hydrogen bond energy (including charge-assisted hydrogen bonds) EHB was calculated using a geometry-based energy function developed for protein design28 as implemented in the FIRST software,29 and then energies of all hydrogen bonds of a residue were summed.
In order to identify (the) dominant determinant(s) of protein thermostability, we initially compared distributions of residue-wise energy components at a global level, i.e., between all mesophilic and (hyper)thermophilic protomers. For this, probability density functions (PDFs) of these distributions were obtained from kernel density estimation,30 which is a nonparametric way to estimate a PDF from a distribution based on a finite data sample. The PDFs of residue-wise electrostatic energies, vdW energies, hydrogen bond energies, and hydrophobic interaction energies differ between mesophilic and (hyper)thermophilic protomers with (hyper)thermophilic protomers showing higher probability densities at more negative (i.e., more favorable) energies (Figure 1); exceptions are the electrostatic (in the case of mesophilic/thermophilic pairs) and vdW energies (in the case of mesophilic/hyperthermophilic pairs) where the differences in the median energies of mesophilic and (hyper)thermophilic protomers (Δ̃E) are close to zero. A favorable difference in residue-wise electrostatic energies in the case of mesophilic/hyperthermophilic protomers but not in the case of mesophilic/thermophilic protomers is in line with results that ion pair interactions become preferentially stabilizing at higher temperatures because of a reduced desolvation penalty.31 The observed differences are statistically significant (p < 0.05 for the hypothesis of equality; Figure 1a–e, g, h) except for hydrogen bond energies in the case of mesophilic/hyperthermophilic protomers (Figure 1f). The statistical significance of the differences between two PDFs was calculated by a bootstrap hypothesis test of equality generating 10000 bootstrap samples. Here, during each bootstrap run, two new PDFs are generated by randomly choosing values from the combined set of values of the two data series. P-values are then calculated as the fraction of bootstrap samples that showed an equal or higher difference in the two new PDFs than the difference between the two original PDFs.
Figure 1.

PDFs obtained by kernel density estimation of residue-wise energy components: electrostatic energy (a and b), van der Waals energy (c and d), hydrogen bond energy (e and f), and hydrophobic interaction energy (g and h) for pairs of mesophilic/thermophilic (a, c, e, g), as well as mesophilic/hyperthermophilic (b, d, f, h) protomers. A normal kernel function with an optimal smoothing parameter45 at each data point was used for calculating the PDFs. The residue-wise energy values were trimmed to exclude values <1 percentile and >99 percentile. The statistical significance of the difference of two PDFs was calculated by a bootstrap hypothesis test of equality generating 10000 bootstrap samples as implemented in the “sm” package46 of the R program (http://www.r-project.org). Δ̃E indicates the difference between median residue-wise energies for (hyper)thermophilic and mesophilic protomers calculated from the kernel estimates.
According to the p-values, the most significant difference between PDFs of mesophilic/thermophilic (Figure 1g) and mesophilic/hyperthermophilic (Figure 1h) protomers is found in the case of residue-wise hydrophobic energies (p < 0.0001 for both cases). This is also reflected in the magnitudes of the respective Δ̃E values. On average, a residue in a thermophilic (hyperthermophilic) protomer has a hydrophobic energy that is more favorable by 0.82 (1.27) kcal mol–1 than that of a residue in a mesophilic protomer. The shoulder in the PDFs for hydrophobic interaction energies at around −24 kcal mol–1 is a result of the larger hydrophobic interaction energies of large hydrophobic and/or aromatic amino acids (Ile, Leu, Met, Phe, Trp, Tyr, and Val). These amino acids are not enriched in (hyper)thermophilic proteins (for our data set, we do not see a significant increase in the number of these amino acids in (hyper)thermophilic proteins compared to the mesophilic homologues; data not shown). Rather, the hydrophobic interaction energies of these residues are more favorable in the case of (hyper)thermophilic proteins. Overall, this demonstrates an energetically better hydrophobic packing in thermophilic proteins than in mesophilic proteins and an even better packing in hyperthermophilic proteins, which reflects that hydrophobic interactions become stronger with increasing temperature.32,33 Note that, in contrast to previous studies12,14,22,23 where the size of a cluster of hydrophobic residues was considered, our finding emphasizes the quality (energy) of residue-wise hydrophobic interactions as a discriminating factor.
Next, we investigated (differences in) the spatial distribution of residue-wise vdW, hydrogen bond, and hydrophobic interaction energies (i.e., where Δ̃E < 0 for both thermophilic and hyperthermophilic protomers compared to mesophilic protomers) in pairs of mesophilic/(hyper)thermophilic protomers. Following the idea of Protein Energy Networks introduced by Vijayabhaskar et al.,34 our hypothesis is that a larger cluster of residues with lower energies than a given cutoff EC exists in (hyper)thermophilic proteins than in their mesophilic homologues. However, in contrast to the study of Vijayabhaskar et al.,34 we analyze residue-wise energy components rather than the total inter-residue interaction energy. This will allow us to identify, coupled to spatial resolution, which energy components are most determining for protein thermostability. To test our hypothesis, we performed a hierarchical clustering of residues with respect to vdW, hydrogen bond, and hydrophobic interaction energy components, respectively, such that all neighboring residues with an energy component lower than EC for the respective clustering level are grouped in the same cluster (Figure 2). Thus, clusters grow in size as EC increases (i.e., the energy component becomes less favorable). For each EC, the fraction of residues that is part of the largest cluster (FLC) was calculated. With increasing EC, FLC increases from 0, when no residue is part of the largest cluster, to 1, when all residues belong to the largest cluster. If our hypothesis were true, the EC vs FLC curve of a (hyper)thermophilic protein should be shifted downward (toward lower EC values) from the one of a mesophilic homologue; this is shown in Figure 2 for the case of phosphotyrosyl phosphatase (PDB IDs: 1XWW and 2CWD) considering the hydrophobic interaction energy (see caption of Figure 2 for more details). When analyzed across our data set, this finding holds for 83% of the pairs of mesophilic/thermophilic protomers and 76% of the pairs of mesophilic/hyperthermophilic protomers (Figure 3). These discrimination accuracies are significantly (p < 0.001) different from the one of a random discrimination (50%). This demonstrates that for the majority of (hyper)thermophilic proteins it is the size of clusters of residues with good hydrophobic contacts that is the dominant factor responsible for a high thermostability. Still, for approximately 20% of the pairs, this factor does not lead to a successful discrimination. Identifying other mechanisms of thermostabilization is not unequivocal, however. If residue-wise vdW energies are used for the clustering, a correct discrimination was obtained for 52% of mesophilic/thermophilic and 78% of mesophilic/hyperthermophilic pairs; the corresponding discrimination accuracies were 53% and 63% in the case of the hydrogen bond energy (Figure 3). Thus, only in the case of vdW energies applied to pairs of mesophilic/hyperthermophilic protomers, a discrimination accuracy similar to the one obtained with hydrophobic interaction energies was found (see Tables S3 and S4, SI, for p-values related to the significance of differences between all discrimination accuracies including random discrimination). In contrast, residue-wise hydrogen bond and vdW energies do not allow discriminating between pairs of mesophilic/thermophilic protomers.
Figure 2.
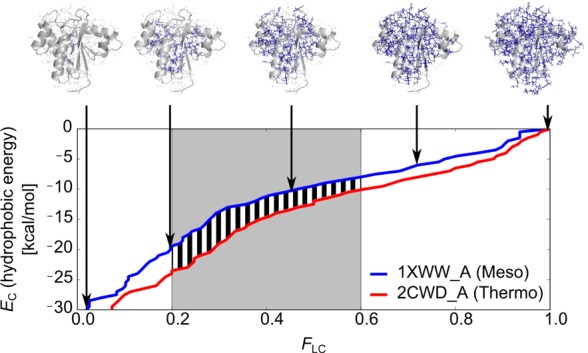
Discriminating mesophilic and (hyper)thermophilic proteins based on clusters of residues with good residue-wise energy components. Residues are clustered together if they are neighbors and if their values of the residue-wise energy components are below a cutoff EC (largest clusters for selected EC values are shown in the structures on the top as blue sticks). Residues are considered neighbors if the distance between the closest pair of atoms is less than or equal to 4 Å. EC is increased in a stepwise manner, and the clustering is repeated. As a result, a hierarchical clustering is obtained where clusters become larger as EC increases. For each EC value, the fraction of residues that is part of the largest cluster with respect to all protein residues (FLC) is calculated. As a descriptor for the discrimination, the area between the respective EC vs FLC curves for the (hyper)thermophilic and mesophilic proteins (black stripes) is then determined for the range of FLC ∈ [0.2, 0.6] (gray shading). If this value is negative, clusters of equal relative size have better residue-wise energy components in the case of the (hyper)thermophilic protein than in the case of the mesophilic protein. Preliminary tests showed that using other ranges of FLC values for determining the area between the EC vs FLC curves does not result in significantly different discrimination accuracies than the best discrimination accuracies obtained with FLC ∈ [0.2, 0.6].
Figure 3.

Discrimination accuracy between mesophilic and (hyper)thermophilic protomers based on clusters of residues with good residue-wise energy components. Lines connecting two bars indicate if the difference in discrimination accuracies for the two respective energy components is statistically significant. Marks at the bottom of a column indicate if the discrimination accuracy is significantly different from a random discrimination (50%). The statistical significance of the difference in discrimination accuracies is computed in both cases by a bootstrap hypothesis test of equality generating 10000 bootstrap samples. The significance levels are marked by ***: p < 0.001; **: p < 0.01; and ns: p > 0.05.
We repeated the hierarchical clustering based only on inter-residue spatial distances; now all residues of the type “hydrophobic” (Ala, Cys, Ile, Leu, Met, Phe, Trp, and Val) were clustered together that are within a distance cutoff for each clustering level. This resulted in discrimination accuracies of 53% (62%) for pairs of mesophilic/thermophilic (mesophilic/hyperthermophilic) protomers, with only the discrimination accuracy for the mesophilic/hyperthermophilic protomers being significantly different from the one of a random discrimination (p = 0.0369) (see Table S5, SI, for discrimination accuracies and their statistical significances). This result is remarkable in that it demonstrates that it is the quality (energy) of hydrophobic interactions that discriminates mesophilic from (hyper)thermophilic proteins rather than the sheer size of the largest cluster of hydrophobic residues. One of the reasons is that with the criterion of hydrophobic interaction energy, residues that would usually not be classified as hydrophobic can also be considered part of the largest cluster: We observe that the largest cluster at FLC = 0.5 also includes Arg (average fraction with respect to the number of residues in the cluster: 7.61%), Asn (0.54%), Asp (0.65%), Gln (2.06%), Glu (3.78%), His (2.09%), Pro (5.71%), Ser (1.63%), Thr (5.33%), and Tyr (6.31%) apart from residues of type “hydrophobic”.
We further evaluated whether the state of a protein structure influences the outcome of the discrimination between pairs of mesophilic/(hyper)thermophilic proteins. So far, we had analyzed single chains of a protein. Now, we investigated protein pairs in terms of the biological assemblies such that interactions at protein interfaces are also considered. For this, only those pairs were used where both biological assemblies had the same oligomeric state and no residues were missing in the structures. This resulted in 67 mesophilic/thermophilic pairs as well as 67 mesophilic/hyperthermophilic pairs of biological assemblies. When performing the hierarchical clustering of residues based on the residue-wise hydrophobic energies, the discrimination accuracies are 87% (78%) for pairs of mesophilic/thermophilic (mesophilic/hyperthermophilic) biological assemblies. These results are not significantly different from the ones found for protomers (p > 0.4 for a hypothesis of equality using 10000 bootstrap samples) (see Figure S2, SI, for the accuracy of discrimination between mesophilic and (hyper)thermophilic biological assemblies). This means that for most (hyper)thermophilic proteins better hydrophobic packing within a protomer (rather than across the interface of a biological assembly) is the dominant factor responsible for a high thermostability.
In order to evaluate the robustness of our method with respect to the data set composition, we divided the data set in groups of protomer pairs based on sequence- or structure-related properties (sequence length, sequence identity, resolution, oligomeric state, presence of structural ions, SCOP class, and CATH class); then, we reanalyzed the results obtained from hierarchical clustering of residues based on the residue-wise hydrophobic interaction energies. We did not observe a pronounced influence of any of the properties on the discrimination accuracy except for the sequence length (Figure S1, SI). Longer protein chains result in higher discrimination accuracy. Likely, this is because larger proteins have larger hydrophobic clusters in which more residues with good hydrophobic interactions can be found in the case of (hyper)thermophilic proteins compared to mesophilic proteins. Overall, these results demonstrate that discriminating mesophilic and (hyper)thermophilic proteins based on clusters of residues with good hydrophobic interactions is highly robust with respect to the properties of the protein pairs considered.
Finally, we turned to investigating whether our finding that a larger cluster of residues with good hydrophobic interaction energies results in a more thermostable protein can be exploited prospectively for data-driven protein engineering by predicting structural weak spots, i.e., residues that when mutated would improve protein thermostability. As in a real-life scenario, we only used the structural information of the mesophilic protein for this. To predict such residues, EC was set such that half of the protein’s residues belong to the largest cluster (i.e., FLC = 0.5). We chose FLC = 0.5 because we visually observed that the cluster at this point represents the “hydrophobic core”, and residues forming this should not be mutated. Residues in the immediate neighborhood of this cluster have a high (unfavorable) hydrophobic interaction energy, and mutating them should likely lead to a larger cluster of residues with good hydrophobic interaction energies. Hence, we consider these spatially close residues weak spot candidates. In order to prune the number of candidates, we ranked them by their hydrophobic interaction energies such that the weakest spot (highest energy) has the highest rank. After ranking, the top 25% with respect to the total number of residues of the protein are finally considered weak spots. In doing so, we use the ranking to enrich sites where a mutation should more likely improve thermostability. In addition to the site of mutagenesis, the actual outcome of a mutation on a protein’s thermostability also depends on the types of residues exchanged. Thus, one cannot expect the weak spot rank alone to quantitatively correlate with the effect of a mutation on thermostability.
We evaluated this weak spot prediction first using Escherichia coli dihydrofolate reductase (DHFR) from our data set as an example. Several mutants of E. coli DHFR have been experimentally evaluated for their thermostability; the Protherm database (http://www.abren.net/protherm/)35 lists eight (14) residues that stabilize (destabilize) the protein upon single-point mutation(s) (Table 1; see Table S6, SI, for individual mutants and their difference in thermostability from the wild-type). Three out of the eight thermostabilizing residues were correctly predicted as weak spots by our approach (Table 1; Figure 4). In turn, 12 out of the 14 destabilizing residues were correctly predicted as nonweak spots (Table 1; Figure 4). This yields a classification accuracy of almost 70%, with our approach being more accurate in identifying nonweak spots (specificity: 85%) than weak spots (sensitivity: 38%). Of the five weak spots missed, two (D27N, L28R) resulted in a more thermostable protein upon mutation to equally polar or even more polar residues. Thus, expecting to identify these residues as weak spots appears to be beyond the scope of our approach. In fact, these residues were assigned low weak spot ranks (87, 71), indicating that improving hydrophobic interactions at these spots might not lead to a more thermostable protein. Regarding two further weak spots missed (W22L, L54V), mutations to smaller hydrophobic residues there led to a more thermostable protein. Because our method is particularly suited for identifying weak spots that when mutated to residues with improved hydrophobic interactions should lead to improved thermostability, missing these two weak spots thus is not unexpected either. E. coli DHFR in our data set is a rare example for which comprehensive sets of single mutants leading to stabilization or destabilization have been recorded in the Protherm database. For further validation of our weak spot prediction, we thus resorted to two systems for which only stabilizing or only destabilizing mutants have been reported. For Bacillus subtilis adenylate kinase, two thermostabilizing multiple mutants have been reported in the Protherm database, incorporating in total 26 mutations. We correctly predicted nine out of 19 mutations (excluding mutations involving the exchange of one hydrophobic residue with another) as weak spots (sensitivity: 47%; see Table S7, SI, for details). As a counter example, we considered the E. coli maltose binding protein (MBP) for which all but one (Gly to Cys mutation at position 19) of the 16 destabilizing single-point mutations reported in the Protherm database were correctly predicted as nonweak spots (specificity: 93.75%; see Table S7, SI, for details). Note that this result is not trivial as one might be tempted to think considering that all but one (Tyr to Asp mutation at position 283) of the correct predictions involve mutations of larger hydrophobic residues to smaller ones. Rather, even without considering the actual outcome of a mutation on a protein’s thermostability, our method suggests that for improving thermostability these nonweak spot residues should not be mutated because they are already part of the “hydrophobic core” with good hydrophobic interaction energies. Finally, considering the results for all three systems shows that our method is more accurate in identifying nonweak spots than weak spots. In our view, these results are encouraging given, first, the fact that we could reliably exclude the majority of nonweak spots and, second, the ease of computation with which this classification is obtained. The former would already result in a much reduced experimental effort when performing site saturation mutagenesis for identifying thermostable mutants; the latter suggests that our approach can be used as a prefilter for further rational design approaches where more rigorous (and costly) prediction methods are applied. In particular, as our approach focuses on identifying weak spots where improving hydrophobic interactions should lead to improved thermostability, we recommend combining it with other approaches for weak spot prediction that focus on different mechanisms of thermostabilization.
Table 1. Experimental Validation of Predicted Weak Spots on E. coli DHFR.
| residuea | mutation(s) | weak spot rankb | referencec |
|---|---|---|---|
| Stabilizing mutations | |||
| G15 | A | 35 | (36) |
| W22 | L | –d | (36) |
| D27 | N | 87 | (37) |
| L28 | R | 71 | (37) |
| L54 | V | –d | (36) |
| P66 | A | 15 | (38) |
| V88 | I, A | –d | (39) |
| G95 | A | 32 | (40) |
| Destabilizing mutations | |||
| P21 | L | –d | (36) |
| L24 | V | –d | (36) |
| W30 | M, Y, A, R, N, S, H, E | –d | (41) |
| F31 | V, A | –d | (36,37) |
| T35 | A | –d | (36) |
| P39 | C | –d | (42) |
| V40 | I, L, A, R, M, F, N, S, H | –d | (41) |
| G43 | A | 34 | (36) |
| W74 | F | –d | (43) |
| T113 | V | –d | (37) |
| D122 | A | 29 | (36) |
| E139 | K, Q | 64 | (44) |
| S148 | A, E, K, N, P, R, T, V | –d | (41) |
| I155 | A, L, A, D, E, K, L, Q, R, S, T, V, W, Y | –d | (36,41) |
Residue IDs in bold indicate a true positive or a true negative weak spot prediction.
Weak spot rank based on the hydrophobic interaction energies; high ranks (low numbers) indicate weaker spots in comparison to residues with a low ranks.
Studies reporting thermostability evaluations of mutants.
Residue is not identified as a weak spot at any rank.
Figure 4.
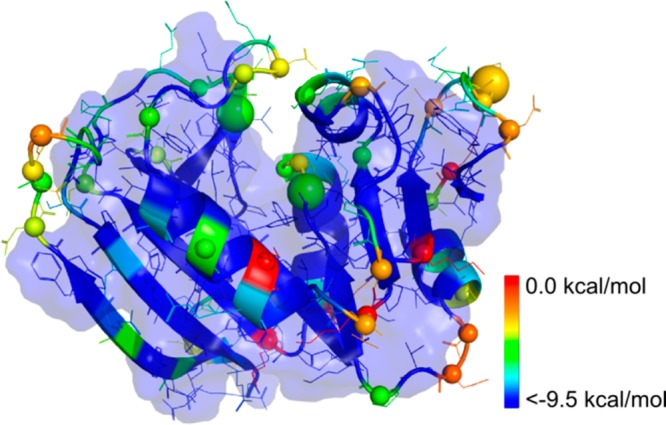
Predicted weak spots mapped onto the structure of E. coli DHFR. Residues are colored by a rainbow color ramp according to their hydrophobic interaction energies. The largest cluster with FLC = 0.5 observed at a cutoff of the hydrophobic interaction energy EC = −9.5 kcal mol–1 is enclosed by a transparent surface. Cα atoms of weak spot residues are represented as spheres. Weak spots that have been validated in the literature are marked by a large sphere.
In summary, in the present study, we aimed at identifying dominant determinant(s) of protein thermostability. On the basis of one of the largest data sets investigated in this context and thorough statistical evaluation, our results substantiate the importance of the quality (energy) of hydrophobic interactions for protein thermostability. Considering residue-wise hydrophobic interaction energies at a global level, an energetically better hydrophobic packing in thermophilic proteins than in mesophilic proteins is detected, and an even better packing in hyperthermophilic proteins. Accordingly, by identifying clusters of residues with good hydrophobic interaction energies alone, we were able to successfully discriminate between pairs of mesophilic/(hyper)thermophilic proteins with an accuracy of ∼80%. These results are robust with respect to the properties of protein pairs considered. Considering the size of clusters of hydrophobic residues instead resulted in at most a weak discriminatory power. Finally, we successfully applied the criterion of clusters of residues with good hydrophobic interaction energies to search for structural weak spots, which will allow guiding data-driven protein engineering. These results and the computational efficiency position our approach as a valuable complement to existing approaches for analyzing proteins with respect to thermostability and identifying structural weak spots.
Acknowledgments
We thank Taylor Todd, National Cancer Institute, Bethesda, MD, for providing the dataset of mesophilic/(hyper)thermophilic protomer pairs. We are grateful to the Ministry of Innovation, Science, and Research of North Rhine-Westphalia and Heinrich Heine University, Düsseldorf, for a scholarship to P.C.R. within the CLIB-Graduate Cluster Industrial Biotechnology and BASF SE for giving P.C.R. the opportunity to work as an intern.
Supporting Information Available
Detailed protocols of experimental procedures, additional tables showing data set composition (Tables S1–S2), p-values regarding equality in discrimination accuracies (Tables S3–S4), discrimination between mesophilic and (hyper)thermophilic protomers when clustering residues of type “hydrophobic” by inter-residue spatial distances (Table S5), thermostability of E. coli DHFR mutants (Table S6), and further validation of the weak spot prediction (Table S7), as well as additional figures showing the discrimination accuracy between mesophilic and (hyper)thermophilic protomers (Figure S1) and biological assemblies (Figure S2). This material is available free of charge via the Internet at http://pubs.acs.org.
The authors declare the following competing financial interest(s): Dr. Wolfgang Hoeffken is an employee of BASF SE.
Funding Statement
National Institutes of Health, United States
Supplementary Material
References
- Demirjian D. C.; Moris-Varas F.; Cassidy C. S. Enzymes from extremophiles. Curr. Opin. Chem. Biol. 2001, 5, 144–151. [DOI] [PubMed] [Google Scholar]
- Van den Burg B. Extremophiles as a source for novel enzymes. Curr. Opin. Microbiol. 2003, 6, 213–218. [DOI] [PubMed] [Google Scholar]
- Vieille C.; Zeikus G. J. Hyperthermophilic enzymes: Sources, uses, and molecular mechanisms for thermostability. Microbiol. Mol. Biol. Rev. 2001, 65, 1–43. [DOI] [PMC free article] [PubMed] [Google Scholar]
- Egorova K.; Antranikian G. Industrial relevance of thermophilic Archaea. Curr. Opin. Microbiol. 2005, 8, 649–655. [DOI] [PubMed] [Google Scholar]
- Niehaus F.; Bertoldo C.; Kahler M.; Antranikian G. Extremophiles as a source of novel enzymes for industrial application. Appl. Microbiol. Biotechnol. 1999, 51, 711–729. [DOI] [PubMed] [Google Scholar]
- Lorenz P.; Schleper C. Metagenome—A challenging source of enzyme discovery. J. Mol. Catal. B: Enzymatic 2002, 19, 13–19. [Google Scholar]
- Leisola M.; Turunen O. Protein engineering: Opportunities and challenges. Appl. Microbiol. Biotechnol. 2007, 75, 1225–1232. [DOI] [PubMed] [Google Scholar]
- Eijsink V. G. H.; Gaseidnes S.; Borchert T. V.; van den Burg B. Directed evolution of enzyme stability. Biomol. Eng. 2005, 22, 21–30. [DOI] [PubMed] [Google Scholar]
- Eijsink V. G. H.; Bjørk A.; Gåseidnes S.; Sirevåg R.; Synstad B.; van den Burg B.; Vriend G. Rational engineering of enzyme stability. J. Biotechnol. 2004, 113, 105–120. [DOI] [PubMed] [Google Scholar]
- Chaparro Riggers J. F.; Polizzi K. M.; Bommarius A. S. Better library design: Data driven protein engineering. Biotechnol. J. 2007, 2, 180–191. [DOI] [PubMed] [Google Scholar]
- Razvi A.; Scholtz J. M. Lessons in stability from thermophilic proteins. Protein Sci. 2006, 15, 1569–1578. [DOI] [PMC free article] [PubMed] [Google Scholar]
- Kumar S.; Tsai C. J.; Nussinov R. Factors enhancing protein thermostability. Protein Eng. 2000, 13, 179–191. [DOI] [PubMed] [Google Scholar]
- Vogt G.; Woell S.; Argos P. Protein thermal stability, hydrogen bonds, and ion pairs. J. Mol. Biol. 1997, 269, 631–643. [DOI] [PubMed] [Google Scholar]
- Gromiha M. M.; Pathak M. C.; Saraboji K.; Ortlund E. A.; Gaucher E. A. Hydrophobic environment is a key factor for the stability of thermophilic proteins. Proteins: Struct., Funct., Bioinf. 2013, 81, 715–721. [DOI] [PubMed] [Google Scholar]
- Russell R. J.; Hough D. W.; Danson M. J.; Taylor G. L. The crystal structure of citrate synthase from the thermophilic archaeon, Thermoplasma acidophilum. Structure 1994, 2, 1157–1167. [DOI] [PubMed] [Google Scholar]
- Querol E.; PerezPons J. A.; MozoVillarias A. Analysis of protein conformational characteristics related to thermostability. Protein Eng. 1996, 9, 265–271. [DOI] [PubMed] [Google Scholar]
- Vihinen M. Relationship of protein flexibility to thermostability. Protein Eng. 1987, 1, 477–480. [DOI] [PubMed] [Google Scholar]
- Rathi P. C.; Radestock S.; Gohlke H. Thermostabilizing mutations preferentially occur at structural weak spots with a high mutation ratio. J. Biotechnol. 2012, 159, 135–144. [DOI] [PubMed] [Google Scholar]
- Radestock S.; Gohlke H. Protein rigidity and thermophilic adaptation. Proteins: Struct., Funct., Bioinf. 2011, 79, 1089–1108. [DOI] [PubMed] [Google Scholar]
- Radestock S.; Gohlke H. Exploiting the link between protein rigidity and thermostability for data-driven protein engineering. Eng. Life Sci. 2008, 8, 507–522. [Google Scholar]
- Taylor T. J.; Vaisman I. I. Discrimination of thermophilic and mesophilic proteins. BMC Struct. Biol. 2010, 10Suppl 1S5. [DOI] [PMC free article] [PubMed] [Google Scholar]
- Kannan N.; Vishveshwara S. Aromatic clusters: A determinant of thermal stability of thermophilic proteins. Protein Eng. 2000, 13, 753–761. [DOI] [PubMed] [Google Scholar]
- Kim T.; Joo J. C.; Yoo Y. J. Hydrophobic interaction network analysis for thermostabilization of a mesophilic xylanase. J. Biotechnol. 2012, 161, 49–59. [DOI] [PubMed] [Google Scholar]
- Dominy B. N.; Minoux H.; Brooks C. L. III. An electrostatic basis for the stability of thermophilic proteins. Proteins: Struct., Funct., Bioinf. 2004, 57, 128–141. [DOI] [PubMed] [Google Scholar]
- Glyakina A. V.; Garbuzynskiy S. O.; Lobanov M. Y.; Galzitskaya O. V. Different packing of external residues can explain differences in the thermostability of proteins from thermophilic and mesophilic organisms. Bioinformatics 2007, 23, 2231–2238. [DOI] [PubMed] [Google Scholar]
- Jacobson M. P.; Pincus D. L.; Rapp C. S.; Day T. J.; Honig B.; Shaw D. E.; Friesner R. A. A hierarchical approach to all-atom protein loop prediction. Proteins: Struct., Funct., Bioinf. 2004, 55, 351–367. [DOI] [PubMed] [Google Scholar]
- Jacobson M. P.; Friesner R. A.; Xiang Z.; Honig B. On the role of the crystal environment in determining protein side-chain conformations. J. Mol. Biol. 2002, 320, 597–608. [DOI] [PubMed] [Google Scholar]
- Dahiyat B. I.; Gordon D. B.; Mayo S. L. Automated design of the surface positions of protein helices. Protein Sci. 1997, 6, 1333–1337. [DOI] [PMC free article] [PubMed] [Google Scholar]
- FIRST, a program for analysing flexibility of networks. http://flexweb.asu.edu/ (accessed January 17, 2014).
- Nadaraya É. A. On non-parametric estimates of density functions and regression curves. Theory Probab. Appl. 1965, 10, 186–190. [Google Scholar]
- Elcock A. H. The stability of salt bridges at high temperatures: implications for hyperthermophilic proteins. J. Mol. Biol. 1998, 284, 489–502. [DOI] [PubMed] [Google Scholar]
- Privalov P. L.; Gill S. J. Stability of protein structure and hydrophobic interaction. Adv. Protein Chem. 1988, 39, 191–234. [DOI] [PubMed] [Google Scholar]
- Schellman J. A. Temperature, stability, and the hydrophobic interaction. Biophys. J. 1997, 73, 2960–2964. [DOI] [PMC free article] [PubMed] [Google Scholar]
- Vijayabaskar M. S.; Vishveshwara S. Comparative analysis of thermophilic and mesophilic proteins using Protein Energy Networks. BMC Bioinf. 2010, 11Suppl 1S49. [DOI] [PMC free article] [PubMed] [Google Scholar]
- Kumar M. D.; Bava K. A.; Gromiha M. M.; Prabakaran P.; Kitajima K.; Uedaira H.; Sarai A. ProTherm and ProNIT: Thermodynamic databases for proteins and protein–nucleic acid interactions. Nucleic Acids Res. 2006, 34, D204–D206. [DOI] [PMC free article] [PubMed] [Google Scholar]
- Arai M.; Maki K.; Takahashi H.; Iwakura M. Testing the relationship between foldability and the early folding events of dihydrofolate reductase from Escherichia coli. J. Mol. Biol. 2003, 328, 273–288. [DOI] [PubMed] [Google Scholar]
- Perry K. M.; Onuffer J. J.; Touchette N. A.; Herndon C. S.; Gittelman M. S.; Matthews C. R.; Chen J. T.; Mayer R. J.; Taira K.; Benkovic S. J.; Howell E. E.; Kraut J. Effect of single amino acid replacements on the folding and stability of dihydrofolate reductase from Escherichia coli. Biochemistry 1987, 26, 2674–2682. [DOI] [PubMed] [Google Scholar]
- Texter F. L.; Spencer D. B.; Rosenstein R.; Matthews C. R. Intramolecular catalysis of a proline isomerization reaction in the folding of dihydrofolate reductase. Biochemistry 1992, 31, 5687–5691. [DOI] [PubMed] [Google Scholar]
- Ahrweiler P. M.; Frieden C. Effects of point mutations in a hinge region on the stability, folding, and enzymatic activity of Escherichia coli dihydrofolate reductase. Biochemistry 1991, 30, 7801–7809. [DOI] [PubMed] [Google Scholar]
- Svensson A. K.; O’Neill J. C. Jr.; Matthews C. R. The coordination of the isomerization of a conserved non-prolyl cis peptide bond with the rate-limiting steps in the folding of dihydrofolate reductase. J. Mol. Biol. 2003, 326, 569–583. [DOI] [PubMed] [Google Scholar]
- Arai M.; Iwakura M. Probing the interactions between the folding elements early in the folding of Escherichia coli dihydrofolate reductase by systematic sequence perturbation analysis. J. Mol. Biol. 2005, 347, 337–353. [DOI] [PubMed] [Google Scholar]
- Villafranca J. E.; Howell E. E.; Oatley S. J.; Xuong N. H.; Kraut J. An engineered disulfide bond in dihydrofolate reductase. Biochemistry 1987, 26, 2182–2189. [DOI] [PubMed] [Google Scholar]
- Garvey E. P.; Swank J.; Matthews C. R. A hydrophobic cluster forms early in the folding of dihydrofolate reductase. Proteins 1989, 6, 259–266. [DOI] [PubMed] [Google Scholar]
- Perry K. M.; Onuffer J. J.; Gittelman M. S.; Barmat L.; Matthews C. R. Long-range electrostatic interactions can influence the folding, stability, and cooperativity of dihydrofolate reductase. Biochemistry 1989, 28, 7961–7968. [DOI] [PubMed] [Google Scholar]
- Silverman B. W.Density Estimation for Statistics and Data Analysis; Chapman & Hall/CRC: London, 1998. [Google Scholar]
- Bowman A. W.; Azzalini A.. Applied Smoothing Techniques for Data Analysis: The Kernel Approach with S-Plus Illustrations; Oxford University Press: Oxford, 1997. [Google Scholar]
Associated Data
This section collects any data citations, data availability statements, or supplementary materials included in this article.