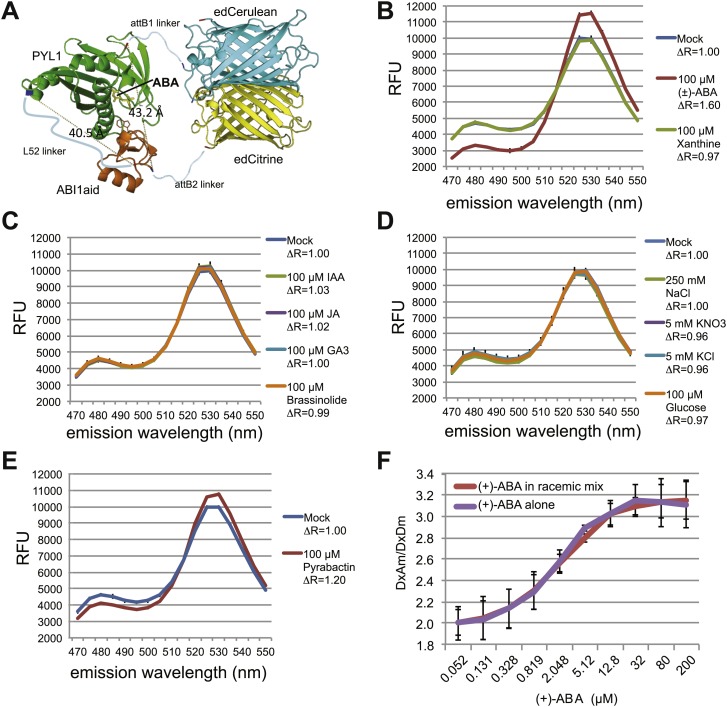
Figure 3. ABACUS1 design and fluorescence response to ABA and related compounds.
(A) Hypothetical model of ABACUS1 bound to ABA. The structure shown for dPAS110 is derived from a crystal structure of ABA bound to PYL1 and ABI1 (PDB: 3JRQ) (Miyazono et al., 2009), and the structure shown for FRET donor enhanced dimer Cerulean (edCerulean) and FRET acceptor enhanced dimer Citrine (edCitrine) are derived from a crystal structure of Aequorea victoria GFP (PDB:1EMA) (Ormö et al., 1996). The structures are visualized using MacPyMol cartoon representation except for the ABA interacting tryptophan 300 of ABI1, which is shown in line representation and (+)–abscisic acid (yellow, ABA), which is shown in stick representation. The N-termini are colored blue and C-termini are colored red. The linkers are represented as hypothetical cartoon models not derived from known structures. The expected distance between the C-terminus of ABI1aid and the N-terminus of PYL1 (linked by L52 in ABACUS1) and the C-terminus of PYL1 and the N-terminus of ABI1aid (linked to fluorescent proteins), is shown in angstroms. The overall domain order of ABACUS1 is N-terminus–edCitrine–attB1–ABI1aid–L52–PYL1–attB2–edCerulean–C-terminus. ABACUS1-2µ fluorescence emission at shown wavelengths in response to (±)-ABA or xanthine (B), other phytohormones (C), glucose and various salts (D), pyrabactin (E). Excitation wavelength = 428 nm. Delta ratio (ΔR) = treatment DxAm/DxDm/mock DxAm/DxDm. (F) Titration curve for ABACUS1-2µ in response to equivalent concentrations of (+)-ABA supplied alone or as part of a racemic mixture with (−)-ABA.

