

Abstract
Purpose
To predict survival in patients with metastatic melanoma by evaluating a combination of serum lactate dehydrogenase (LDH) level and initial computed tomographic (CT) findings of tumor devascularization after antiangiogenic therapy.
Materials and Methods
Consent was waived for this institutional review board–approved, retrospective, secondary analysis. Forty-four patients with metastatic melanoma received bevacizumab therapy in a randomized prospective phase II trial. Target lesions on the initial posttherapy CT images were evaluated by using Response Evaluation Criteria in Solid Tumors, the Choi criteria, and Morphology, Attenuation, Size, and Structure (MASS) criteria. Cox proportional hazards models were used to assess the association of baseline clinical variables including serum LDH and imaging findings with progression-free and overall survival. The receiver operating characteristic curve with area under the curve (AUC) was used to evaluate accuracy.
Results
In multivariate analysis, a high baseline serum LDH level was associated with decreased progression-free survival (hazard ratio = 1.29 for each increase of 100 IU/L; P = .002) and overall survival (hazard ratio = 1.44 for each increase of 100 IU/L; P = .001). Evaluation with MASS criteria of the first CT examination after therapy strongly predicted progression-free (P < .001) and overall (P < .001) survival. Baseline serum LDH level was moderately accurate for predicting progression-free survival at 9 months (AUC = 0.793) and overall survival at 18 months (AUC = 0.689). The combination of baseline serum LDH levels and evaluation with MASS criteria at the first CT examination after therapy had significantly higher accuracy for predicting progression-free survival at 9 months (AUC = 0.969) and overall survival at 18 months (AUC = 0.813) than did baseline serum LDH levels alone for prediction of progression-free survival (P = .020).
Conclusion
A combination of baseline serum LDH levels and evaluation with MASS criteria at the first CT examination after bevacizumab therapy had the highest accuracy for predicting survival in patients with metastatic melanoma.
Overall survival among patients with metastatic melanoma is poor, although there is substantial variability in survival that is not well understood (1). High genetic and phenotypic variability of metastatic melanoma contribute to differential tumor response to therapy and overall survival. In addition to patient performance status and sites of metastatic disease, few clinical factors or biomarkers have been associated with survival in patients with metastatic melanoma (2).
Baseline serum lactate dehydrogenase (LDH) level is an important predictor of survival in patients with metastatic melanoma, although the accuracy of this predictor is insufficient to alter clinical therapy treatment plans (2,3). Additional predictive biomarkers that are applicable to new advances in treatment for metastatic melanoma are needed.
Melanoma metastases are highly vascular, and recent clinical trials (4–7) have shown that targeted antiangiogenic agents improve both progression-free and overall survival compared with traditional therapies. Bevacizumab combined with high-dose interferon α2b has been shown to decrease tumor size in a substantial proportion of patients with metastatic melanoma (5).
In patients with melanoma, computed tomography (CT) is commonly used to help in staging disease and monitoring objective response to therapy by allowing evaluation of tumor size changes per Response Evaluation Criteria in Solid Tumors (RECIST) (8). However, targeted antiangiogenic agents often lead to relative stabilization of tumor size, and strict evaluation of this parameter may not lead to detection of a favorable response (9–14).
In other highly vascular metastatic tumors, new imaging criteria for the first CT study after angiogenic therapy have been developed to allow accurate prediction of patient survival (9–11). For metastatic gastrointestinal stromal tumor response evaluation, the Choi criteria were developed, which include evaluation of tumor size and x-ray attenuation changes on contrast material–enhanced CT images (10–12). For metastatic renal cell carcinoma, Morphology, Attenuation, Size, and Structure (MASS) criteria were developed and include evaluation of tumor size, x-ray attenuation, and necrosis (9,14).
We hypothesized that tumor imaging changes associated with devascularization (ie, decreased size, decreased attenuation, and development of marked central necrosis) on the first contrast-enhanced CT images after initiation of antiangiogenic therapy for metastatic melanoma can be associated with progression-free and overall survival and can serve as a widely available predictive biomarker. The objective of this study was to use a combination of a serum biomarker (LDH) level and CT findings of tumor devascularization after antiangiogenic therapy to predict survival accurately in patients with metastatic melanoma.
Materials and Methods
Patient Population
The requirement for informed consent was waived for this institutional review board–approved, Health Insurance Portability and Accountability Act–compliant retrospective secondary analysis. Patients with metastatic melanoma who were treated with bevacizumab with or without interferon α2b were included as part of a randomized phase II prospective clinical trial. The trial was initiated at the Ohio State University Comprehensive Cancer Center in December 2001 and extended through April 2012 (5,7). The first two treatment arms of the randomized phase II trial consisted of patients who received bevacizumab with or without very low-dose interferon α2b (1 MU/m2). A third treatment arm was added to the trial in which bevacizumab was administered in conjunction with high-dose interferon α2b (10 MU/m2). Patients included (n = 62) in the trial were those who had histologically confirmed malignant melanoma; were aged 18 years or older; had a life expectancy of 6 months or more, an Eastern Cooperative Oncology Group status less than or equal to 1, normal organ function, pretherapy CT imaging less than or equal to 90 days before the start of therapy, and initial posttherapy CT imaging 21–120 days after the start of therapy. The specific aim of the clinical trial was to evaluate progression-free survival and the objective response rate to bevacizumab when it is used in combination with interferon α2b for treatment of metastatic melanoma (5,7). Patients for whom baseline and initial posttherapy CT imaging (n = 13) were unavailable and those who had insufficient clinical and laboratory data (n = 3) or had undergone pretherapy CT imaging more than 90 days from the start of therapy (n = 2) were excluded. A total of 44 patients were included in our secondary analysis study.
Clinical and Imaging Data Transfer
Baseline clinical factors and baseline and initial posttherapy CT images were deidentified and securely transferred by using coded identifiers to the University of Mississippi Medical Center Department of Radiology for analysis. Clinical data evaluated included the following patient characteristics: age, sex, body mass index, Eastern Cooperative Oncology Group performance status, time from diagnosis to start of therapy, type of melanoma, specific therapeutic regimen, duration of progression-free and overall survival, reason for termination of therapy, time from baseline and initial posttherapy CT imaging to start of therapy, and baseline laboratory measures including serum LDH, hemoglobin, platelets, corrected calcium, absolute neutrophils, and serum alkaline phosphatase levels. All patients were followed for 2 years after completion of treatment in this study. Progression-free survival was defined as the time from start of therapy until progression of disease per RECIST or death. Patients who did not progress or die were censored during the last available assessment. Overall survival was defined as the time from start of therapy until death from any cause or censored at the date the patient was last known to be alive.
CT Imaging
CT imaging of the chest, abdomen, and pelvis was conducted at baseline and repeated in 3-month intervals (six cycles of therapy) per protocol by using routine CT imaging techniques with multidetector–row helical acquisitions. The section thickness for contrast-enhanced CT examinations ranged from 2.5 to 8 mm. Among the pretherapy CT studies, 84% (37 of 44) were performed with a section thickness of 5 mm, and among the initial posttherapy CT studies, 95% (42 of 44) were performed with a section thickness of 5 mm. Only 5% (two of 44) of patients underwent unenhanced CT imaging, while the remaining 95% (42 of 44) of patients underwent CT imaging with intravenous contrast material. The Digital Imaging and Communication in Medicine CT images were uploaded to the Philips iSite picture archiving and communication system (Philips, Best, the Netherlands). A radiologist (A.S., with 8 years of oncologic imaging experience) made all imaging measurements with a Hewlett Packard Z800 computer workstation (Hewlett Packard, Palo Alto, Calif) and the Philips iSite picture archiving and communication system. Per RECIST 1.1 guidelines for selection of target lesions, we selected up to five target lesions on the basis of their size on the baseline CT images, with a maximum of two lesions per organ (8). Tumor size was assessed as the sum of the diameters of all target lesions for each CT imaging time point (longest dimension for nonnodal lesions and short axis for nodal lesions), and absolute change and percentage of change in tumor size between the baseline and initial post-therapy CT studies were calculated.
The mean CT attenuation was measured in Hounsfield units on the same axial CT image used to make the maximal size measurement by placing a region of interest around the peripheral margin of each target lesion. CT attenuation of lung target lesions measuring larger than 1 cm on the short axis were measured by drawing a free-form region of interest 2 mm or larger in the periphery of the lesion, while avoiding volume averaging with adjacent aerated lung. CT attenuation of smaller target lung lesions was not measured to avoid volume averaging with the adjacent aerated lung. The mean tumor attenuation of all target lesions was calculated for each CT imaging time point per Choi criteria, and absolute change and percentage of change in attenuation between the baseline and initial posttherapy CT studies were calculated (11,12).
The following imaging data were gathered: presence or absence of intravenous contrast material, location of metastatic sites, number and location of target lesions, target lesion size and attenuation measurements, presence or absence of new metastases, presence or absence of marked central necrosis or marked decreased attenuation in one or more metastases per MASS criteria, absolute and percentage of difference in size, and mean attenuation of target lesions (9,14). These data were sufficient to determine objective response on the initial posttherapy CT study per RE-CIST, Choi criteria, and MASS criteria (Table E1 [online]) (9–16).
The objective response for each set of imaging criteria was made at the time of imaging analysis (A.S., blinded to clinical and survival data). The objective response categories used for RECIST and Choi criteria were partial response, stable disease, and progressive disease (9–16). No patients met criteria for complete response on the basis of any imaging criteria. MASS criteria objective response categories included favorable response, indeterminate response, and unfavorable response (9,14).
Statistical Analysis
Probabilities of overall and progression-free survival were calculated by using the Kaplan-Meier method. Comparison of overall and progression-free survival between independent groups was performed by using the log-rank test. Bonferroni adjusted P values were reported in the context of pairwise comparisons of overall and progression-free survival. Effects of demographic variables, clinical variables, and imaging criteria were assessed by using Cox proportional hazards models. The variables considered in multivariate analysis included sex, age, body mass index, Eastern Cooperative Oncology Group performance status, time from diagnosis to start of therapy, number and location of metastatic sites, and baseline laboratory values including serum LDH, hemoglobin, platelets, absolute neutrophils, corrected calcium, serum alkaline phosphatase, dose of interferon, and objective response per each set of imaging criteria. A backward stepwise selection procedure was performed for both overall and progression-free survival, and P values less than .05 were considered to indicate a significant difference. The stable disease group for RECIST and Choi criteria and the indeterminate response group for MASS criteria were used as the referent groups for Cox proportional hazards model analysis.
In addition to imaging criteria, baseline serum LDH was determined to be the only variable that was significantly associated with overall and progression-free survival. To determine the functional form of baseline serum LDH, the martingale residuals were obtained from the Cox model with each imaging criteria set. The plot of the martingale residual versus baseline serum LDH provided evidence to include the linear form of baseline serum LDH as a regressor of the Cox model. The proportional hazards assumption was tested by creating time-dependent variables and temporarily including them in the Cox model. This assumption held true for imaging criteria and baseline serum LDH because the time-dependent variables were not significantly associated with overall and progression-free survival.
The receiver operating characteristics curve with area under the curve (AUC) was used to evaluate predictive accuracy of the Cox models containing baseline serum LDH and various imaging criteria (16). Emphasis was placed on assessing the potential additional predictive accuracy by adding the imaging criteria to a model containing baseline serum LDH as the only predictor. Predictive accuracy of the final Cox models was evaluated for progression-free survival at 9 months and overall survival at 18 months.
The risk scores were computed for each patient on the basis of the actual imaging category and baseline serum LDH value and the estimated effects of these factors. The receiver operating characteristics curves were constructed with consideration of all possible cutoff values for calculated risk scores and actual disease progression status at 9 months or vital status at 18 months. AUC was computed to evaluate the predictive accuracy of the models. The bootstrap method was used for the inference of AUC (17). On the basis of 5000 bootstrap samples, we obtained the 95% confidence interval (CI) for AUCs. The Bonferroni method was used to adjust P values and obtain simultaneous CIs for pairwise comparisons of AUCs.
Results
General patient and imaging characteristics are presented in Table 1. The primary tumor site was the skin in 80% (35 of 44) of patients. The baseline CT scan was obtained within 30 days before the start of therapy in 91% (40 of 44) of patients (median, 17 days; range, 1–62 days), and 93% (41 of 44) of patients underwent initial posttherapy CT imaging within 90 days of the start of therapy (median, 77 days; range, 23–105 days).
Table 1.
Patient and Imaging Characteristics
| Characteristic | Value |
|---|---|
| Sex | |
| Men | 26 (59) |
| Women | 18 (41) |
| Age, all patients (y)* | 58 (28–80) |
| Age, men | 60 (34–80) |
| Age, women | 55 (28–72) |
| Body mass index* | 27.5 (17.5–39.1) |
| ECOG status | |
| 0 | 35 (80) |
| 1 | 9 (20) |
| Time from diagnosis to therapy (y) | |
| < 1 | 8 (18) |
| 1 to < 2 | 7 (16) |
| ≥ 2 | 29 (66) |
| No. of metastatic sites | |
| 1 | 15 (34) |
| 2 | 15 (34) |
| 3 | 7 (16) |
| ≥ 4 | 7 (16) |
| Sites of metastasis | |
| Lymph nodes | 28 (64) |
| Lungs | 28 (64) |
| Liver | 13 (30) |
| Subcutaneous tissues | 7 (16) |
| Pleura | 6 (14) |
| Spleen | 5 (11) |
| Retroperitoneum | 4 (9) |
| Muscle | 2 (5) |
| Pancreas | 3 (7) |
| Adrenal | 3 (7) |
| Bone | 2 (5) |
| Bowel or peritoneum | 2 (5) |
| Kidney | 1 (2) |
| Antiangiogenic therapy | |
| Bevacizumab alone | 5 (11) |
| Bevacizumab and interferon | |
| Low-dose interferon | 10 (23) |
| High-dose interferon | 29 (66) |
| Baseline measurements | |
| Hemoglobin (g/dL)* | 13.2 (9.4–16.7) |
| Platelets (K/μL)* | 307 (158–627) |
| Absolute neutrophils (K/μL)* | 5.3 (1.9–11.5) |
| Corrected calcium (mg/dL)* | 9.1 (8.2–9.8) |
| Serum alkaline phosphatase (IU/L)* | 90 (25–306) |
| Serum LDH (IU/L)† | 238 (71–1382) |
| Tumor changes at posttherapy CT | |
| Absolute size change (cm)* | 0.03 (−6.1 to 5.0) |
| Size change (%)* | 2 (−59 to 81) |
| Absolute attenuation change (HU)* | −3 (−63 to 66) |
| Attenuation change (%)* | −7 (−65 to 39) |
| Patient survival | |
| Progression free (y)* | 0.7 (0.1–3.9) |
| Overall (y)* | 1.6 (0.1–6.6) |
Note.—Unless otherwise indicated, data are number, with percentage in parentheses (n = 44). ECOG = Eastern Cooperative Oncology Group.
Data are means, with range in parentheses.
Data are medians, with range in parentheses.
A total of 118 target lesions in 44 patients were identified and measured. New metastatic lesions on the initial posttherapy CT study were found in 14% (six of 44) of patients. MASS criteria findings of marked central necrosis were present on the initial posttherapy CT images in less than 1% (one of 118) of target lesions (Fig 1), and findings of marked decreased attenuation were evident in 5% (six of 118) of target lesions in 14% (six of 44) of patients.
Figure 1.
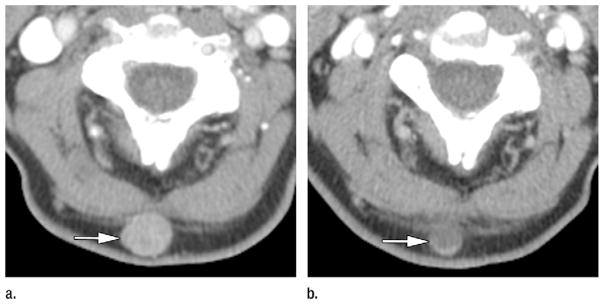
Axial CT images in a 64-year-old man with metastatic melanoma who was treated with bevacizumab antiangiogenic therapy. Patient had normal baseline serum LDH (144 IU/L) and metastases involving subcutaneous tissues, lung, pleura, mediastinal and hilar lymph nodes, adrenals, retroperitoneal fat, and bowel. (a) Pretherapy contrast-enhanced CT image shows 1.7-cm hypervascular subcutaneous metastasis (mean attenuation, 93 HU) in the posterior aspect of the neck (arrow). (b) On initial posttherapy contrast-enhanced CT image, metastasis had decreased in size (1.2 cm) and decreased in mean attenuation (30 HU). Total target lesion burden decreased by 43%. Per MASS criteria, patient had favorable response. Target lesion met criteria for both marked decreased attenuation (≥ 40 HU decrease) and marked central necrosis (> 50% of mass changing to near fluid attenuation after therapy). Patient had good clinical outcome, with progression-free survival of 22 months and overall survival of 26 months.
Significant differences in progression-free and overall survival were observed between each of the three objective response groups for RECIST, Choi criteria, and MASS criteria (P < .001 for each, Figs 2, 3). There was not a significant difference in progression-free survival between the groups with partial response per the Choi criteria and the groups that showed stable disease (P = .674), although the differences in analogous groups for RECIST and MASS criteria almost reached significance (P = .084 and P = .058, respectively). Differences in progression-free survival between stable disease and progressive disease per RECIST and Choi criteria and between indeterminate response and unfavorable response per MASS criteria were significant (P < .001 for RECIST and MASS criteria and P < .001 for Choi criteria). Similar trends were seen with the Kaplan-Meier estimates of overall survival (P < .001 for each), although differences in overall survival between partial response and stable disease per RECIST and Choi criteria, and between favorable response and indeterminate response per MASS criteria did not reach statistical significance (P = .394 for RECIST, P = .999 for Choi criteria, and P = .305 for MASS criteria).
Figure 2.

Line graphs show Kaplan-Meier estimated progression-free survival in patients grouped by objective response at initial posttherapy CT imaging per (a) RECIST, (b) Choi criteria, and (c) MASS criteria. PR = partial response, SD = stable disease, PD = progressive disease, FR = favorable response, IR = indeterminate response, UR = unfavorable response.
Figure 3.

Line graphs show Kaplan-Meier estimated overall survival in patients grouped by objective response at initial posttherapy CT imaging per (a) RECIST, (b) Choi criteria, and (c) MASS criteria. PR = partial response, SD = stable disease, PD = progressive disease, FR = favorable response, IR = indeterminate response, UR = unfavorable response.
All patients with favorable response per MASS criteria (100%, six of six) and all patients with partial response per RECIST (100%, three of three) on the initial posttherapy CT images had a good clinical response to therapy (progression-free survival > 9 months), although only 53% (eight of 15) of patients with partial response per Choi criteria had a similar good clinical response. All patients with unfavorable response per MASS criteria (100%, 11 of 11), progressive disease per RE-CIST (100%, 11 of 11), and progressive disease per Choi criteria (100%, 12 of 12) on the initial posttherapy CT images had a poor response to therapy (progression-free survival < 5 months). The worst objective responses of all three imaging criteria were highly predictive of poor overall survival, whereby all patients with progressive disease per RE- CIST (100%, 11 of 11) or Choi criteria (100%, 12 of 12) and all patients with unfavorable response per MASS criteria (100%, 11 of 11) had overall survival of less than 18 months.
Cox models were used to evaluate the effects of baseline serum LDH alone and baseline serum LDH in combination with objective response on the initial posttherapy CT study per RECIST, Choi criteria, and MASS criteria on progression-free and overall survival (Tables 2, 3). All other potential predictors (sex, age, body mass index, Eastern Cooperative Oncology Group performance status, time from diagnosis to start of therapy, number and location of metastatic sites, and baseline laboratory values including hemoglobin, platelets, absolute neutrophils, corrected calcium, and serum alkaline phosphatase) were not associated with progression-free survival (P =.059–.981) or overall survival (P =.065–.974). Baseline serum LDH was associated with progression- free (hazard ratio, 1.27 per 100 IU/L incremental increase; 95% CI: 1.10, 1.45; P = .001) and with overall (hazard ratio, 1.49 per 100 IU/L incremental increase; 95% CI: 1.22, 1.83; P < .001) survival. When each set of imaging criteria was combined with baseline serum LDH, the association of baseline serum LDH with progression-free survival (P < .004 for RECIST; P < .001 for Choi criteria; P < .002 for MASS criteria) and overall survival (P < .001 for each) remained significant, and the poor objective response group for all three sets of imaging criteria was significantly associated with progression-free (P < .001 for each) and overall (P < .001 for each) survival. Conversely, only the positive response group per MASS criteria was significantly associated with progression-free survival (favorable response vs indeterminate response; hazard ratio, 0.35; 95% CI: 0.13, 0.92; P = .033) when combined with baseline serum LDH. None of the positive response groups for the imaging criteria were significantly associated with overall survival when combined with baseline serum LDH values, although the sample size of positive response groups was low for RECIST (n = 3) and MASS criteria (n = 6).
Table 2.
Hazard Ratios Based on Cox Regression Analysis of Progression-free Survival
| Predictor and Effect | Hazard Ratio | P Value |
|---|---|---|
| RECIST | ||
| Partial response vs stable disease | 0.25 (0.06, 1.06) | .060 |
| Progressive vs stable disease | 5.95 (2.51, 14.09) | <.001 |
| Choi | ||
| Partial response vs stable disease | 0.70 (0.34, 1.46) | .344 |
| Progressive vs stable disease | 5.22 (2.13, 12.81) | <.001 |
| MASS | ||
| Favorable vs indeterminate response | 0.36 (0.13, 0.94) | .037 |
| Unfavorable vs indeterminate response | 5.58 (2.35, 13.24) | <.001 |
| LDH (per 100 IU/L increment) | 1.27 (1.10, 1.45) | .001 |
| LDH and RECIST | ||
| LDH (per 100 IU/L increment) | 1.28 (1.08, 1.50) | .004 |
| Partial response vs stable disease | 0.27 (0.06, 1.14) | .075 |
| Progressive vs stable disease | 5.57 (2.34, 13.27) | <.001 |
| LDH and Choi | ||
| LDH (per 100 IU/L increment) | 1.37 (1.17, 1.61) | <.001 |
| Partial response vs stable disease | 0.60 (0.29, 1.27) | .186 |
| Progressive vs stable disease | 5.58 (2.21, 14.07) | <.001 |
| LDH and MASS | ||
| LDH (per 100 IU/L increment) | 1.29 (1.10, 1.52) | .002 |
| Favorable vs indeterminate response | 0.35 (0.13, 0.92) | .033 |
| Unfavorable vs indeterminate response | 5.21 (2.18, 12.43) | <.001 |
Note.—Data in parentheses are 95% CIs.
Table 3.
Hazard Ratios Based on Cox Regression Analysis of Overall Survival
| Predictor and Effect | Hazard Ratio | P Value |
|---|---|---|
| RECIST | ||
| Partial response vs stable disease | 0.39 (0.09, 1.70) | .211 |
| Progressive vs stable disease | 5.31 (2.34, 12.06) | <.001 |
| Choi | ||
| Partial response vs stable disease | 1.15 (0.55, 2.41) | .708 |
| Progressive vs stable disease | 5.81 (2.40, 14.08) | <.001 |
| MASS | ||
| Favorable vs indeterminate response | 0.47 (0.16, 1.35) | .160 |
| Unfavorable vs indeterminate response | 5.07 (2.22, 11.57) | <.001 |
| LDH (per 100 IU/L increment) | 1.49 (1.22, 1.83) | <.001 |
| LDH and RECIST | ||
| LDH (per 100 IU/L increment) | 1.45 (1.16, 1.80) | .001 |
| Partial response vs stable disease | 0.46 (0.11, 2.02) | .305 |
| Progressive vs stable disease | 4.25 (1.88 9.59) | .001 |
| LDH and Choi | ||
| LDH (per 100 IU/L increment) | 1.51 (1.21 1.88) | <.001 |
| Partial response vs stable disease | 1.25 (0.59, 2.64) | .557 |
| Progressive vs stable disease | 5.22 (2.18, 12.54) | <.001 |
| LDH and MASS | ||
| LDH (per 100 IU/L increment) | 1.44 (1.16, 1.79) | .001 |
| Favorable vs indeterminate response | 0.53 (0.18, 1.56) | .251 |
| Unfavorable vs indeterminate response | 4.08 (1.80, 9.27) | .001 |
Note.—Data in parentheses are 95% CIs.
AUC estimates of accuracy for predicting progression-free survival at 9 months and overall survival at 18 months for Cox models containing baseline serum LDH alone and baseline serum LDH combined with objective response to the initial posttherapy CT study per RECIST, Choi criteria, and MASS criteria are depicted in Tables 4 and 5, respectively. Differences in AUC compared with baseline serum LDH alone are also evaluated, and corresponding receiver operating characteristics curves are found in Figure 4. The AUC for baseline serum LDH alone for predicting progression-free survival at 9 months and overall survival at 18 months was moderate (AUC = 0.793 and 0.689, respectively). Compared with baseline serum LDH alone, the AUC for predicting progression-free survival at 9 months significantly increased for LDH and RECIST (AUC = 0.911; 95% CI: 0.767, 0.986; AUC difference, 0.118; 95% CI: 0.003, ∞; P = .040) and for LDH and MASS criteria (AUC = 0.969; 95% CI: 0.880, 0.995; AUC difference, 0.176; 95% CI: 0.022, ∞; P = .020); however, the increase for LDH and Choi criteria compared with baseline serum LDH alone was not significant (AUC = 0.839; 95% CI: 0.727, 0.954; AUC difference, 0.046; 95% CI: −0.096, ∞; P = .999). Similar trends for AUC for predicting overall survival at 18 months were seen, although the increase in AUC compared with baseline serum LDH values alone met statistical significance for the combination of LDH and Choi criteria only (AUC = 0.880; 95% CI: 0.746, 0.963; AUC difference, 0.191; 95% CI: 0.007, ∞; P = .032).
Table 4.
AUC Estimates for Predicting 9-Month PFS by Using Various Predictors
| Predictor and Difference in AUC | Estimates | P Value |
|---|---|---|
| Model 1, LDH | 0.793 (0.608, 0.925) | |
| Model 2, LDH and RECIST | 0.911 (0.767, 0.986) | |
| Model 3, LDH and Choi | 0.839 (0.727, 0.954) | |
| Model 4, LDH and MASS | 0.969 (0.880, 0.995) | |
| AUC2 – AUC1* | 0.118 (0.003, ∞) | .040 |
| AUC3 – AUC1* | 0.046 (−0.096, ∞) | .999 |
| AUC4 – AUC1* | 0.176 (0.022, ∞) | .020 |
| AUC4 – AUC2† | 0.058 (0.000, 0.279) | .999 |
| AUC4 – AUC3† | 0.130 (−0.085, 0.298) | .336 |
| AUC2 – AUC3† | 0.072 (−0.190, 0.175) | .999 |
Note.—Data in parentheses are 95% CIs. Subscript numbers after AUC indicate model number.
Bonferroni method was used to control the Type I error to be .05 for the family of six pairwise comparisons of AUCs. The entry presents one-sided 95% simultaneous CI and adjusted P value.
The entry presents two-sided 95% simultaneous CI and adjusted P value.
Table 5.
AUC Estimates for Predicting 18-Month Overall Survival by Using Various Predictors
| Predictor and Difference in AUC | Estimates | P Value |
|---|---|---|
| Model 1, LDH | 0.689 (0.521, 0.842) | |
| Model 2, LDH and RECIST | 0.803 (0.670, 0.922) | |
| Model 3, LDH and Choi | 0.880 (0.746, 0.963) | |
| Model 4, LDH and MASS | 0.813 (0.673, 0.923) | |
| AUC2 – AUC1* | 0.114 (−0.011, ∞) | .095 |
| AUC3 – AUC1* | 0.191 (0.007, ∞) | .032 |
| AUC4 – AUC1* | 0.124 (−0.008, ∞) | .080 |
| AUC4 – AUC2† | 0.010 (−0.076, 0.081) | .999 |
| AUC4 – AUC3† | −0.067 (−0.244, 0.073) | .999 |
| AUC2 – AUC3† | −0.077 (−0.247, 0.070) | .999 |
Note.—Data in parentheses are 95% CIs. Subscript numbers after AUC indicate model number.
Bonferroni method was used to control the Type I error to be .05 for the family of six pairwise comparisons of AUCs. The entry presents one-sided 95% simultaneous CI and adjusted P value.
The entry presents two-sided 95% simultaneous CI and adjusted P value.
Figure 4.
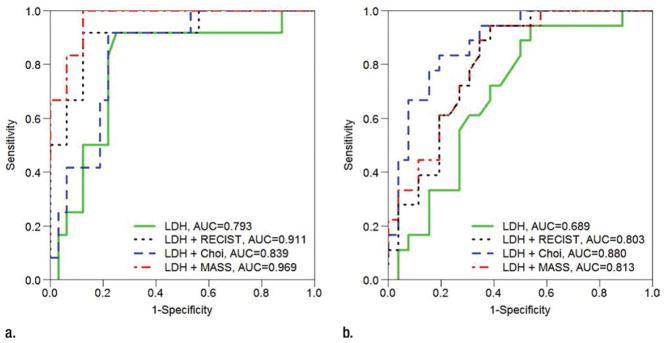
Receiver operating characteristics analysis shows accuracy (AUC) of various models for predicting (a) progression-free survival at 9 months and (b) overall survival at 18 months. Baseline serum LDH alone served as referent and is compared with models incorporating baseline serum LDH and RECIST, Choi criteria, and MASS criteria.
Discussion
The major finding of the study is that tumor devascularization assessed according to MASS criteria at the first CT imaging examination after bevacizumab therapy combined with baseline serum LDH levels had the highest accuracy for predicting survival in patients with metastatic melanoma. Initial posttherapy imaging findings of tumor devascularization were shown to be additive to the predictive value of baseline serum LDH levels, a previously established predictive biomarker for metastatic melanoma.
These findings are particularly important because serum LDH levels are easy to obtain in all patients, and contrast-enhanced CT imaging is universally available and widely used in response evaluation of metastatic melanoma. Predicting survival by using a combination of a serum biomarker and CT imaging findings for patients with metastatic melanoma who were treated with antiangiogenic therapy would be useful to predict response and guide subsequent therapy, which would maximize the use of antiangiogenic agents in responders and avoid unnecessary drug toxicities and cost in nonresponders.
Authors of similar studies (9–14,18,19) have shown that initial posttherapy imaging findings of tumor devascularization are associated with survival in other vascular tumors that were treated with antiangiogenic therapy, including metastatic renal cell carcinoma, metastatic gastrointestinal stromal tumor, metastatic colorectal cancer, and hepatocellular carcinoma. Choi criteria initial posttherapy imaging response is a strong predictor of survival in patients with metastatic gastrointestinal stromal tumors, but not for those with metastatic renal cell and hepatocellular carcinoma treated with antiangiogenic therapy, or in this study of metastatic melanoma treated with bevacizumab antiangiogenic therapy (10–14,18). Reasons that one imaging response criteria is a better predictive biomarker for a tumor include inherent differences in tumor biology and response to antiangiogenic therapy, patient-related factors that are not well understood, and different thresholds and metrics of tumor devascularization found in the various imaging criteria.
Less than 1% (one of 118) and 5% (six of 118) of target lesions demonstrated marked central necrosis or marked decreased attenuation, respectively, with these findings indicating favorable response per MASS criteria. RECIST does not include measures of tumor attenuation or necrosis, and only three patients met partial response on the initial posttherapy CT study compared with six patients who met favorable response per MASS criteria. Nevertheless, changes in tumor size and presence of new metastases were major driving forces that separated patients into the favorable and poor imaging response categories for each imaging criteria. The change in target lesion size threshold required to meet favorable response per MASS criteria was a 20% or greater decrease in size, compared with a 30% or greater decrease in size required to meet partial response per RECIST and a 10% or greater decrease in size required to meet partial response per Choi criteria. These differences in size threshold accounted for many of the differences in favorable imaging response categorization between these criteria.
There were several potential limitations of our study. First, this study had inherent limitations in design as a secondary retrospective analysis, although a major strength of the study was inclusion of patients from a phase II prospective randomized controlled clinical trial. Second, the sample size (n = 44) was small, but it was difficult to recruit a large number of patients with metastatic melanoma because it is a rare condition. Third, a single reader interpreted all imaging studies, and interobserver variability in objective imaging response categorization was not assessed in this study. However, interobserver variability has been assessed previously with RECIST, Choi criteria, and MASS criteria, and it is low (13,14). Fourth, it is unclear how using initial posttherapy response to RECIST as a predictor of progression-free and overall survival would be affected by use of RECIST progressive disease as the reference standard for calculating progression-free survival, particularly because the reader for the current study did not participate in determining RECIST progressive disease or progression-free survival in the prospective clinical trial. Of note, overall survival is somewhat independent of progression-free survival and was used as an alternate reference standard in the current study, and the initial posttherapy CT examinations were also evaluated per Choi and MASS criteria, which were not used in the prospective trial and are not subject to the same potential limitation.
Future research in a separate patient cohort should be conducted to validate the findings of this study. The association of initial posttherapy CT findings with quality-of-life metrics should also be explored. Finally, a prospective study evaluating changes in treatment decisions based on objective imaging response could be conducted.
In conclusion, the major finding of this retrospective secondary analysis of a phase II prospective study of patients with metastatic melanoma treated with bevacizumab therapy is that a combination of tumor devascularization assessed by means of MASS criteria at the first posttherapy CT imaging examination and a serum biomarker (baseline LDH levels) has a high degree of accuracy in predicting survival.
Supplementary Material
Advances in Knowledge.
In multivariate analysis, a high baseline serum lactate dehydrogenase (LDH) level was associated with decreased progression-free survival (hazard ratio = 1.29 for each increase of 100 IU/L; P = .002) and overall survival (hazard ratio = 1.44 for each increase of 100 IU/L; P = .001).
All patients with a favorable response per the Morphology, Attenuation, Size, and Structure [MASS] criteria (100%, six of six) and all patients with partial response per Response Evaluation Criteria in Solid Tumors (100%, three of three) at the initial CT examination had a positive clinical response to therapy (progression-free survival >9 months), but only 53% (eight of 15) of patients with a partial response per Choi criteria had a similar positive clinical response.
A combination of baseline serum LDH level and evaluation with MASS criteria at the first CT examination after therapy had a high degree of accuracy for prediction of progression-free survival at 9 months (area under the curve [AUC] = 0.969) with significantly higher accuracy than that of baseline serum LDH alone (AUC = 0.793, P = .020).
Implication for Patient Care.
Accurate prediction of survival with a combination of a serum biomarker (LDH) level and initial imaging findings of tumor devascularization after antiangiogenic therapy in patients with metastatic melanoma could help to guide subsequent therapy, maximize the use of antiangiogenic agents in responders, and avoid unnecessary drug toxicity and cost in nonresponders.
Abbreviations
- AUC
area under the curve
- CI
confidence interval
- LDH
lactate dehydrogenase
- MASS
Morphology, Attenuation, Size, and Structure
- RECIST
Response Evaluation Criteria in Solid Tumors
Footnotes
Online supplemental material is available for this article.
Disclosures of Conflicts of Interest: M.R.G. No relevant conflicts of interest to disclose. S.M.d.C. No relevant conflicts of interest to disclose. X.Z. No relevant conflicts of interest to disclose. H.Z. No relevant conflicts of interest to disclose. F.F.S. No relevant conflicts of interest to disclose. W.E.C. No relevant conflicts of interest to disclose. A.D.S. Financial activities related to the present article: none to disclose. Financial activities not related to the present article: grant pending from Pfizer. Other relationships: none to disclose.
Author contributions:
Guarantors of integrity of entire study, M.R.G., F.F.S., A.D.S.; study concepts/study design or data acquisition or data analysis/interpretation, all authors; manuscript drafting or manuscript revision for important intellectual content, all authors; approval of final version of submitted manuscript, all authors; literature research, M.R.G., F.F.S., A.D.S.; clinical studies, M.R.G., S.M.d.C., H.Z., W.E.C., A.D.S.; experimental studies, H.Z.; statistical analysis, M.R.G., X.Z., H.Z., A.D.S.; and manuscript editing, M.R.G., S.M.d.C., X.Z., H.Z., F.F.S., A.D.S.
References
- 1.Heakal Y, Kester M, Savage S. Vemurafenib (PLX4032): an orally available inhibitor of mutated BRAF for the treatment of metastatic melanoma. Ann Pharmacother. 2011;45(11):1399–1405. doi: 10.1345/aph.1Q363. [DOI] [PubMed] [Google Scholar]
- 2.Balch CM, Gershenwald JE, Soong SJ, et al. Final version of 2009 AJCC melanoma staging and classification. J Clin Oncol. 2009;27(36):6199–6206. doi: 10.1200/JCO.2009.23.4799. [DOI] [PMC free article] [PubMed] [Google Scholar]
- 3.Gogas H, Eggermont AM, Hauschild A, et al. Biomarkers in melanoma. Ann Oncol. 2009;20(Suppl 6):vi8–vi13. doi: 10.1093/annonc/mdp251. [DOI] [PMC free article] [PubMed] [Google Scholar]
- 4.González-Cao M, Viteri S, Díaz-Lagares A, et al. Preliminary results of the combination of bevacizumab and weekly Paclitaxel in advanced melanoma. Oncology. 2008;74(1–2):12–16. doi: 10.1159/000138351. [DOI] [PubMed] [Google Scholar]
- 5.Grignol VP, Olencki T, Relekar K, et al. A phase 2 trial of bevacizumab and high-dose interferon alpha 2B in metastatic melanoma. J Immunother. 2011;34(6):509–515. doi: 10.1097/CJI.0b013e31821dcefd. [DOI] [PMC free article] [PubMed] [Google Scholar]
- 6.Perez DG, Suman VJ, Fitch TR, et al. Phase 2 trial of carboplatin, weekly paclitaxel, and biweekly bevacizumab in patients with unresectable stage IV melanoma: a North Central Cancer Treatment Group study, N047A. Cancer. 2009;115(1):119–127. doi: 10.1002/cncr.23987. [DOI] [PMC free article] [PubMed] [Google Scholar]
- 7.Varker KA, Biber JE, Kefauver C, et al. A randomized phase 2 trial of bevacizumab with or without daily low-dose interferon alfa-2b in metastatic malignant melanoma. Ann Surg Oncol. 2007;14(8):2367–2376. doi: 10.1245/s10434-007-9389-5. [DOI] [PubMed] [Google Scholar]
- 8.Eisenhauer EA, Therasse P, Bogaerts J, et al. New response evaluation criteria in solid tumours: revised RECIST guideline (version 1. 1) Eur J Cancer. 2009;45(2):228–247. doi: 10.1016/j.ejca.2008.10.026. [DOI] [PubMed] [Google Scholar]
- 9.Smith AD, Shah SN, Rini BI, Lieber ML, Remer EM. Utilizing pre-therapy clinical schema and initial CT changes to predict progression-free survival in patients with metastatic renal cell carcinoma on VEGF-targeted therapy: A preliminary analysis. Urol Oncol. 2011 Sep 26; doi: 10.1016/j.urolonc.2011.08.010. Epub ahead of print. [DOI] [PubMed] [Google Scholar]
- 10.Benjamin RS, Choi H, Macapinlac HA, et al. We should desist using RECIST, at least in GIST. J Clin Oncol. 2007;25(13):1760–1764. doi: 10.1200/JCO.2006.07.3411. [DOI] [PubMed] [Google Scholar]
- 11.Choi H, Charnsangavej C, Faria SC, et al. Correlation of computed tomography and positron emission tomography in patients with metastatic gastrointestinal stromal tumor treated at a single institution with imatinib mesylate: proposal of new computed tomography response criteria. J Clin Oncol. 2007;25(13):1753–1759. doi: 10.1200/JCO.2006.07.3049. [DOI] [PubMed] [Google Scholar]
- 12.Choi H. Response evaluation of gastrointestinal stromal tumors. Oncologist. 2008;13(Suppl 2):4–7. doi: 10.1634/theoncologist.13-S2-4. [DOI] [PubMed] [Google Scholar]
- 13.Smith AD, Lieber ML, Shah SN. Assessing tumor response and detecting recurrence in metastatic renal cell carcinoma on targeted therapy: importance of size and attenuation on contrast-enhanced CT. AJR Am J Roentgenol. 2010;194(1):157–165. doi: 10.2214/AJR.09.2941. [DOI] [PubMed] [Google Scholar]
- 14.Smith AD, Shah SN, Rini BI, Lieber ML, Remer EM. Morphology, Attenuation, Size, and Structure (MASS) criteria: assessing response and predicting clinical outcome in metastatic renal cell carcinoma on antiangiogenic targeted therapy. AJR Am J Roentgenol. 2010;194(6):1470–1478. doi: 10.2214/AJR.09.3456. [DOI] [PubMed] [Google Scholar]
- 15.Nishino M, Jagannathan JP, Ramaiya NH, Van den Abbeele AD. Revised RECIST guideline version 1. 1: What oncologists want to know and what radiologists need to know. AJR Am J Roentgenol. 2010;195(2):281–289. doi: 10.2214/AJR.09.4110. [DOI] [PubMed] [Google Scholar]
- 16.Heagerty PJ, Zheng Y. Survival model predictive accuracy and ROC curves. Biometrics. 2005;61(1):92–105. doi: 10.1111/j.0006-341X.2005.030814.x. [DOI] [PubMed] [Google Scholar]
- 17.Efron B, Tibshirani RJ. An introduction to the bootstrap. In: Efron B, editor. Monographs on statistics and applied probability. Boca Raton, Fla: Chapman & Hall/CRC; 1994. pp. 168–177. [Google Scholar]
- 18.Faivre S, Zappa M, Vilgrain V, et al. Changes in tumor density in patients with advanced hepatocellular carcinoma treated with sunitinib. Clin Cancer Res. 2011;17(13):4504–4512. doi: 10.1158/1078-0432.CCR-10-1708. [DOI] [PubMed] [Google Scholar]
- 19.Chung WS, Park MS, Shin SJ, et al. Response evaluation in patients with colorectal liver metastases: RECIST version 1. 1 versus modified CT criteria. AJR Am J Roentgenol. 2012;199(4):809–815. doi: 10.2214/AJR.11.7910. [DOI] [PubMed] [Google Scholar]
Associated Data
This section collects any data citations, data availability statements, or supplementary materials included in this article.