

Abstract
Neglect of diatomic differential overlap (NDDO) and self-consistent density-functional tight-binding (SCC-DFTB) semiempirical models commonly employed in combined quantum mechanical/molecular mechanical simulations fail to adequately describe the deoxyribose and ribose sugar ring puckers. This failure limits the application of these methods to RNA and DNA systems. In this work, we provide benchmark ab initio gas-phase two-dimensional potential energy scans of the RNA and DNA sugar puckering. The benchmark calculations are compared with semiempirical models. Pucker corrections are introduced into the semiempirical models via B-spline interpolation of the potential energy difference surface relative to the benchmark data. The corrected semiempirical models are shown to well reproduce the ab initio puckering profiles. Furthermore, we demonstrate that the uncorrected semiempirical models do not usually produce a transition state between the A-form and B-form sugar puckers, but the ab initio transition state is reproduced when the B-spline correction is used.
Introduction
Sugar rings play a central role in biological systems. They are one of the building blocks of carbohydrates1−3 and are the flexible link between the nucleic acid nucleobase and phosphate backbone.4,5 By adopting different puckering conformations, sugar rings alter the relative orientation of the phosphate backbone, nucleobase, and ribonucleotide 2′-OH. As a result, changes in sugar ring pucker lead to variations in the overall structure and function of nucleic acids.4,5 The sugar ring pucker conformations affect the overall structure of RNA and DNA by maintaining a stable helical form.6−8 This effect on structure translates to an affect on function. For example, the structure of A-form and B-form helices display differences in their major and minor grooves, which in turn play a vital role in protein recognition.9,10 The adoption of specific sugar pucker conformations have also been found to be critical for nucleic acid polymerization and catalysis reactions.11−14
An accurate quantum mechanical description of sugar ring pucker is thus a vital component to the modeling of larger biological macromolecules. High-level quantum mechanical (QM) methods are successful at describing the relative energy of ring conformations15−22 but at a cost that exceeds their utility in molecular simulation. It has thus become common practice to incorporate neglect of diatomic differential overlap (NDDO) or density functional tight-binding (DFTB) semiempirical quantum models within combined quantum mechanical/molecular mechanical (QM/MM) methods23−26 to provide a tractable description suitable for simulation. Recent evidence suggests that semiempirical methods fail to adequately model the conformational landscape of sugar rings,27−29 presumably due to approximations inherent within these methods used to achieve their efficiency. Accurate modeling of conformational energy barriers is particularly problematic for the NDDO-based methods (although progress has been made for the OMx methods30−34), which in the present case is exacerbated by the strain of the five-membered ring.
In this work, we improve the semiempirical description of sugar rings with an empirical correction without unnecessarily complicating their functional forms nor requiring a significant amount of additional computation. We introduce a suitable coordinate system to characterize the sugar ring conformations and use this definition to map the conformational landscape of sugar rings in RNA and DNA nucleosides with benchmark ab initio calculations. The reference calculations are compared to the AM1/d-PhoT35 and DFTB336 semiempirical methods. The difference between the reference and semiempirical landscapes produces a table of correction energies from which we interpolate. By interpolating the correction from two dihedral angles within the ring, we avoid making direct modifications to the underlying electronic structure method. Upon applying the interpolated corrections, the semiempirical models are shown to well reproduce the reference ab initio calculations. The significance of this work is in providing the high-level reference data, identifying and quantifying the errors in semiempirical models, and describing our strategy for their improvement.
Methods
Sugar rings adopt puckered conformations to reduce steric and electronic repulsions, and several mathematical definitions have been put forth to characterize and distinguish between them37−43 with so-called pseudorotation or puckering parameters. The definition we use, Zx and Zy (described below), is highly related to those developed by Sato42 and Altona39 and requires only two proper endocyclic torsions within the ring
| 1 |
| 2 |
where ν1 and ν3 are the proper torsions shown in Figure 1. Zx and Zy are linear combinations of these angles and can be interpreted as a Cartesian representation of the pseudorotation wheel illustrated in Figure 1. The relationships between this definition of pseudorotation and the more common43 usage of phase Pθ and amplitude Ar, which can be viewed as the polar coordinate representation of Figure 1, are
| 3 |
| 4 |
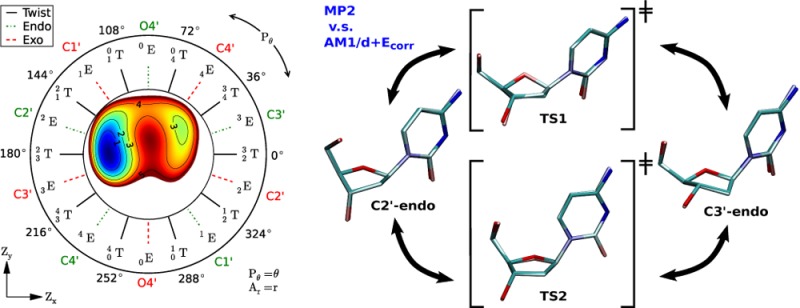
Figure 1.
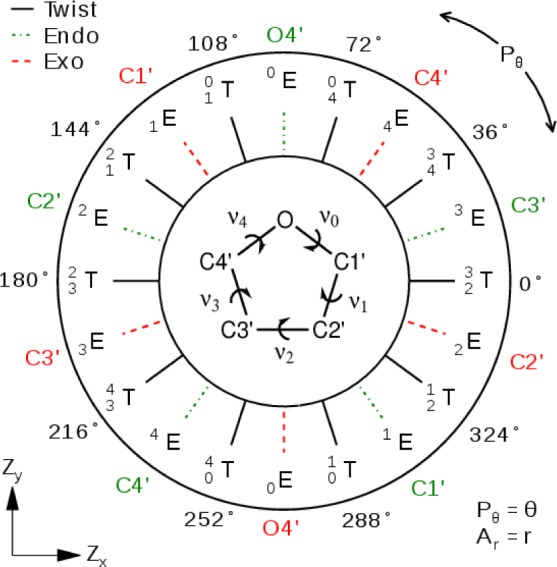
Furanose pseudorotation wheel. The furanose proper torsions ν are inset with a molecular structure. A ring’s pseudorotation can be characterized by a position within the wheel using the Ar–Pθ polar coordinates or the Zx–Zy Cartesian coordinates. The red dashed, green dotted, and black lines indicate Exo (nE), Endo (nE), and Twist (nmT) conformations, respectively, where the integers m and n denote the O4′, C1′, C2′, C3′, and C4′ atoms in respective order.
The energy profiles of the deoxyribonucleosides deoxyadenosine (dA), deoxyguanosine (dG), deoxycytidine (dC), and thymidine (dT) and the ribonucleosides adenosine (rA), guanosine (rG), cytidine (rC), and uridine (rU) are shown in Figures 2 and 3 as 2D contours of the Zx and Zy puckering parameters. These contours were constructed by scanning the Zx and Zy in a series of constrained geometry optimizations from −60° to 60° in steps of 6°. The geometry optimizations imposed several additional torsion constraints listed in Table 1, together with constraint parameters from NAB program,44 to mimic the nuceleoside connection to the B-DNA or A-RNA backbone while avoiding intramolecular hydrogen bonding interactions. Although intramolecular hydrogen bonding involving the 2′-OH group is known to affect the RNA conformation,45 the purpose here is to characterize and formulate a correction for the intrinsic (steric) conformational profile that is decoupled from intramolecular hydrogen bonding. The scans were performed using MP2/6-311++G(3df,2p)//MP2/6-31++G(d,p) and B3LYP/6-311++G(3df,2p)//B3LYP/6-31++G(d,p) as implemented in Gaussian 09,46 which we shall refer to as MP2 and B3LYP henceforth unless otherwise explicitly noted, and the semiempirical models PM6,47 AM1/d-PhoT,35 DFTB2-mio,48 and DFTB3-mio.49 The DFTB2-mio and PM6 results and conclusions are sufficiently similar to DFTB3-mio and AM1/d-PhoT, respectively, that we have placed them in the Supporting Information. We will refer to the AM1/d-PhoT and DFTB3-mio quantum models as AM1/d and DFTB3, respectively.
Figure 2.

2D contours of sugar pseudorotation of nucleosides. The energy units along each contour curve are in kcal/mol, and all energy values are calculated with respect to the global minimum.
Figure 3.
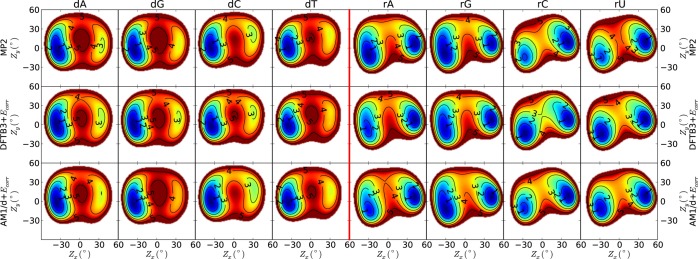
2D contours of sugar pseudorotation of nucleosides calculated with corrected DFTB3 and AM1/d methods and compared with the MP2 method. The energy units along each contour curve are in kcal/mol, and all energy values are calculated with respect to the global minimum.
Table 1. Constrained Dihedral Angles in Nucleosidesa.
| dihedral angle | B-DNA | A-RNA | |
|---|---|---|---|
| β | H5′–O5′–C5′–C4′ | –151.5 | –179.9 |
| γ | O5′–C5′–C4′–C3′ | 30.9 | 47.4 |
| ε | C4′–C3′–O3′–H3′ | 159.1 | –151.7 |
| χR | O4′–C1′–N9–C4 | –99.4 | –166.1 |
| χY | O4′–C1′–N1–C2 | –99.4 | –166.1 |
| C3′–C2′–O2′–H2′ | – | –169.7 |
The constrained torsion values are taken from the NAB program in the AmberTools 13 program suite. For glycosidic bond torsion (χ), the numbering scheme for purines (R) and pyrimidines (Y) are labeled by subscripts and indicated separately.
The pseudorotation angles, puckering amplitudes, and the relative energies of the stationary points of dH and rH, DNA, and RNA nucleosides are listed in Tables 2, 3, and 4, respectively. MIN1 and MIN2 are the “Eastern” (large Zx) and “Western” (small Zx) minima as observed in the 2D contours. TS1 and TS2 are the “Northern” (large Zy) and “Southern” (small Zy) transition states. Minimum energy paths and associated pseudorotation amplitudes resulting from a nudged elastic band50 analysis of the 2D contours are provided in the Supporting Information.
Table 2. Pseudorotation Phases Pθ, Pucker Amplitudes Ar, and Relative Energies ΔE of Minima (MIN) and Transition States (TS) of Abasic Nucleosides, dH and rHa.
| MIN1 |
MIN2 |
TS1 |
TS2 |
||||||||||
|---|---|---|---|---|---|---|---|---|---|---|---|---|---|
| Pθ (deg) | Ar (deg) | ΔE (kcal/mol) | Pθ (deg) | Ar (deg) | ΔE (kcal/mol) | Pθ (deg) | Ar (deg) | ΔE (kcal/mol) | Pθ (deg) | Ar (deg) | ΔE (kcal/mol) | ||
| dH | CBS-QB3b | 6.3 | 42.0 | 2.5 | 156.2 | 40.5 | 0.0 | 77.8 | 42.6 | 2.9 | 317.0 | 42.0 | 3.0 |
| CBS-QB3 | 336.4 | 38.4 | 2.9 | 157.8 | 39.8 | 0.0 | 78.2 | 39.4 | 3.0 | 263.4 | 36.8 | 1.9 | |
| MP2c | 6.3 | 42.0 | 2.4 | 156.2 | 40.5 | 0.0 | 77.8 | 42.6 | 2.8 | 317.0 | 42.0 | 2.9 | |
| MP2tzd | 2.5 | 42.1 | 2.6 | 155.6 | 40.5 | 0.0 | 76.6 | 42.8 | 3.0 | 319.0 | 42.2 | 2.9 | |
| B3LYPe | 358.4 | 38.6 | 1.4 | 153.1 | 38.3 | 0.0 | 58.9 | 38.8 | 1.6 | 293.2 | 37.5 | 1.8 | |
| rH | CBS-QB3b | 357.4 | 43.2 | 1.5 | 150.8 | 43.2 | 0.0 | 74.2 | 42.1 | 3.6 | 278.9 | 32.7 | 5.1 |
| CBS-QB3 | 355.1 | 39.9 | 1.6 | 153.0 | 41.3 | 0.0 | 68.2 | 38.7 | 3.6 | 274.8 | 30.9 | 5.1 | |
| MP2c | 357.4 | 43.2 | 1.4 | 150.8 | 43.2 | 0.0 | 74.2 | 42.1 | 3.5 | 278.9 | 32.7 | 4.9 | |
| MP2tzd | 356.4 | 43.1 | 1.5 | 150.5 | 43.2 | 0.0 | 73.2 | 42.2 | 3.4 | 280.1 | 32.8 | 4.7 | |
| B3LYPe | 359.0 | 39.9 | 1.2 | 149.3 | 40.9 | 0.0 | 64.1 | 38.2 | 2.3 | 276.6 | 30.0 | 4.0 | |
Nucleobases in the dH and rH are replaced by hydrogen atoms.
CBS-QB3//MP2/6-31++G(d,p).
MP2/6-311++G(3df,2p)//MP2/6-31++G(d,p).
MP2/cc-pVTZ//MP2/6-31+G(d).
B3LYP/6-311++G(3df,2p)//B3LYP/6-31++G(d,p).
Table 3. Pseudorotation Phases Pθ, Pucker Amplitudes Ar, and Relative Energies ΔE of Minima (MIN) and Transition States (TS) of DNA Nucleosides.
| MIN1 |
MIN2 |
TS1 |
TS2 |
||||||||||
|---|---|---|---|---|---|---|---|---|---|---|---|---|---|
| Pθ (deg) | Ar (deg) | ΔE (kcal/mol) | Pθ (deg) | Ar (deg) | ΔE (kcal/mol) | Pθ (deg) | Ar (deg) | ΔE (kcal/mol) | Pθ (deg) | Ar (deg) | ΔE (kcal/mol) | ||
| dA | MP2a | 358.7 | 34.3 | 2.9 | 189.8 | 34.7 | 0.0 | 83.7 | 40.6 | 4.5 | 295.0 | 13.4 | 4.9 |
| B3LYPb | 13.6 | 33.1 | 1.8 | 187.3 | 32.6 | 0.0 | 75.4 | 37.2 | 2.2 | 300.4 | 13.1 | 3.0 | |
| DFTB3 | 347.0 | 23.4 | 0.6 | 194.6 | 28.3 | 0.0 | 66.5 | 28.6 | 1.1 | 289.1 | 8.1 | 0.9 | |
| AM1/d | 281.5 | 11.3 | 0.0 | – | – | – | – | – | – | – | – | – | |
| dG | MP2a | 357.8 | 33.9 | 3.1 | 190.6 | 34.8 | 0.0 | 83.2 | 40.4 | 4.7 | 293.7 | 14.2 | 5.0 |
| B3LYPb | 18.1 | 33.8 | 1.9 | 186.8 | 33.1 | 0.0 | 74.3 | 37.0 | 2.4 | 300.3 | 13.5 | 3.2 | |
| DFTB3 | 345.1 | 23.4 | 0.7 | 195.3 | 28.6 | 0.0 | 67.8 | 28.3 | 1.3 | 290.8 | 8.9 | 1.0 | |
| AM1/d | – | – | – | 269.5 | 11.9 | 0.0 | – | – | – | – | – | – | |
| dC | MP2a | 36.8 | 37.5 | 2.8 | 180.2 | 35.4 | 0.0 | 89.6 | 39.9 | 3.9 | 344.2 | 3.6 | 4.9 |
| B3LYPb | 40.9 | 35.2 | 1.5 | 179.3 | 33.3 | 0.0 | 81.4 | 37.1 | 1.7 | – | – | – | |
| DFTB3 | 353.1 | 18.4 | 0.5 | 190.3 | 27.1 | 0.0 | 91.4 | 29.0 | 1.1 | 282.6 | 4.2 | 0.7 | |
| AM1/d | 292.8 | 9.6 | 0.0 | – | – | – | – | – | – | – | – | – | |
| dT | MP2a | 26.5 | 33.5 | 3.2 | 180.8 | 35.4 | 0.0 | 90.6 | 38.3 | 4.5 | 4.9 | 3.4 | 5.0 |
| B3LYPb | 38.6 | 34.1 | 1.7 | 180.1 | 33.3 | 0.0 | 85.4 | 35.9 | 2.1 | – | – | – | |
| DFTB3 | 354.9 | 17.3 | 0.7 | 189.3 | 27.5 | 0.0 | 95.2 | 22.5 | 1.7 | 310.2 | 4.0 | 0.8 | |
| AM1/d | 277.0 | 7.9 | 0.0 | – | – | – | – | – | – | – | – | – | |
MP2/6-311++G(3df,2p)//MP2/6-31++G(d,p).
B3LYP/6-311++G(3df,2p)//B3LYP/6-31++G(d,p).
Table 4. Pseudorotation Phases Pθ, Pucker Amplitudes Ar, and Relative Energies ΔE of Minima (MIN) and Transition States (TS) of RNA Nucleosidesa.
| MIN1 |
MIN2 |
TS1 |
||||||||
|---|---|---|---|---|---|---|---|---|---|---|
| Pθ (deg) | Ar (deg) | ΔE (kcal/mol) | Pθ (deg) | Ar (deg) | ΔE (kcal/mol) | Pθ (deg) | Ar (deg) | ΔE (kcal/mol) | ||
| rA | MP2b | 8.5 | 42.5 | 0.0 | 200.8 | 33.1 | 0.0 | 87.9 | 32.2 | 3.7 |
| B3LYPc | 10.5 | 38.6 | 0.6 | 185.6 | 30.5 | 0.0 | 57.7 | 33.9 | 1.5 | |
| DFTB3 | 14.3 | 31.8 | 2.2 | 172.8 | 30.2 | 0.0 | 36.5 | 27.8 | 2.4 | |
| AM1/d | – | – | – | 191.2 | 19.8 | 0.0 | – | – | – | |
| rG | MP2b | 9.1 | 42.5 | 0.1 | 197.9 | 33.3 | 0.0 | 85.5 | 34.0 | 3.7 |
| B3LYPc | 10.7 | 38.8 | 0.6 | 181.7 | 31.6 | 0.0 | 57.2 | 34.4 | 1.6 | |
| DFTB3 | 14.5 | 31.6 | 2.6 | 173.0 | 30.5 | 0.0 | 36.2 | 27.1 | 2.7 | |
| AM1/d | – | – | – | 189.6 | 21.7 | 0.0 | – | – | – | |
| rC | MP2b | 13.5 | 41.4 | 0.0 | 207.5 | 31.1 | 0.9 | 91.2 | 12.6 | 3.8 |
| B3LYPc | 17.3 | 36.8 | 0.0 | 193.3 | 26.5 | 0.5 | 106.6 | 16.8 | 1.3 | |
| DFTB3 | – | – | – | 193.2 | 24.2 | 0.0 | – | – | – | |
| AM1/d | – | – | – | 185.5 | 16.9 | 0.0 | – | – | – | |
| rU | MP2b | 12.7 | 42.0 | 0.0 | 207.8 | 31.9 | 0.9 | 89.2 | 14.3 | 4.3 |
| B3LYPc | 15.0 | 37.6 | 0.0 | 193.8 | 28.3 | 0.5 | 102.8 | 19.7 | 1.7 | |
| DFTB3 | – | – | – | 193.4 | 26.1 | 0.0 | – | – | – | |
| AM1/d | – | – | – | 188.9 | 19.2 | 0.0 | – | – | – | |
Only TS1 of RNA nucleosides are present.
MP2/6-311++G(3df,2p)//MP2/6-31++G(d,p).
B3LYP/6-311++G(3df,2p)//B3LYP/6-31++G(d,p).
Table 2 compares the stationary point energies and geometries for the abasic nucleosides dH and rH computed with our MP2 reference and several other ab initio methods. The purpose of this comparison is to validate our MP2 calculations, which are similar to those used in previous related works.15−22,45 Specifically, Table 2 compares MP2/6-311++G(3df,2p)//MP2/6-31++G(d,p) to CBS-QB3,51 CBS-QB3//MP2/6-31++G(d,p), MP2/cc-pVTZ//MP2/6-31+G(d) (abbreviated as MP2tz here), and B3LYP/6-311++G(3df,2p)//B3LYP/6-31++G(d,p). We note that the CBS-QB3 protocol, by construction, involves a B3LYP/6-311G(3df,2d,p) geometry optimization.
Figure 3 displays the DFTB3 and AM1/d energy contours upon applying a molecular mechanical (i.e., nonelectronic) sugar pucker correction Ecorr(Z) ≡ Ecorr(Zx,Zy), defined by the difference between the MP2 and semiempirical energies relative to their respective minima, i.e.,
| 5 |
where Ecorr(Z) is an energy correction at Z
| 6 |
EX(Z) is the energy of method X (MP2 or model), and minZ{EX(Z)} is the energy at the global minimum. The above procedure could be used to produce a separate correction for each nucleoside; however, we noticed that the four DNA and four RNA nucleoside correction profiles were similar enough that it sufficed to use only two corrections: an average correction for DNA nucleosides and an average correction for RNA nucleosides. The two averaged correction profiles are a discrete sampling of the energy correction landscape on a uniform grid. In order to obtain atomic forces, continuous representations of the corrections are constructed from Cardinal B-spline interpolation of the pretabulated values. Cardinal B-splines are useful for multi-dimensional interpolation in molecular applications, including application in smooth particle mesh Ewald methods and have been thoroughly described elsewhere.52,53 In brief, let t index the uniform grid. The location of the grid points are then Zt = Ẑx(tx – 1)Lx/Nx + Ẑy(ty – 1)Ly/Ny, where L and Ẑ are the lengths and directions of the “unit cell” containing the pretabulated values, and N is the number of pretabulated points in each direction. The energy correction interpolated from the pretabulated grid data is
| 7 |
where
| 8 |
is a weight constructed from nth-order Cardinal B-splines
| 9 |
which is nonzero only for u ∈ (0,n), and
| 10 |
is a modified set of pretabulated values of the energy correction to remove the artifacts of weighting the data. In this notation, kx = 2πk1Lx/Nx is an “angular wave number” of a plane wave basis function, where k1 is an integer. If we had simply set Ẽ(Zt) = Ecorr(Z), then interpolation of the data at Zt using eq 7 would not yield Ecorr(Zt) because nearby values would still contribute with a nonzero weight. To resolve this, eq 10 projects Ecorr(Z) and w(Z) into a basis of plane waves via Fast Fourier Transforms (FFTs), divides the Fourier coefficients of Ecorr(Z) by those of w(Z), and re-evaluates the scaled data back onto the grid points with a reverse FFT.
Although the present work is focused on applying corrections to improve the sugar puckers of DNA and RNA nucleosides, our approach could just as easily be extended to other systems, such as furanose sugars with different substituents. Our approach is to choose the correction by performing scans of the two-dimensional potential, and we found it sufficient to use a single correction for the DNA nucleosides and a single correction for the RNA nucleosides. If one were to apply this correction to other systems, such as furanose sugars, and found that different corrections were needed for different substituents, one can either construct scans for each substituent or one can explore the possibility of introducing a minimal number of parameters to make rational changes to a base correction. For example, it is common for semiempirical models to use Gaussian functions to make adjustments to the core–core interactions, and one, too, could alter the pretabulated two-dimensional pucker corrections with two-dimensional Gaussians to adjust the location and height of maxima.
The proposed correction extends easily to higher-dimensional problems without introducing significant additional computational cost, which may be necessary to extend this method to 6- or 7-membered rings; however, a suitable reduced set of generalized coordinates would need to be identified to accurately describe the puckering correction or else the correction would require 3- or 4-dimensional tables of correction energies. The burden, in that case, is not the use of the correction but in obtaining the reference values that one desires from ab initio calculation.
Results and Discussion
Comparison of ab Initio Methods
Foloppe and MacKerell found that the structural and energetic properties of a nucleoside analog computed with MP2/6-31G(d) satisfactorally agreed with experimental results.21 Other works that have examined sugar ring conformations in full nucleosides and nucleoside analogues have therefore followed similar protocols.15−20,22 The largest basis sets used in those works have been MP2/6-311+G(d,p)//MP2/6-31G(d)19 and MP2/6-311++G(d,p)//B3LYP/6-31G(d,p),20 and ref (45) has recently used RI-MP2/cc-pVTZ//MP2/6-31+G(d). Our choice for using MP2/6-311++G(3df,2p)//MP2/6-31++G(d,p) is based on the success of all of the above cited works. To further validate our MP2 reference in light of the choices described above, we compare the stationary points of abasic nucleosides (dH and rH) in Table 2 to methods similar to those used in previous works and to CBS-QB3.51 In brief, the MP2 energies and geometries are not particularly sensitive to basis set, whereas the B3LYP geometries do show sensitivity to basis. We therefore find the MP2 geometries to be more reliable than the B3LYP geometries, and our MP2 energies should be of similar quality to those used in previous works.
Benchmark Data
The MP2 energy profiles of the DNA nucleosides shown in Figure 2 contain two minima: a global minimum C2′-endo (MIN2) conformation and a C3′-endo (MIN1) local minimum, which is on average 3.00 ± 0.18 kcal/mol higher in energy. The two minima are connected by two transition state pathways with average barrier heights of 4.40 ± 0.28 (TS1) and 4.96 ± 0.05 (TS2) kcal/mol. Both pathways are thus feasible but with only a small preference for the northern routes (TS1), which is in agreement with previous work.19 The unfavorability of the southern routes appear to originate from steric contact between the C4′ hydroxymethyl group and C1′ nucleobase within their transition state structures. The energy profiles of the pyrimidine nucleosides dC and dT are less unfavorable than the purine nucleosides dA and dG near Zx ≈ Zy ≈ 0, i.e., the area of small pucker amplitude. In other words, the dC and dT sugar rings can be more easily flattened, and it is for this reason that the dC and dT MP2 transition state pucker amplitudes in Table 3 are much smaller than the purine nucleosides.
The MP2 energy profiles of the RNA nucleosides shown in Figure 2 also contain C3′-endo (MIN1) and C2′-endo (MIN2) minima. However, unlike the DNA nucleosides, these minima are much closer in energy and separated by a single transition state. The conformational minima for the purine nucleosides are very similar (within 0.1 kcal/mol), whereas the pyrimidine nucleosides favor the C3′-endo (MIN1) conformation by around 0.9 kcal/mol. Canonical duplex A-form RNA has a C3′-endo sugar pucker, although it is widely known that RNA adopts a wide range of noncanonical secondary and tertiary structures. It should be emphasized that the sugar puckering profiles in the present work were generated using constraints on the orientation of the 2′-OH group so as to minimize intramolecular hydrogen bonding. It is known that these interactions have important effects on the conformational heterogeneity of RNA and have been recently characterized in other work.45 The purpose here is to generate benchmark data from which to derive correction potentials for systematic errors in the intrinsic ring puckering that will be used with models where the intramolecular hydrogen bonding will be accounted for explicitly.
The B3LYP energy profiles of the DNA and RNA nucleosides are in qualitative agreement with MP2, but the relative energies of the stationary points are noticeably different. The B3LYP energy barriers listed in Tables 3 and 4 are almost half those of MP2, which is consistent with previous findings.19
In previous work, the North and South minima of free nucleosides were examined19 to make comparison with experimental results;54−57 however, it was also noted that the free energy nucleoside potential energy surface is not representative of the puckers encountered in duplex DNA and RNA (except rC).17,19 Foloppe et al.19 therefore examined the effect of constraints on the relative energies between the North and South minima. The relative energies appearing in Table 3 of this work are larger than those reported in Table 3 of ref (19) because our choice of constraints were meant to mimic B-form DNA (and A-form RNA), whereas the North–South relative energies in ref (19) involve comparison to the minima observed in free nucleosides.
Uncorrected Semiempirical Methods
The agreement between the DFTB3 and ab initio DNA nucleoside energy profiles is poor. The two most striking features of DFTB3’s DNA profiles are the overall depth and flatness of the potential energy surface. The observed flatness of the DFTB3 pucker profile is in agreement with a previous study that applied DFTB methods to furanose ring systems.29 The average relative energy of the local minima is 3 to 5 times smaller than B3LYP and MP2, respectively, suggesting a lack of preference between the C2′-endo and C3′-endo conformations. Furthermore, the barriers for pseudorotation are only 1.30 ± 0.21 and 0.85 ± 0.11 kcal/mol for the northern and southern pathways, respectively. Not only are these barriers approximately 3.5 kcal/mol lower than the ab initio results, but the southern rather than the northern pseudorotation path is preferred. This is counter to steric arguments,58 previous ab initio computation,19,21,22 and our MP2 and B3LYP results. The DFTB3 RNA nucleoside profiles vaguely resemble B3LYP, but upon closer inspection, the pyrimidine nucleosides have only one minimum and thus lack a transition state. Similarly, the local minima in the RNA purine nucleosides are barely bound with an average depth of 0.14 ± 0.01 kcal/mol.
The AM1/d DNA nucleoside sugar rings are flat. It predicts only a single circular-shaped minimum for both RNA and DNA nucleosides. This behavior is presumably a symptom of AM1/d’s neglect of diatomic differential overlap. The enforcement of molecular orbital orthogonality constraints within the solution of the wave function would normally act to raise the electronic energy as atoms overlapped. Conversely, ignoring those constraints largely prevents steric distortions of the sugar ring. DFTB3 does enforce orthogonality constraints on the molecular orbitals, and one thus does observe structure in its potential energy surfaces. The poor quality of the DFTB3 structures and its overly flat pucker profile is likely caused by its use of a minimal valence atomic orbital basis.
Pucker-Corrected Semiempirical Methods
The MP2 potential energy surface is used to construct pucker-energy corrections Ecorr to the AM1/d and DFTB3 Hamiltonians. The potential energy surfaces of the corrected semiempirical methods upon reoptimizing their structures are shown in Figure 3, and 1D minimum potential energy paths are provided in the Supporting Information. The corrected semiempirical models do not exactly reproduce the MP2 results because each of the four DNA and four RNA nucleosides use the same average correction; however, the corrected methods agree with MP2 much more than even B3LYP. Table 5 summarizes the stationary point relative energies, torsion angles, and pseudorotation parameters of the corrected models, which are now in excellent agreement with MP2.
Table 5. Statistical Analysis of Relative Energies ΔE , ν1 and ν3 Torsions, and Pseudorotation Parameters Pθ and Ar Evaluated at Stationary Points (MIN1, MIN2, TS1, and TS2) Calculated with Corrected Semiempirical Methods and DFT Methodsa.
| DFTB3+Ecorr |
AM1/d+Ecorr |
B3LYP |
|||||||
|---|---|---|---|---|---|---|---|---|---|
| n | mse | mue | n | mse | mue | n | mse | mue | |
| ΔE (kcal/mol) | 28 | –0.09 | 0.23 | 28 | –0.01 | 0.16 | 26 | –1.04 | 1.13 |
| ν1,ν3 (deg) | 56 | 0.38 | 2.01 | 56 | 0.77 | 2.38 | 52 | –0.84 | 4.24 |
| Pθ (deg) | 26 | 1.68 | 4.83 | 26 | 1.94 | 5.30 | 25 | –0.97 | 9.13 |
| Ar (deg) | 28 | 1.50 | 1.51 | 28 | 1.77 | 1.85 | 26 | –1.60 | 2.56 |
“n” is the number of points used to generate the statistics. The phase angles of TS2 of pyrimidine deoxyribonucleosides are not included in the statistics because when their amplitudes of puckering are very small, these phase angles are sensitive to perturbation.
Figures 4 and 5 display the corrected and uncorrected AM1/d and DFTB3 deoxycytidine stationary structures superimposed on to the MP2 structures, respectively. The corrected structures are in such good agreement with MP2 that it is difficult to distinguish between them in the figures.
Figure 4.
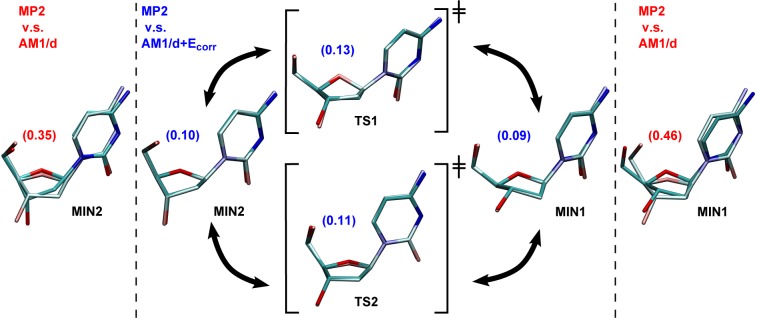
Superimposed geometries of MIN and TS of deoxycytidine optimized using MP2 (dull) and AM1/d (shiny) with and without sugar pucker correction. The RMS values (Å) from heavy atom alignment are shown in red within the parentheses.
Figure 5.
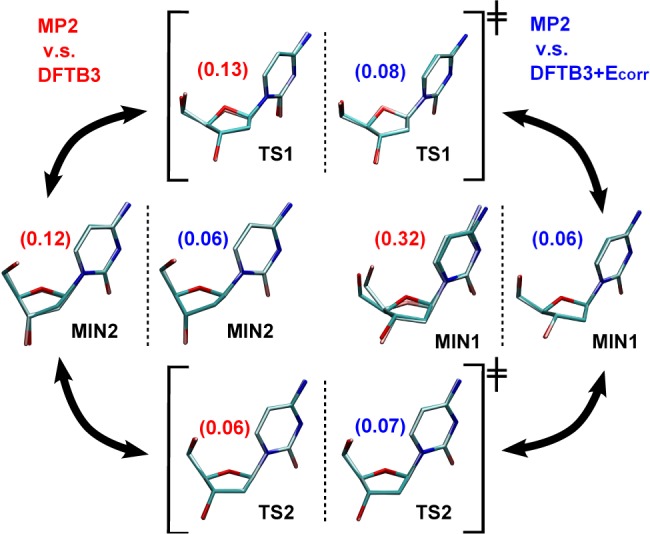
Superimposed geometries of MIN and TS of deoxycytidine optimized using MP2 (dull) and DFTB3 (shiny) with and without sugar pucker correction. The RMS values (Å) from heavy atom alignment are shown in the parentheses.
In this work, we provided benchmark gas phase ab initio potential energy surfaces and described a method for correcting semiempirical models to reproduce benchmark data. Whether the gas phase ab initio potential energy surface or the Amber potential energy surface are a more appropriate reference for correcting the semiempirical models in condensed phase environments remains an open question to be resolved in future work. The most appropriate correction depends on the manner in which it is used. For condensed phase simulations, the appropriate reference may not result from gas phase scans at all; instead, it may be sought by reproducing the two-dimensional pucker free energy profile computed from simulation.59 In this case, one must resort to the use of MM methods to obtain the reference free energy profile because a MP2 or B3LYP simulation would be prohbitively slow. Furthermore, one may also prefer to use the MM Hamiltonian as the reference if the corrected semiempirical model is specifically used within the QM/MM simulation so that the semiempirical model is made consistent with the remainder of the system. The use of a MP2 ab initio reference in the present work is for the application of corrected semiempirical models to small molecules in the gas phase.
Conclusion
We performed benchmark 2D potential energy scans of sugar pseudorotations of DNA and RNA nucleosides with MP2 and B3LYP and compared those results with the AM1/d and DFTB3-mio semiempirical Hamiltonians. The semiempirical models poorly reproduced the ab initio pseudorotation energy profiles. AM1/d sugar rings have only one stable conformation corresponding to a nearly flat ring. The AM1/d surfaces resemble 2D parabola as opposed to having the rich features found in the ab initio surfaces. DFTB3-mio correctly produces two stable DNA nucleoside sugar pucker conformations, but the pseudorotation barrier between them is greatly underestimated. Furthermore, DFTB3-mio incorrectly predicts that the southern pseudorotation pathway is preferred. Like AM1/d, DFTB3-mio exhibits only one stable RNA nucleoside sugar pucker conformation, but their potential energy surfaces resemble the features produced by the ab initio methods only vaguely. The failure of semiempirical methods at reproducing sugar ring pucker is attributed to the use of a minimal basis set, which for the case of AM1/d is exacerbated by the neglect of diatomic differential overlap.
We presented a method for correcting semiempirical methods by introducing a pucker correction computed from Cardinal B-spline interpolation of pretabulated values. The correction has smooth energies and forces and is a nonelectronic term not coupled with the SCF procedure, thus avoiding the need to complicate the underlying electronic structure calculation. The corrected semiempirical models were shown to well reproduce the ab initio potential energy surfaces, barriers of pseudorotation, and stationary point geometries. The pucker correction introduced in this work will be useful in the modeling RNA and DNA in condensed phase using QM/MM simulation with semiempirical QM methods.
Acknowledgments
The authors are grateful for financial support provided by the National Institutes of Health (GM62248). Computational resources from the Minnesota Supercomputing Institute for Advanced Computational Research (MSI) were utilized in this work. This work used the Extreme Science and Engineering Discovery Environment (XSEDE), which is supported by National Science Foundation grant number OCI-1053575.
Supporting Information Available
Provided are a review of methods used to describe sugar pucker conformations; additional 2D contours; 1D minimum energy paths and associated pseudorotation amplitudes of sugar nucleoside pseudorotation; tables of the pseudorotation phases, pucker amplitudes, and relative energies of nucleosides stationary geometries; and tables of nucleoside pucker corrections. An extended discussion of basis set effects between 6-31++G(d,p) and 6-311++G(3df,2p) is provided. Nucleoside analogues are analyzed and compared with canonical nucleosides. Computer codes in C++, Fortran, and Python that demonstrate how to implement the correction using B-splines is freely available at http://theory.rutgers.edu. This material is available free of charge via the Internet at http://pubs.acs.org.
The authors declare no competing financial interest.
Funding Statement
National Institutes of Health, United States
Supplementary Material
References
- Varki A., Cummings R. D., Esko J. D., Freeze H. H., Stanley P., Bertozzi C. R., Hart G. W.,, Etzler M. E., Eds.; Essentials of Glycobiolog, 2nd ed.; Cold Spring Harbo: New York, 2009; Chapter 1, pp 1–22. [PubMed] [Google Scholar]
- Taha H. A.; Richards M. R.; Lowary T. L. Chem. Rev. 2013, 113, 1851–1876. [DOI] [PubMed] [Google Scholar]
- Sattelle B. M.; Hansen S. U.; Gardiner J.; Almond A. J. Am. Chem. Soc. 2010, 132, 13132–13134. [DOI] [PubMed] [Google Scholar]
- Saenger W.Principles of Nucleic Acid Structure; Springer-Verlag: New York, 1984; Chapter 2,4, pp 9–28, 51–104. [Google Scholar]
- Bloomfield V. A.; Crothers D. M.; Tinoco I. Jr.. Nucleic Acids: Structures, Properties, and Functions; University Science Books: Sausalito, CA, 2000; Chapter 2,5, pp 13–44, 111–164. [Google Scholar]
- Rich A. Nat. Struct. Biol. 2003, 10, 247–249. [DOI] [PubMed] [Google Scholar]
- Noy A.; Pérez A.; Laughton C. A.; Orozco M. Nucleic Acids Res. 2007, 35, 3330–3338. [DOI] [PMC free article] [PubMed] [Google Scholar]
- Rana T. M. Nat. Rev. Mol. Cell Biol. 2007, 8, 23–36. [DOI] [PubMed] [Google Scholar]
- Williamson J. R. Nat. Struct. Biol. 2000, 7, 834–837. [DOI] [PubMed] [Google Scholar]
- Leulliot N.; Varani G. Biochemistry 2001, 40, 7947–7956. [DOI] [PubMed] [Google Scholar]
- Torres R. A.; Bruice T. C. J. Am. Chem. Soc. 2000, 122, 781–791. [Google Scholar]
- Werner R. M.; Stivers J. T. Biochemistry 2000, 39, 14054–14064. [DOI] [PubMed] [Google Scholar]
- Julien K. R.; Sumita M.; Chen P.-H.; Laird-Offringa I. A.; Hoogstraten C. G. RNA 2008, 14, 1632–1643. [DOI] [PMC free article] [PubMed] [Google Scholar]
- Zhang N.; Zhang S.; Szostak J. W. J. Am. Chem. Soc. 2012, 134, 3691–3694. [DOI] [PMC free article] [PubMed] [Google Scholar]
- Foloppe N.; MacKerell A. D. Jr. Biophys. J. 1999, 76, 3206–3218. [DOI] [PMC free article] [PubMed] [Google Scholar]
- Leulliot N.; Ghomi M.; Scalmani G.; Berthier G. J. Phys. Chem. A 1999, 103, 8716–8724. [Google Scholar]
- Hocquet A.; Leulliot N.; Ghomi M. J. Phys. Chem. B 2000, 104, 4560–4568. [Google Scholar]
- Shishkin O.; Pelmenschikov A.; Hovorun D.; Leszczynski J. J. Mol. Struct. 2000, 526, 329–341. [Google Scholar]
- Foloppe N.; Nilsson L.; MacKerell A. D. Jr. Biopolymers (Nucleic Acid Sciences) 2002, 61, 61–76. [DOI] [PubMed] [Google Scholar]
- Yurenko Y. P.; Zhurakivsky R. O.; Ghomi M.; Samijlenko S. P.; Hovorun D. M. J. Phys. Chem. B 2008, 112, 1240–1250. [DOI] [PubMed] [Google Scholar]
- Foloppe N.; MacKerell A. D. Jr. J. Phys. Chem. B 1998, 102, 6669–6678. [Google Scholar]
- Brameld K. A.; G. W. A. III J. Am. Chem. Soc. 1999, 121, 985–993. [Google Scholar]
- Nam K.; Gao J.; York D. M. J. Am. Chem. Soc. 2008, 130, 4680–4691. [DOI] [PMC free article] [PubMed] [Google Scholar]
- Nam K.; Gao J.; York D. M. In Multiscale Simulation Methods for Nanomaterials; Ross R. B., Mohanty S. S., Eds.; John Wiley & Sons, Inc., 2008; pp 201–218. [Google Scholar]
- York D. M., Lee T.-S., Eds.; Multiscale Quantum Models for Biocatalysis: Modern Techniques and Applications; Challenges and Advances in Computational Chemistry and Physics; Springer: New York, 2009; Chapter 1–10, pp 3–257. [Google Scholar]
- Wong K.-Y.; Lee T.-S.; York D. M. J. Chem. Theory Comput. 2011, 7, 1–3. [DOI] [PMC free article] [PubMed] [Google Scholar]
- Sattelle B. M.; Almond A. J. Comput. Chem. 2010, 31, 2932–2947. [DOI] [PubMed] [Google Scholar]
- Barnett C. B.; Naidoo K. J. J. Phys. Chem. B 2010, 114, 17142–17154. [DOI] [PubMed] [Google Scholar]
- Islam S. M.; Roy P.-N. J. Chem. Theory Comput. 2012, 8, 2412–2423. [DOI] [PubMed] [Google Scholar]
- Kolb M.Ein neues semiempirisches Verfahren auf Grundlage der NDDO-Näherung: Entwicklung der Methode, Parametrisierung und Anwendungen. Ph.D. Thesis, Universität Wuppertal: Wuppertal, Germany, 1991. [Google Scholar]
- Kolb M.; Thiel W. J. Comput. Chem. 1993, 14, 775–789. [Google Scholar]
- Weber W.Ein neues semiempirisches NDDO-Verfahren mit Orthogonalisierungskorrekturen: Entwicklung des Modells, Implementierung, Parametrisierung und Anwendungen. Ph.D. Thesis, Universität Zürich: Zürich, Switzerland, 1996. [Google Scholar]
- Weber W.; Thiel W. Theor. Chem. Acc. 2000, 103, 495–506. [Google Scholar]
- Scholten M.Semiempirische Verfahren mit Orthogonalisierungskorrekturen: Die OM3 Methode. Ph.D. Thesis, Universität Düsseldorf: Düsseldorf, Germany, 2003. [Google Scholar]
- Nam K.; Cui Q.; Gao J.; York D. M. J. Chem. Theory Comput. 2007, 3, 486–504. [DOI] [PubMed] [Google Scholar]
- Gaus M.; Goez A.; Elstner M. J. Chem. Theory Comput. 2013, 9, 338–354. [DOI] [PubMed] [Google Scholar]
- Kilpatrick J. E.; Pitzer K. S.; Spitzer R. J. Am. Chem. Soc. 1947, 69, 2483–2488. [DOI] [PubMed] [Google Scholar]
- Geise H. J.; Altona C.; Romers C. Tetrahedron Lett. 1967, 8, 1383–1386. [DOI] [PubMed] [Google Scholar]
- Altona C.; Sundaralingam M. J. Am. Chem. Soc. 1972, 94, 8205–8212. [DOI] [PubMed] [Google Scholar]
- Cremer D.; Pople J. A. J. Am. Chem. Soc. 1975, 97, 1354–1358. [Google Scholar]
- S. T. Rao E. W.; Sundaralingam M. Acta Cryst. A 1981, 37, 421–425. [Google Scholar]
- Sato T. Nucleic Acids Res. 1983, 11, 4933–4938. [DOI] [PMC free article] [PubMed] [Google Scholar]
- Hill A. D.; Reilly P. J. J. Chem. Inf. Model. 2007, 47, 1031–1035. [DOI] [PubMed] [Google Scholar]
- Case D. A.; Darden T. A.; Cheatham T. E. III; Simmerling C. L.; Wang J.; Duke R. E.; Luo R.; Walker R. C.; Zhang W.; Merz K. M.; Roberts B.; Hayik S.; Roitberg A.; Seabra G.; Swails J.; Götz A. W.; Kolossváry I.; Wong K. F.; Paesani F.; Vanicek J.; Wolf R. M.; Liu J.; Wu X.; Brozell S. R.; Steinbrecher T.; Gohlke H.; Cai Q.; Ye X.; Wang J.; Hsieh M.-J.; Cui G.; Roe D. R.; Mathews D. H.; Seetin M. G.; Salomon-Ferrer C.; Sagui R.; Babin V.; Luchko T.; Gusarov S.; Kovalenko A.; Kollman P. A.. AMBER 12; University of California, San Francisco: San Francisco, CA, 2012. [Google Scholar]
- Denning E. J.; MacKerell A. D. Jr. J. Am. Chem. Soc. 2012, 134, 2800–2806. [DOI] [PMC free article] [PubMed] [Google Scholar]
- Frisch M. J.; Trucks G. W.; Schlegel H. B.; Scuseria G. E.; Robb M. A.; Cheeseman J. R.; Scalmani G.; Barone V.; Mennucci B.; Petersson G. A.; Nakatsuji H.; Caricato M.; Li X.; Hratchian H. P.; Izmaylov A. F.; Bloino J.; Zheng G.; Sonnenberg J. L.; Hada M.; Ehara M.; Toyota K.; Fukuda R.; Hasegawa J.; Ishida M.; Nakajima T.; Honda Y.; Kitao O.; Nakai H.; T. V.; Montgomery J. A. Jr.; Peralta J. E.; Ogliaro F.; Bearpark M.; Heyd J. J.; Brothers E.; Kudin K. N.; Staroverov V. N.; Kobayashi R.; Normand J.; Raghavachari K.; Rendell A.; Burant J. C.; Iyengar S. S.; Tomasi J.; Cossi M.; Rega N.; Millam J. M.; Klene M.; Knox J. E.; Cross J. B.; Bakken V.; Adamo C.; Jaramillo J.; Gomperts R.; Stratmann R. E.; Yazyev O.; Austin A. J.; Cammi R.; Pomelli C.; Ochterski J. W.; Martin R. L.; Morokuma K.; Zakrzewski V. G.; Voth G. A.; Salvador P.; Dannenberg J. J.; Dapprich S.; Daniels A. D.; Farkas O.; Foresman J. B.; Ortiz J. V.; Cioslowski J.; Fox D. J.. Gaussian 09, Revision A.02. Gaussian, Inc.: Wallingford, CT, 2009. [Google Scholar]
- Stewart J. J. P. J. Mol. Model. 2007, 13, 1173–1213. [DOI] [PMC free article] [PubMed] [Google Scholar]
- Elstner M.; Porezag D.; Jungnickel G.; Elsner J.; Haugk M.; Frauenheim T.; Suhai S.; Seifert G. Phys. Rev. B 1998, 58, 7260–7268. [Google Scholar]
- Gaus M.; Cui Q.; Elstner M. J. Chem. Theory Comput. 2011, 7, 931–948. [DOI] [PMC free article] [PubMed] [Google Scholar]
- Henkelman G.; Uberuaga B. P.; Hannes Jónsson J. Chem. Phys. 2000, 113, 9901–9904. [Google Scholar]
- Montgomery J. A. Jr.; Frisch M. J.; Ochterski J. W.; Petersson G. A. J. Chem. Phys. 2000, 112, 6532–6542. [Google Scholar]
- Essmann U.; Perera L.; Berkowitz M. L.; Darden T.; Hsing L.; Pedersen L. G. J. Chem. Phys. 1995, 103, 8577–8593. [Google Scholar]
- Darden T. A.; Toukmaji A.; Pedersen L. G. J. Chim. Phys. 1997, 94, 1346. [Google Scholar]
- Gelbin A.; Schneider B.; Clowney L.; Hsieh S.-H.; Olson W. K.; Berman H. M. J. Am. Chem. Soc. 1996, 118, 519–529. [Google Scholar]
- Davies D. B. Prog. Nucl. Magn. Reson. Spectrosc. 1978, 12, 135–225. [Google Scholar]
- Plavec J.; Thibaudeau C.; Chattopadhyaya J. Pure Appl. Chem. 1996, 68, 2137–2144. [Google Scholar]
- Altona C.; Sundaralingam M. J. Am. Chem. Soc. 1973, 95, 2333–2344. [DOI] [PubMed] [Google Scholar]
- Saenger W.Principles of Nucleic Acid Structure; Springer-Verlag: New York, 1984. [Google Scholar]
- Islam S. M.; Richards M. R.; Taha H. A.; Byrns S. C.; Lowary T. L.; Roy P.-N. J. Chem. Theory Comput. 2011, 7, 2989–3000. [DOI] [PubMed] [Google Scholar]
Associated Data
This section collects any data citations, data availability statements, or supplementary materials included in this article.