

Abstract
Infections caused by hard-to-treat methicillin-resistant Staphylococcus aureus (MRSA) are a serious global public-health concern, as MRSA has become broadly resistant to many classes of antibiotics. We disclose herein the discovery of a new class of non-β-lactam antibiotics, the oxadiazoles, which inhibit penicillin-binding protein 2a (PBP2a) of MRSA. The oxadiazoles show bactericidal activity against vancomycin- and linezolid-resistant MRSA and other Gram-positive bacterial strains, in vivo efficacy in a mouse model of infection, and have 100% oral bioavailability.
Introduction
Methicillin-resistant Staphylococcus aureus (MRSA) is a global public-health problem that results in 278,000 hospitalizations1 and 19,000 deaths2 annually in the United States alone. MRSA infections have been increasing from 2% of S. aureus infections in intensive care units in 1974 to 64% in 2004,3 although more recent data report stabilization of these cases.4,5 Over the years, β-lactams were antibiotics of choice for treatment of S. aureus infections. However, these agents faced obsolescence with the emergence of MRSA in the early 1960s.6 Presently, the only effective agents for treatment of MRSA infections are vancomycin, daptomycin, and linezolid,7 although only linezolid can be dosed orally.8 Resistance to all three has emerged.9−13 Thus, new anti-MRSA therapeutic strategies are needed, especially agents that are orally bioavailable.14
Clinical resistance to β-lactam antibiotics by MRSA has its basis in the acquisition of the mecA gene,15 which encodes penicillin-binding protein 2a (PBP2a), a cell-wall dd-transpeptidase.16,17Staphylococcus aureus normally produces four PBPs,18 which are susceptible to inhibition by β-lactam antibiotics. These antibiotics irreversibly acylate the active-site serine of PBPs, which deprives bacteria of their biosynthetic functions and results in bacterial death. In contrast, PBP2a is refractory to inhibition by essentially all commercially available β-lactams.17 Thus, novel antibiotics that inhibit PBP2a, among other PBPs, are highly sought. It is worth mentioning that the structures of essentially all PBPs are highly similar to each other within the active sites.19 Inhibition by β-lactam antibiotics results in incapacitation of multiple PBPs in the same organism, which is believed to be a reason for the effectiveness of β-lactams.20,21
In this study, we report on the oxadiazoles as a new class of non-β-lactam antibiotics, which was discovered from in silico screening. Lead optimization, in vitro, and in vivo evaluation resulted in antibiotics with Gram-positive activity and excellent oral bioavailability. We investigated the mechanism of action of the oxadiazoles and found that they inhibit PBP2a of MRSA and the biosynthesis of cell wall.
Results and Discussion
In Silico Screening and Determination of Minimal-Inhibitory Concentrations (MICs)
We screened in silico 1.2 million compounds from the ZINC database22 individually complexed to the X-ray structure of PBP2a of MRSA23 as potential inhibitors. The resulting complexes were scored using a combination consensus score of four scoring methods, Dock, Gold, FlexX, and ChemScore, and 50 top-scoring compounds were selected for further analysis. Of these compounds, 29 were either synthesized or purchased and tested for antibacterial activity against Escherichia coli and a collection of ESKAPE bacteria (Enterococcus faecium, Staphylococcus aureus, Klebsiella pneumoniae, Acinetobacter baumannii, Pseudomonas aeruginosa, and Enterobacter species(24)), which cause the majority of nosocomial infections. Compound 1 exhibiting poor but reproducible MIC against S. aureus and E. faecium emerged from this screening (Figure 1).
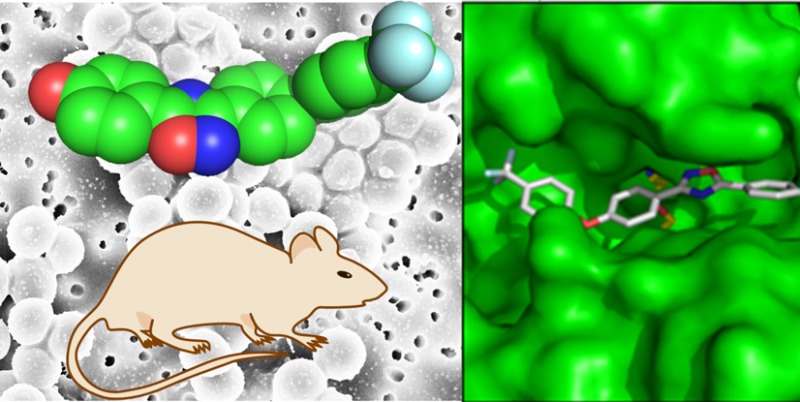
Figure 1.

The X-ray structure of the S. aureus PBP 2a (left) is shown as a solvent-accessible Connolly surface in green. The close up of the active site (at one o’clock) is depicted in stereo, showing the fitting of compound 1 in the pose predicted by the program DOCK. Inhibitor color scheme: oxygen (red), nitrogen (blue), carbon (gray), and fluorine (aqua).
Syntheses of Leads and In Vitro Evaluation
We synthesized in solution a library of 370 variants of compound 1 (Scheme 1), which was screened against the same panel of clinically important microorganisms. Antibiotics 2–4 emerged from this screening with excellent antibacterial activities against S. aureus (including MRSA) and vancomycin-resistant E. faecium (VRE; Table 1). The MIC values did not change with increasing bacterial load, indicating that there was no innoculum effect on the MIC. We also determined the minimal-bactericidal concentrations (MBCs), which were in these cases the same as the MIC values, indicating that the compounds were bactericidal at concentrations at which they manifested the antibacterial activity. We also note that the antibacterial activity against the various Gram-positive bacteria in Table 1 indicates that other PBPs are likely inhibited by oxadiazoles, as not all express PBP2a, which was used in the in silico discovery phase of the work.
Scheme 1. Synthetic Approach to the Preparation of the Oxadiazoles.

Table 1. Minimal-Inhibitory Concentrations (MICs) of Oxadiazolesa.
| MIC
(μg/mL) |
|||||
|---|---|---|---|---|---|
| microorganism | 2 | 3 | 4 | vancomycin | linezolid |
| S. aureus ATCC 29213b | 2 | 2 | 2 | 1 | 4 |
| S. aureus ATCC 27660c | 2 | 2 | 2 | 1 | 2 |
| S. aureus NRS100 (COL)c | 2 | 2 | 2 | 2 | 2 |
| S. aureus NRS119d | 2 | 2 | 2 | 2 | 32 |
| S. aureus NRS120d | 2 | 2 | 2 | 2 | 32 |
| S. aureus VRS1e | 2 | 2 | 2 | 512 | 2 |
| S. aureus VRS2f | 2 | 2 | 2 | 64 | 2 |
| S. epidermis ATCC 35547 | 2 | 2 | 2 | 16 | 1 |
| S. hemolyticus ATCC 29970 | 2 | 2 | 4 | 2 | 2 |
| S. oralis ATCC 9811 | 32 | 32 | 32 | 0.5 | 1 |
| S. pyogenes ATCC 49399 | 32 | >32 | 32 | 0.6 | 1 |
| B. cereus ATCC 13061 | 2 | 2 | 4 | 1 | 1 |
| B. licheniformis ATCC 12759 | 2 | 2 | 2 | 0.5 | 1 |
| E. faecalis ATCC 29212b | 2 | 2 | 2 | 2 | 2 |
| E. faecalis 201 (Van S)g | 2 | 2 | >32 | 1 | 2 |
| E. faecalis 99 (Van R)h | 2 | 2 | 2 | 128 | 1 |
| E. faecium 119–39A (Van S)g | 1 | 1 | 1 | 0.5 | 2 |
| E. faecium 106 (Van R)h | 2 | 2 | 2 | 256 | 1 |
| E. faecium NCTC 7171 | 1 | 2 | 2 | 0.5 | 2 |
Whereas the compounds were screened against E. coli and the ESKAPE panel of bacteria, they exhibited antibacterial activity only against Gram-positive bacteria.
A quality-control strain to monitor accuracy of MIC testing.
mecA positive, resistant to methicillin, oxacillin, and tetracycline; susceptible to vancomycin and linezolid.
mecA positive, resistant to ciprofloxacin, gentamicin, oxacillin, penicillin, and linezolid.
Vancomycin-resistant MRSA (vanA) clinical isolate from Michigan.
Vancomycin-resistant MRSA (vanA) clinical isolate from Pennsylvania.
Vancomycin-susceptible clinical isolate.
Vancomycin-resistant clinical isolate.
Compounds 2–4 were evaluated for in vitro toxicity in the hemolysis and XTT cell viability assays. Compounds 2 and 3 caused 3% hemolysis of red blood cells at 64 μg/mL (32-fold above the MIC), and compound 4 was not hemolytic at all. The compounds were metabolically stable in rat liver S9 (phase I and phase II metabolism), with 100% of the parent compound remaining unchanged after a 60-min incubation.
In Vivo Studies
The pharmacokinetic (PK) properties of compounds 2–4 were evaluated in mice (Figure 2 and Table 2). After a single intravenous (iv) dose of compound 2 at 50 mg/kg, the area under the concentration–time curve (AUC) was 1,380 μg·min/mL. Compound 2 had moderate clearance of 36.2 mL/min/kg, a large volume of distribution, and a terminal half-life of 4.4 h. In contrast, compound 3 had 2-fold higher systemic exposure of 2650 μg·min/mL, lower clearance of 18.9 mL/min/kg, a moderate volume of distribution, and a terminal half-life of 22 h. Compound 4 had 3.5-fold higher systemic exposure than compound 3, low clearance of 5.4 mL/min/kg, a large volume of distribution, and a terminal half-life of 20 h. The better PK properties for antibiotics 3 and 4 were anticipated to result in higher in vivo efficacy compared to antibiotic 2. Furthermore, both antibiotics 3 and 4 exhibited 100% oral bioavailability, indicating that the compounds can be administered orally.
Figure 2.

Pharmacokinetics of the oxadiazoles after single iv and po administration at 50 mg/kg to mice (n = 3 per time point); (a) antibiotic 2, (b) antibiotic 3, and (c) antibiotic 4.
Table 2. Pharmacokinetic Parameters of Oxadiazolesa.
| cmpd | dose (mg/kg) | AUC0–∞ (μg·min/mL) | Cmax (μg/mL) | Tmax (h) | CL (mL/min/kg) | Vd (mL/kg) | t1/2 | F (%) |
|---|---|---|---|---|---|---|---|---|
| 2 | 50 iv | 1380 | 36.2 | 860 | t1/2α = 2.4 min | |||
| t1/2β = 4.4 h | ||||||||
| 3 | 50 iv | 2650 | 18.9 | 370 | t1/2α = 3.5 min | |||
| t1/2β = 22 h | ||||||||
| 50 po | 2620 | 2.5 | 2 | t1/2abs = 3.3 h | ∼100 | |||
| t1/2dist = 6.0 h | ||||||||
| t1/2elim = 40 h | ||||||||
| 4 | 50 iv | 9200 | 5.4 | 720 | t1/2α = 6.7 min | |||
| t1/2β = 20 h | ||||||||
| 50 po | 9220 | 10.0 | 2 | t1/2abs = 2.4 h | 100 | |||
| t1/2dist = 13 h | ||||||||
| t1/2elim = 36 h |
n = 3 mice per time point per route of administration; 10–12 time points. AUC0–∞, area under the plasma concentration–time curve from 0 to infinity; Cmax, maximum concentration observed in plasma; Tmax, time at which maximum plasma concentration is observed; CL, plasma clearance; Vd, volume of distribution; t1/2α, initial half-life; t1/2β, terminal half-life; t1/2abs, absorption half-life; t1/2dist, distribution half-life; t1/2elim, elimination half-life; F, oral bioavailability.
Antibiotics 3 and 4 were evaluated in the mouse peritonitis infection model using iv or oral (po) routes of administration. While both compounds had the same efficacy after iv administration, antibiotic 3 had superior efficacy following po dosing. This was attributed to the shorter distribution half-life of antibiotic 3 compared to that of 4, which suggested that 3 would distribute to the site of infection faster than 4. Since antibiotic 3 had superior efficacy, a dose response curve against MRSA peritonitis model was determined. The median effective dose (ED50) of antibiotic 3 after iv administration was 40 mg/kg and that after po administration was 44 mg/kg, consistent with the high oral bioavailability of the antibiotic.
Mechanism of Action
The mode of action of compound 3 was investigated using macromolecular synthesis assays,25 which monitor incorporation of radiolabeled precursors—[methyl-3H]-thymidine, [5-3H]-uridine, l-[4,5-3H]-leucine, or d-[2,3-3H]-alanine—into DNA, RNA, protein, or peptidoglycan, respectively, of S. aureus in the logarithmic phase of growth. Inhibition of radioactive-precursor incorporation by antibiotic 3 was compared to that by known antibiotics for the given biosynthetic pathways (ciprofloxacin, rifampicin, tetracycline, and fosfomycin, respectively, Figure 3). As expected for an inhibitor of PBPs, antibiotic 3 inhibited peptidoglycan synthesis, but did not inhibit transcription, translation, or replication (DNA synthesis). The in vivo inhibition studies of transcription and translation by 3 were followed up by in vitro assays for the two processes. We utilized a T7 polymerase transcription assay for the dacB gene encoding E. coli PBP4. The intensities of the bands for the dacB mRNA were studied in the presence and in the absence of antibiotic 3 (Figure 4). There was no effect by antibiotic 3 on this assay. We further utilized an in vitro assay that evaluated a coupled transcription and translation system that resulted in the formation of β-galactosidase, the levels of which could be assayed by a chromogenic substrate. The presence of compound 3 at concentrations of up to 160 μg/mL (80-fold above the MIC) had no effect on this assay (Figure 4). These assays collectively support the assertion that antibiotic 3 inhibits the biosynthetic process of the cell wall.
Figure 3.

Effect of antibiotic 3 on macromolecular biosynthesis assays, measuring the incorporation of radiolabeled precursors into (a) peptidoglycan, (b) protein, (c) RNA, and (d) DNA, compared to known antibiotic inhibitors of the same pathways.
Figure 4.
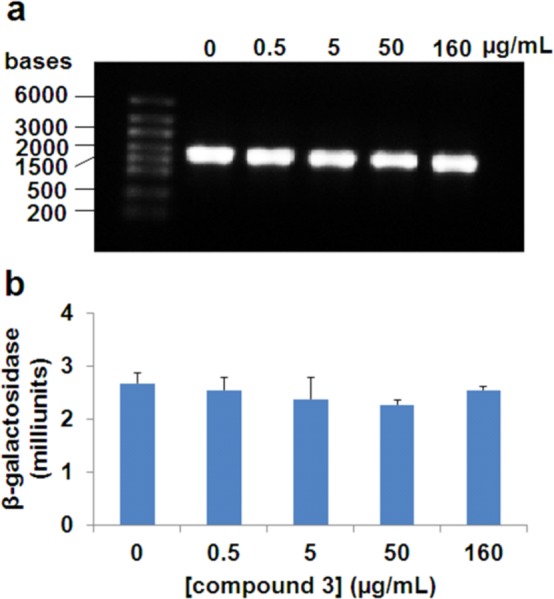
(a) In vitro transcription assay for levels of dacB in the presence of compound 3. (b) In vitro transcription/translation assay for β-galactosidase expression levels in the presence of compound 3.
Inhibition of purified recombinant PBP2a by the oxadiazoles was investigated next. The gene for PBP2a was cloned from a strain of MRSA and was purified to homogeneity in our laboratories.26 We utilized a continuous spectrophotometric assay of PBP2a inhibition, using the chromogenic cephalosporin nitrocefin as a reporter molecule. As nitrocefin modifies the active-site serine of PBP2a, it generates a chromophore, which can be monitored in inhibition assays. Antibiotics 2 and 3, with MIC values of 1–2 μg/mL, inhibited PBP2a with IC50 values of 4 μg/mL and 8 μg/mL, respectively. Similar results were obtained in a noncontinuous PBP2a binding assay using the fluorescent penicillin BOCILLIN-FL. These data indicated that the oxadiazoles inhibit the recombinant PBP2a close to the respective values for the MICs. The small difference might be due to the absence of the membrane environment, where PBP2a is anchored. Our repeated trials to date in obtaining X-ray structures of the complexes of the oxadiazoles bound to PBP2a have not borne fruit.
Conclusion
In summary, we have described here the discovery of a class of non-β-lactam bactericidal antibiotics active against Gram-positive bacteria with in vivo efficacy and 100% oral bioavailability. The oxadiazoles inhibit PBP2a (and likely other related PBPs), an important enzyme in cell-wall biosynthesis. As such, the oxadiazoles hold promise in treatment of MRSA infections.
Experimental Section
General
Organic reagents, solvents, penicillin–streptomycin, nonessential amino acids, l-glutamine, trypan blue, and XTT kits were purchased from Sigma-Aldrich Chemical Co. (St. Louis, MO, U.S.A.). 1H and 13C NMR spectra were acquired on a Varian INOVA-500 (Varian, Inc., Palo Alto, CA, U.S.A.). High-resolution mass spectra were obtained on a JEOL AX505HA mass spectrometer (Tokyo, Japan) by FAB ionization or on a Bruker micrOTOF/Q2 mass spectrometer (Bruker Daltonik, Bremen, Germany) by ESI ionization. Fetal bovine serum (Gibco), Dulbecco’s Modified Eagle’s Medium (Gibco), and Dulbecco’s phosphate-buffered saline were purchased from Invitrogen (Grand Island, NY, U.S.A.).
4-(4-(Trifluoromethyl)phenoxy)benzonitrile (5a)
A solution of anhydrous trifluoro-p-cresol (531 mg, 3.27 mmol), copper(I) iodide (83 mg, 0.4 mmol), cesium carbonate (1.42 g, 4.36 mmol), 4-iodobenzonitrile (500 mg, 2.18 mmol) and N,N-dimethylglycine hydrochloride (91 mg, 0.65 mmol) in degassed 1,4-dioxane (10.0 mL) was heated at 90 °C for 140 h under an atmosphere of nitrogen. The mixture was cooled, and it was partitioned between ethyl acetate (50 mL) and water (50 mL). The organic layer was separated, and the aqueous layer was extracted with ethyl acetate (2 × 50 mL). The combined organic layer was washed with brine (100 mL) and dried over Na2SO4. The solution was concentrated in vacuo. The resultant oil was purified by silica gel chromatography (CH2Cl2/hexanes, 1:8 to 1:4) The product was recrystallized from hot hexane to give the title compound as a white solid (286 mg, 50%). 1H NMR (500 MHz, CDCl3): δ (ppm): 7.08 (d, J = 8.4 Hz, 1H), 7.15 (d, J = 8.8 Hz, 1H), 7.66 (d, J = 8.4 Hz, 1H), 7.67 (d, J = 8.8 Hz, 1H). 13C NMR (125 MHz, CDCl3): δ (ppm): 107.1, 118.7, 119.1 (CH), 120.0 (CH), 124.0 (q, J = 272.0 Hz, C), 127.0 (q, J = 32.5 Hz, C), 127.3, 127.8 (q, J = 3.8 Hz, CH), 134.5 (CH), 158.2, 160.4. 19F NMR (282 MHz, CDCl3): δ (ppm): −62.05 (s, 3F). MS (m/z): (FAB+) [MH]+ 264. HRMS (m/z): [MH]+ calcd for C14H8F3NO, 264.0636; found, 264.0621.
4-Phenoxybenzonitrile (5b)
A solution of phenol (1.23 g, 13.10 mmol), copper(I) iodide (333 mg, 1.75 mmol), cesium carbonate (5.69 g, 17.47 mmol), 4-iodobenzonitrile (2.00 g, 8.73 mmol), and N,N-dimethylglycine hydrochloride (366 mg, 2.62 mmol) in degassed 1,4-dioxane (35 mL) was stirred at 90 °C for 88 h under an atmosphere of nitrogen. The mixture was cooled and then was partitioned between ethyl acetate (100 mL) and water (100 mL). The organic layer was separated, and the aqueous layer was washed with ethyl acetate (2 × 100 mL). The combined organic layers were washed with brine (100 mL), dried over anhydrous Na2SO4, and concentrated in vacuo. The crude material was purified by column chromatography on silica gel (EtOAc/hexanes, 1:12 to 1:8) to give the title compound as a white solid (1.70 g, 100%). 1H NMR (300 MHz, CDCl3): δ (ppm): 7.00 (d, J = 9.1 Hz, 2H), 7.06 (d, J = 7.6 Hz, 2H), 7.23 (t, J = 7.2 Hz, 1H), 7.41 (t, J = 8.1 Hz, 2H), 7.59 (d, J = 9.1 Hz, 2H). 13C NMR (75 MHz, CDCl3): δ (ppm): 105.9, 118.0 (CH), 119.0, 120.5 (CH), 125.3 (CH), 130.4 (CH), 134.2 (CH), 154.9, 161.8. MS (m/z): (FAB+) [MH]+ 196. HRMS (m/z): [MH]+ calcd for C13H9NO, 196.0762; found, 196.0780.
(Z)-4-(4-(Trifluoromethyl)phenoxy)-N′-hydroxybenzamidine (6a)
A solution of 4-(4-(trifluoromethyl)phenoxy)benzonitrile (179 mg, 0.68 mmol) and hydroxylamine (167 μL, 2.72 mmol) in ethanol (10.0 mL) was refluxed for 1 h. The reaction mixture was cooled to room temperature and was concentrated in vacuo to give the desired product (201 mg, 100%). 1H NMR (500 MHz, CDCl3): δ (ppm): 4.94 (bs, 3H), 7.04–7.08 (m, 4H), 7.60 (d, J = 9.0 Hz, 2H), 7.64 (d, J = 8.8 Hz, 2H). 13C NMR (125 MHz, CDCl3): δ (ppm): 118.6 (CH), 119.7 (CH), 124.3 (q, J = 271.6 Hz, C), 125.7 (q, J = 32.9 Hz, C), 127.4 (q, J = 3.8 Hz, CH), 127.7, 127.9 (CH), 138.0, 152.3, 157.6. 19F NMR (282 MHz, CDCl3): δ (ppm): −61.88 (s, 3F). MS (m/z): (FAB+) [MH]+ 297. HRMS (m/z): [MH]+ calcd for C14H11F3N2O2, 297.0851; found, 297.0863.
(Z)-N′-Hydroxy-4-phenoxybenzamidine (6b)
4-Phenoxybenzonitrile (200 mg, 1.02 mmol) and hydroxylamine (250 μL, 4.09 mmol) in ethanol (5.0 mL) were refluxed for 3 h. The mixture was cooled and then concentrated in vacuo to give the title compound (233 mg, 100%). 1H NMR (500 MHz, CDCl3): δ (ppm): 4.87 (bs, 2H), 7.01 (d, J = 9.0 Hz, 2H), 7.03 (dd, J = 8.7, 1.1 Hz, 2H), 7.15 (tt, J = 7.4, 1.1 Hz, 2H), 7.36 (dd, J = 8.6, 7.3 Hz, 2H), 7.59 (d, J = 9.0 Hz, 2H). 13C NMR (125 MHz, CDCl3): δ (ppm): 118.6 (CH), 119.6 (CH), 124.3, 127.3, 127.6 (CH), 130.1 (CH), 152.5, 156.6, 159.3. MS (m/z): (FAB+) [MH]+ 229. HRMS (m/z): [MH]+ calcd for C13H12N2O2, 229.0977; found, 229.0977.
(Z)-4-(4-(Trifluoromethyl)phenoxy)-O-(4-(4-fluorobenzoyl)benzamidoxime (7)
A solution of (Z)-4-(4-(trifluoromethyl)phenoxy)-N′-hydroxy-benzamidine (130 mg, 0.38 mmol) in methylene chloride (1.5 mL) and N-ethyldiisopropylamine (133 μL, 0.76 μmol) was cooled in an iced-water bath under an atmosphere of nitrogen. A solution of 4-fluorobenzoyl chloride (60 μL, 0.51 mmol) was added dropwise to the previous solution and the mixture was stirred for 1 h at 0 °C. The solution was allowed to warm to room temperature and was then stirred for 24 h. Ethyl acetate (25 mL) was poured into the mixture, and the solution was washed with aq NaHCO3 (25 mL), water (25 mL), and then brine (25 mL). The organic layer was then dried over anhydrous MgSO4 and was concentrated to dryness in vacuo. The solid residue was purified using column chromatography on silica gel (EtOAc/hexanes, 1:3 to 4:1) to give the product as a white solid (172 mg, 94%). 1H NMR (500 MHz, CDCl3): δ (ppm): 5.18 (bs, 1H), 7.07–7.11 (m, 4H), 7.16 (t, J = 8.7 Hz, 2H), 7.62 (d, J = 8.4 Hz, 2H), 7.79 (d, J = 9.0 Hz, 2H), 8.12 (dd, J = 9.0, 5.4 Hz, 2H). 13C NMR (125 MHz, CDCl3): δ (ppm): 116.0 (d, J = 22.3 Hz, CH), 118.8 (CH), 119.7 (CH), 124.2 (q, J = 271.6 Hz, C), 125.9 (d, J = 2.8 Hz, C), 126.0 (q, J = 32.5 Hz, C), 127.1, 127.5 (q, J = 3.8 Hz, CH), 129.1 (CH), 132.2 (d, J = 9.5 Hz, CH), 157.7 (d, J = 232.5 Hz, C), 159.6, 163.3, 165.0, 167.0. 19F NMR (282 MHz, CDCl3): δ (ppm): –61.89 (s, 3F), 105.03–105.13 (m, 1F). MS (m/z): (FAB+) [MH]+ 419. HRMS (m/z): [MH]+ calcd for C21H14F4N2O3, 419.1019; found, 419.1031.
5-(4-Fluorophenyl)-3-(4-(4-(trifluoromethyl)phenoxy)phenyl)-1,2,4-oxadiazole (1)
(Z)-4-(4-(Trifluoromethyl)phenoxy)-O-(4-(4-fluorobenzoyl)benzamidoxime (150 mg, 0.358 mmol) was placed in THF (1.5 mL) under an atmosphere of nitrogen. Tetrabutylammonium fluoride (1.0 M, 385 μL) was added dropwise, and the solution was stirred at room temperature for 4 h. The solvent was removed under reduced pressure, and the product was purified by column chromatography on silica gel (EtOAc/hexanes, 1:3) to give a white solid (132 mg, 92%). 1H NMR (500 MHz, CDCl3): δ (ppm): 7.14 (d, J = 9.0 Hz, 2H), 7.16 (d, J = 9.0 Hz, 2H), 7.23–7.27 (m, 2H), 7.63 (d, J = 8.4 Hz, 2H), 8.18 (d, J = 8.8 Hz, 2H) 8.23 (dd, J = 9.0, 5.4 Hz, 2H). 13C NMR (125 MHz, CDCl3): δ (ppm): 116.7 (d, J = 15.2 Hz, CH), 119.0 (CH), 119.8 (CH), 120.8 (d, J = 4.2 Hz, C), 122.9, 124.3 (q, J = 271.6 Hz, C), 126.0 (q, J = 32.5 Hz, C), 127.6 (q, J = 3.8 Hz, CH), 129.7 (CH), 130.8 (d, J = 9.0 Hz, CH), 158.8, 159.6, 165.7 (d, J = 254.1 Hz, C), 168.5, 175.1. 19F NMR (282 MHz, CDCl3): δ (ppm) 61.87 (s, 3F), 104.90–105.00 (m, 1F). MS (m/z): (FAB+) [MH]+ 400 (MH+). HRMS (m/z): [MH]+ calcd for C21H12F4N2O2, 400.0835; found, 400.0811.
5-(4-(tert-Butyldimethylsilyloxy)phenyl)-3-(4-(4-(trifluoromethyl)phenoxy)-phenyl)-1,2,4-oxadiazole (10a)
4-(tert-Butyldimethylsilyloxy)benzoyl chloride (201 mg, 743 μmol) in toluene (1.0 mL) was added to (Z)-4-(4-(trifluoromethyl)phenoxy)-N′-hydroxybenzamidine (128 mg, 254 mmol) in toluene (4.0 mL). The reaction mixture was refluxed (120 °C) for 27 h. The solution was then cooled to room temperature, and the organic layer was then removed under reduced pressure. The crude brown material was purified by column chromatography (4:1 Hex/EtOAc) to give a yellow oil, which crystallized upon standing to give yellow crystals (294 mg, 85%). 1H NMR (500 MHz, CDCl3): δ (ppm): 0.26 (s, 6H), 1.01 (s, 9H), 6.98 (d, J = 9.0 Hz, 2H), 7.13 (d, J = 9.1 Hz, 2H), 7.15 (d, J = 9.0 Hz, 2H), 7.63 (d, J = 9.1 Hz, 2H), 8.11 (d, J = 8.8 Hz, 2H), 8.18 (d, J = 9.0 Hz, 2H). 13C NMR (125 MHz, CDCl3): δ (ppm): −4.2 (CH3), 18.5 (C), 25.8 (CH3), 117.6 (C), 118.9 (CH), 119.8 (CH), 123.3 (CH), 124.3 (q, J = 271.8 Hz, CF3), 125.9 (q, J = 32.5 Hz, C), 127.5 (q, J = 4.1 Hz, CH), 129.7 (CH), 130.3 (CH), 158.6, 159.6, 159.7, 160.2, 168.3, 175.9. 19F NMR (282 MHz, CDCl3): δ (ppm): 61.9 (s, 3F). MS (m/z): (FAB+) [MH]+ 513. HRMS (m/z): [MH]+ calcd for C27H27F3N2O3Si, 513.1821; found, 513.1816.
4-(3-(4-(4-(Trifluoromethyl)phenoxy)phenyl)-1,2,4-oxadiazol-5-yl)phenol (3)
5-(4-(tert-Butyldimethylsilyloxy)phenyl)-3-(4-(4-(trifluoromethyl)phenoxy)-phenyl)-1,2,4-oxadiazole (164 mg, 319 μmol) was dissolved in dry THF (2.0 mL) and TBAF (319 μL, 1.0 M in THF) was added dropwise at room temperature to the stirred solution. The reaction was checked for completion by TLC after <1 min. The organic solution was washed with water, 10% HCl, and then dried with MgSO4. The organic solvents were removed under reduced pressure to give the crude product which was purified by silica gel column chromatography (1:4 EtOAc/hexanes) to give the product (88 mg, 70%) as an off white solid. 1H NMR (500 MHz, CDCl3): δ (ppm): 6.71 (bs, 1H), 6.99 (d, J = 8.6 Hz, 2H), 7.13 (d, J = 8.8 Hz, 2H), 7.15 (d, J = 8.6 Hz, 2H), 7.62 (d, J = 8.6 Hz, 2H), 8.10 (d, J = 8.6 Hz, 2H), 8.16 (d, J = 8.6 Hz, 2H). 13C NMR (125 MHz, CDCl3): δ 116.4 (CH), 116.7 (C), 119.1 (CH), 119.7 (CH), 122.8 (C), 124.3 (q, J = 271.6 Hz, C), 126.0 (q, J = 32.5 Hz, C), 127.5 (q, J = 3.8 Hz, CH), 129.8 (CH), 130.6 (C), 158.8 (C), 159.5 (C), 160.3 (C), 168.3 (C), 175.9 (C). 19F NMR (282 MHz, CDCl3): δ (ppm): 61.9 (s, 3F). MS (m/z): (FAB+) [MH]+ 399. HRMS (m/z): [MH]+ calcd for C21H13F3N2O3, 399.0957; found, 399.0928.
5-(4-(tert-Butyldimethylsilyloxy)phenyl)-3-(4-phenoxyphenyl)-1,2,4-oxadiazole (10b)
4-(tert-Butyldimethylsilyloxy)benzoyl chloride (1.50 g, 6.6 mmol) in toluene (10.0 mL) was added to (Z)-N′-hydroxy-4-phenoxybenzamidine (1.96 g, 254 mmol) in toluene (80.0 mL). The reaction mixture was refluxed (120 °C) for 27 h. The solution was then cooled to room temperature and the organic solvent was removed under reduced pressure. The resulting crude brown material was purified by column chromatography (4:1 hexanes/EtOAc) to give a yellow oil, which crystallized upon standing to give yellow crystals (2.25 g 77%). 1H NMR (500 MHz, CDCl3): δ (ppm): 0.26 (s, 6H), 1.01 (s, 9H), 6.97 (d, J = 8.8 Hz, 2H), 7.08–7.11 (m, 4H), 7.18 (t, J = 7.4 Hz, 1H) 7.37–7.41 (m, 2H), 8.10 (d, J = 9.0 Hz, 2H), 8.12 (d, J = 9.0 Hz, 2H). 13C NMR (125 MHz, CDCl3): δ (ppm): −4.2 (CH3), 18.5 (C), 25.8 (CH3), 117.7 (C), 118.6 (CH), 119.9 (C), 120.9 (CH), 121.9 (C), 124.3 (CH), 129.5 (CH), 130.1 (CH), 130.2 (CH), 156.4 (C), 160.1 (C), 160.2 (C), 168.5 (C), 175.7 (C). MS (m/z): (FAB+) [MH]+ 445. HRMS (m/z): [MH]+ calcd for C26H28N2O3Si, 445.1947; found, 445.1922.
4-(3-(4-Phenoxyphenyl)-1,2,4-oxadiazol-5-yl)phenol (2)
5-(4-(tert-Butyldimethylsilyloxy)phenyl)-3-(4-phenoxyphenyl)-1,2,4-oxadiazole (104 mg, 234 μmol) was dissolved in dry THF and then TBAF (234 μL, 1.0 M in THF) was added dropwise at room temperature to the stirred solution. The reaction was checked by TLC after <1 min. The organic solution was washed with water, 10% HCl and then dried with MgSO4. The organic solvents were removed under reduced pressure to give the crude product which was purified by silica gel column chromatography (1:4 EtOAc/hexanes) to give the title compound (77 mg, 100%) as an off white solid. 1H NMR (500 MHz, CDCl3): δ (ppm): 5.83 (bs, 1H), 6.98 (d, J = 8.2 Hz, 2H), 7.09 (m, 4H), 7.18 (t, J = 7.6 Hz, 1H), 8.12 (t, J = 7.7 Hz, 2H), 8.12 (d, J = 6.8 Hz, 2H). 13C NMR (125 MHz, CDCl3): δ (ppm): 116.3 (CH), 117.2, 118.6 (CH), 119.9 (CH), 121.8, 124.4 (CH), 129.5 (CH), 130.2 (CH), 130.6 (CH), 156.4, 159.8, 160.3, 168.5, 175.7. MS (m/z): (FAB+) [MH]+ 331. HRMS (m/z): [MH]+ calcd for C20H14N2O3, 331.1083; found, 331.1056.
tert-Butyldimethylsilyl 4-(tert-butyldimethylsilyloxy)benzoate (8)
4-Hydroxybenzoic acid (1.0 g, 7.24 mmol) and tert-butyldimethylsilyl chloride (2.4 g, 15.9 mmol) were dissolved in ethyl acetate (9.0 mL) and then triethylamine was added dropwise. The reaction mixture was stirred at room temperature for 1 h. The solution was filtered and then allowed to stand for 1 h to precipitate the triethylammonium salt. The solution was filtered again, and the filtrate was removed under reduced pressure to give a clear oil which crystallized upon standing to give the product as a white solid (2.6 g, 100%), which was contaminated by a small amount of TBDMSCl. 1H NMR (500 MHz, CDCl3): δ (ppm): 0.23 (s, 6H), 0.36 (s, 6H), 0.99 (s, 9H), 1.02 (s, 9H), 6.86 (d, J = 9.0 Hz, 2H), 7.94 (d, J = 9.0 Hz, 2H). 13C NMR (125 MHz, CDCl3): δ (ppm): −4.5 (CH3), −4.2 (CH3), 18.0 (C), 18.5 (C), 25.8 (CH3), 25.9 (CH3), 120.0 (CH), 124.8 (C), 132.3 (CH), 160.3 (C), 166.7 (C). MS (m/z): (FAB+) [MH]+ 367. HRMS (m/z): [MH]+ calcd for C19H34O3Si2, 367.2125; found, 367.2120.
4-(tert-Butyldimethylsilyloxy)benzoyl chloride (9)
tert-Butyldimethylsilyl 4-(tert-butyldimethylsilyloxy)benzoate (0.6 g, 1.6 mmol) was dissolved in dry methylene chloride (15.0 mL), and the solution was cooled to 0 °C. Oxalyl chloride (160 μL, 1.8 mmol) was added, followed by dry DMF (4 drops). The reaction mixture was allowed to warm to room temperature and then stirred for an additional 3.5 h. The reaction was checked for completion by TLC, and the product was used immediately in the next step without purification.
3-(4-(4-(Trifluoromethyl)phenoxy)phenyl)-5-(4-nitrophenyl-1,2,4-oxadiazole (11)
To a solution of 4-nitrobenzoylchloride (1.57 g, 8.5 mmol) in toluene (50 mL) was added the (Z)-N′-hydroxy-4-(4-(trifluoromethyl)phenoxy)benzimidamide (2.51 g, 8.5 mmol). The reaction mixture was refluxed for 5.5 h. Then the solution was cooled to room temperature and the product crystallized from the solvent. A third of the solvent was removed under reduced pressure, and the solvent was heated to dissolve the product and then cooled to 0 °C overnight. The solid was collected by suction filtration and washed with cold toluene to give the pure product (1.89 g, 52%) as a yellow solid. 1H NMR (500 MHz, CDCl3) δ (ppm): 7.15 (dd, J = 9.1, 0.7 Hz, 2H), 7.18 (d, J = 8.8 Hz, 2H), 7.65 (dd, J = 9.1, 0.7 Hz, 2H), 8.20 (d, J = 9.0 Hz, 2H), 8.43 (s, 4H). 13C NMR (125 MHz, CDCl3) δ (ppm): 119.2 (CH), 119.8 (CH), 122.3, 124.6 (CH), 126.1 (C, q, J = 32.5 Hz), 127.6 (CH, q, J = 3.8 Hz), 129.4 (CH), 129.7, 129.8, 150.4, 159.4, 169.0, 173.9. 19F NMR (282 MHz, CDCl3) δ (ppm): 61.9 (3F, s). MS (m/z): (FAB+): 427 (MH+). HRMS (m/z): [MH]+ calcd for C21H12F3N3O4, 427.0780; found 427.0782.
4-(3-(4-(4-(Trifluoromethyl)phenoxy)phenyl)-1,2,4-oxadiazol-5-yl)aniline (4)
Iron powder (132 mg, 2.33 mmol), water (210 μL, 11.8 mmol) and 12 N HCl (10 μL, 0.11 mmol) were added consecutively to a solution of 3-(4-(4-(trifluoromethyl)phenoxy)phenyl)-5-(4-nitrophenyl-1,2,4-oxadiazole (46 mg, 0.11 mmol) in ethanol (6.0 mL). The mixture was heated at 95 °C for 1 h. The mixture was filtered while still hot and then washed with additional ethanol (10 mL). The filtrates were combined, and the solvent was removed in vacuo. The crude solid product was purified by silica gel column chromatography (EtOAc/hexanes 1:8) to give the product (31 mg, 72%) as a white solid. 1H NMR (500 MHz, CDCl3) δ (ppm): 4.18 (s, 2H), 6.74 (d, J = 8.0 Hz, 2H), 7.13 (t, J = 9.4 Hz, 4H), 7.61 (d, J = 8.7 Hz, 2H), 7.99 (d, J = 8.0 Hz, 2H), 8.16 (d, J = 8.0 Hz, 2H). 13C NMR (125 MHz, CDCl3) δ (ppm): 114.0, 114.7 (CH), 118.9 (CH), 119.8 (CH), 123.5, 125.4, 125.8 (C, q, J = 32.5 Hz), 127.5 (CH, q, J = 3.8 Hz), 129.7 (CH), 130.3 (CH), 150.9, 158.5, 159.8, 168.2, 176.3. 19F NMR (282 MHz, CDCl3) δ (ppm): 61.85 (3F, s). MS (m/z): (FAB+) [MH]+: 398. HRMS (m/z): [MH]+ calcd for C21H14F3N3O2, 397.1038; found 397.1036.
Bacterial Strains
E. faecium ATCC 19734, K. pneumonia ATCC 700603, A. baumanni ATCC 17961, P. aeruginosa ATCC 27853, E. aerogenes ATCC 35029 and E. coli ATCC 25922 were used for the initial screen and were purchased from the American Type Culture Collection (ATCC, Manassas, VA, U.S.A.). S. aureus NRS100 (COL), NRS 119, NRS120, VRS1, and VRS2 were obtained from the Network on Antimicrobial Resistance in Staphylococcus aureus (Chantilly, VA, U.S.A.). S. epidermis ATCC 35547, S. hemolyticus ATCC 29970, S. oralis ATCC 9811, S. pyogenes ATCC 49399, B. cereus ATCC 13061, B. licheniformis ATCC 12759, E. faecalis ATCC 29212, and E. faecium NCTC 7171 (ATCC 19434) were obtained from ATCC. E. faecalis 201 and 99, E. faecium 119-39A and 106 were collected from Wayne State University School of Medicine.
Determination of Minimal-Inhibitory Concentrations (MICs) and Minimal-Bactericidal Concentrations (MBCs)
MICs were determined by the microdilution procedure in cation-adjusted Mueller Hinton II Broth (CAMHB II; BBL) in accordance with recommendations of CLSI.27 The MICs against Streptococcus were determined in CAMHB II supplemented with 5% lysed horse blood (Hema Resource & Supply, Inc., Aurora, Oregon, U.S.A.) and the MICs of oxacillin against S. aureus were determined in the presence of 2% NaCl. The final bacterial innoculum was 5 × 10⁵ CFU/mL, and the results were read after 16–20 or 20–24 h incubation at 35 °C, depending on the species. All MIC determinations were performed in triplicate. We also determined MICs of compound 2 against S. aureus ATCC 29213 with bacterial innocula of 5 × 10⁶ CFU/mL and 5 × 10⁷ CFU/mL in order to evaluate the innoculum effect on MIC determination. Inoculated microtiter plates were incubated at 35 °C for 16–20 h, prior to recording of the results. Three bacterial strains, S. aureus NRS100 (highly methicillin-resistant strain), S. aureus ATCC 29213 and E. faecalis ATCC 29212 (vancomycin-susceptible strains) were used to determine MBCs of antibiotics 2 and 3. Determination of MBCs was performed by the macrodilution method in CAMHB II, by a variation of a literature method.28 First, 2-fold dilutions of the antibiotics were made in culture tubes containing 3 mL of CAMHB II, and the broth was inoculated with 5 × 10⁵ CFU/mL of bacterial suspension. After incubation for 16–20 h at 35 °C, MICs were recorded. For MBC determination, broth in the tubes with antibiotics 2 and 3 at concentrations corresponding to the MIC (the lowest concentration of compound with no visible bacterial growth), 2 × MIC and 4 × MIC were mixed, and a 100 μL portion was plated on antibiotic-free agar plates and incubated for 48 h prior to visualization and colony counting.
Hemolysis Assay
A 10-mL aliquot of horse whole blood (Innovative Research, Burlington, ON, Canada) was centrifuged at 7000 × g for 5 min. The supernatant was removed, and 5 mL of 0.1 M PBS was added to the red blood cell (RBC) pellet, followed by centrifugation. This step was repeated three times to afford washed RBCs, which were resuspended in 5 mL of 0.1 M PBS. Stock solutions of the compounds were prepared in DMSO. For the assays, a 50-μL aliquot of the each compound in DMSO was mixed with 750 μL PBS and 200 μL RBCs suspended in PBS to final concentrations of 2, 4, 8, 16, 32, and 64 μg/mL and incubated at 37 °C for 1 h. The positive control consisted of 50 μL DMSO, 750 μL of 2% Triton X-100 in 0.1 M PBS, and 200 μL RBCs. The negative control contained 50 μL DMSO, 750 μL PBS, and 200 μL RBCs. All samples were prepared in duplicates. After incubation, they were centrifuged at 13,000 × g for 5 min, and the supernatant was collected and analyzed by UV spectroscopy at 541 nm using an Epoch Microplate Spectrophotometer (BioTek Instruments, Inc., Winooski, VT, U.S.A.). Spectroscopic data were plotted in Microsoft Excel for calculation of IC50 values.
Metabolic Stability
Compounds (5 μM) were incubated with male rat liver S9 (0.05 mg protein/mL, BD Biosciences, Woburn, MA, U.S.A.) and nicotinamide adenine dinucleotide phosphate reduced (0.5 mM) in potassium phosphate buffer (50 mM, pH 7.4) at 37 °C for up to 60 min. Aliquots were taken at 0, 10, 30, and 60 min, and the reaction was terminated by the addition of one and a half volumes of acetonitrile containing 1 μM internal standard. The reaction mixtures were centrifuged (13,000 × g, 13 min) and aliquots of the supernatants were analyzed by ultraperformance liquid chromatography (UPLC) with multiple-reaction monitoring (MRM) detection. All analyses were conducted in duplicate.
Cell Lines and Culture
HepG2 cells (ATCC HB-8065) that had undergone 76 passages and HeLa (ATCC CCL-2) were stored in liquid nitrogen and were subcultured less than 20 times. Cells were maintained in monolayer culture at 37 °C and 5% CO2 in Dulbecco’s Modified Eagle’s medium supplemented with 10% fetal bovine serum, 1% nonessential amino acids, 2 mM l-glutamine, and 1% penicillin–streptomycin. Cell counts were performed by hemocytometry before addition of cells to 96-well plates.
In Vitro Cytotoxicity XTT Assay
Cell viability was determined by the XTT assay, which is based on the mitochondrial dehydrogenase activity in living cells. Cell density of seeding was optimized in order to have sufficient cells for analysis, without overgrowth. Compounds were dissolved in DMSO as stock solutions and diluted to a final concentration of 1% DMSO. Three controls were used in each 96-well plate in triplicates: negative control (complete medium and 1% DMSO without cells), cell growth control (complete medium and cells), and solvent control (complete medium, cells and 1% DMSO). After overnight incubation, the cells were treated with the compound for 16 h at concentrations of 2, 4, 8, 16, 32, 50, 64, and 100 μg/mL. Experiments were performed in triplicate. After treatment, each well was washed two times with PBS buffer and 150 μL XTT working solution (according to the manufacturer’s protocol) was then added to each well. After an additional 3-h incubation, the absorbance was measured at two wavelengths: 475 nm (test wavelength) and 660 nm (reference wavelength for background) using an ELISA reader (BioTek,Winooski, VT, U.S.A.). All the experiments were repeated two or three times. IC50 was calculated using GraphPad Prism 5 (GraphPad Software, Inc., San Diego, CA, U.S.A.).
Animals
Female ICR mice (6–8 weeks old, 17–20 g body weight specific pathogen free,) were obtained from Harlan Laboratories, Inc. (Indianapolis, IN U.S.A.). All procedures were performed in accordance with the University of Notre Dame Institutional Animal Care and Use Committee. Mice were maintained in polycarbonate shoebox cages with hardwood bedding in a room under a 12:12 h light/dark cycle and at 72 ± 2 °F and provided with Teklad 2019 Extruded Rodent Diet (Harlan, Madison, WI, U.S.A.) and water ad libitum.
Animal Dosing and Sample Collection for Pharmacokinetic Studies
Mice (n = 3 per time point per compound) were administered a single iv dose of compounds 2 or 3 or 4 at 50 mg/kg. The compounds were dissolved in 10% DMSO/25% Tween-80/65% water. Blood samples were collected in heparinized syringes by cardiac puncture at 2, 5, 10, 20, and 40 min, and at 1, 2, 3, 4, 8, 12, and 24 h after dose administration. A separate group of female ICR mice (n = 3 per time point) received a single po dose of compound 3 or 4 at 50 mg/kg by gavage. Terminal blood was collected at 0.5, 1, 2, 3, 4, 6, 8, 24, 30, and 48 h. Blood was centrifuged at 1200 × g for 10 min to collect plasma.
Sample Analysis
A 50-μL aliquot of plasma was mixed with 100 μL of internal standard in acetonitrile to a final concentration of 8 μg/mL. The sample was centrifuged at 10,000 × g for 10 min, and the supernatant was collected and analyzed by reversed-phase UPLC-ESI(+)-MRM of the transitions 331→121 for compound 2, 399→121 for compound 3, 398→120 for compound 4, and 401→123 for the internal standard. Calibration curves of compounds 2, 3, and 4 were prepared in blank mouse plasma containing the internal standard from which unknown concentrations were determined.
Liquid Chromatography/Mass Spectrometry
The chromatographic system consisted of a Waters Acquity UPLC System (Waters Corporation, Milford, MA, U.S.A.) equipped with a binary solvent manager, an autosampler, a column heater and a photodiode array detector. All mass spectrometric experiments were performed with a Waters TQD tandem quadrupole detector (Milford, MA, U.S.A.) monitored with MassLynx MS software. Mass spectrometry acquisition was performed in the positive electrospray ionization mode with MRM. The capillary voltage, cone voltage, extractor voltage, and RF lens voltage were set at 3.2 kV, 25 V, 3.0 V, and 0.1 V, respectively. Desolvation gas flow rate was 650 L/h (nitrogen) and the cone gas flow rate was 50 L/h (nitrogen). The source temperature and desolvation temperature were held at 150 and 350 °C, respectively. Samples were analyzed on an Aquity UPLC C18 1.7 μm, 2.1 mm i.d. × 50 mm column by elution at 0.5 mL/min with 70% A/30% B for 2 min, followed by a 10-min linear gradient to 90% B, then 70% A/30% B for 2 min (A = 0.1% formic acid/water, B = 0.1% formic acid/acetonitrile). The MRM transitions used were: 331→121 for compound 2, 399→121 for compound 3, 398→120 for compound 4, and 401→123 for the internal standard.
Pharmacokinetic Parameters
The area under the mean concentration–time curve up to the last quantifiable sampling time (AUC0-last) was calculated by the trapezoidal rule using the pharmacokinetic software PK Solutions (version 2.0, Summit Research Services, Montrose, CO, U.S.A.). AUC0–∞ was calculated as AUC0-last + (Clast/k), where Clast is the concentration at the last quantifiable sampling time and k is the elimination rate constant. Half-lives (t1/2α and t1/2β) were estimated from the linear portion of the initial or terminal linear portion of the concentration–time data by linear regression, where the slope of the line was the rate constant k and t1/2α = ln 2/k.
In Vivo Toxicity
A dose tolerance study was conducted with compound 2. Mice (n = 3 per time per group) were administered a single iv dose of compound 2 at 25 or 50 mg/kg. Compound 2 was dissolved in 10% DMSO/25% Tween-80/65% water. A vehicle control group (n = 3) was included. Mice were clinically monitored for 2 days.
Mouse Peritonitis Model
S. aureus ATCC 27660 (MRSA) was used for the mouse peritonitis model. Bacteria were grown in brain heart infusion agar and after overnight incubation they were grown in brain heart infusion broth (BD Biosciences, Woburn, MA, U.S.A.). The inoculum was prepared immediately before inoculation by suspending the colonies in sterile brain heart infusion broth medium, adjusted to an optical density of 0.5 at 540 nm (equivalent to 108 CFU/mL), and stored on ice until inoculation. A suspension of 10% mucin (Sigma-Aldrich Chemical Co., St Louis, MO, U.S.A.) in saline was heated to 105 °C for 45 min and the pH was adjusted to 7.0. Just prior to inoculation, bacteria at 108 CFU/mL were mixed 1:1 with mucin. The final inoculum was 5 × 10⁷ CFU/mL and 5% mucin. Groups of six mice were given each 0.5 mL of 5 × 10⁷ CFU/mL intraperitoneally. At 30 min after infection, mice were treated with oxadiazole, vancomycin (at 5 mg/kg), or vehicle given iv by tail vein injection, with a second dose at 8 h after infection. Mice were clinically monitored for 2 days, with survival as the primary end point.
Compounds 3 and 4 were also evaluated in the mouse peritonitis model after po administration. A single dose of the compound was administered to ICR mice (n = 6 per group) by oral gavage 1 h after infection. Mice were clinically monitored for 2 days and the number of mice surviving was recorded. Linezolid (at 10 mg/kg) was used as positive control.
A dose response curve for compound 3 was determined. Groups of six mice were given two iv doses of compound 3 at 10, 20, 30, 40, and 50 mg/kg at 30 min and 8 h after infection. In a separate study, groups of six mice received two po doses of compound 3 at 30, 40, 50, 60, and 70 mg/kg. Data were plotted in Graph Pad Prism for calculation of ED50 values.
Macromolecular Synthesis Assays
The effects of compound 3 on DNA, RNA, peptidoglycan, and protein synthesis of S. aureus were determined by measuring radioactive precursor as reported previously.29S. aureus ATCC 29213 was cultured overnight at 37 °C in fresh brain heart infusion medium until midexponential phase. Radioactive precursor (1 μCi/mL, [methyl-3H]-thymidine, [5,6-3H]-uridine, L-[4,5-3H]-leucine, or [2,3-3H]-d-alanine) was added to each aliquot of cell culture and incubated at 37 °C for 10 min, followed by addition of 0.25 μg/mL and 0.5 μg/mL of compound 3. Negative and positive controls (ciprofloxacin, rifampicin, tetracycline, and fosfomycin for inhibition of DNA, RNA, protein synthesis, and peptidoglycan synthesis, respectively) were included. The mixtures were incubated at 37 °C for up to 2 h. Aliquots (650 μL) were pipetted out every 20 min for determination of isotope incorporation and viability. The macromolecules were precipitated in 20% ice-cold trichoroacetic acid (TCA) on ice for 1 h and filtered through glass fiber filters. The filters were washed three times with 5% TCA and two times with 95% ethanol, dried, and placed in vials containing 5 mL of scintillation cocktail. Radioactivity was measured on a Beckman LS-100 liquid scintillation counter (Beckman Coulter, Inc., Brea, CA, U.S.A.). Triplicates were prepared for each assay, and all assays were repeated at least twice. The effects of compound 3 on radioactive precursor incorporation over time were expressed as percentage of inhibition relative to control.
Cloning of E. colidacB
The dacB gene encoding penicillin-binding protein PBP4 was amplified from the E. coli K12 chromosome using the high fidelity PfuUltra II Fusion HS DNA polymerase with primers PBP4_fw(TTTGTGTCATATGCAAATGTTGATGAGTACATTACTC) and PBP4_rv (TTTGTGCTCGAGATTGTTCTGATAAATATCTTTATAC), containing NdeI and XhoI restriction sites, respectively, to facilitate cloning. The resulting PCR fragment, containing dacB without the first 90 bp encoding the N-terminal signal peptide, was extracted from 1% agarose gel, purified using the QIAquick Gel Extraction Kit (Qiagen, Venlo, Netherlands), digested with NdeI and XhoI, cleaned with QIAquick PCR purification kit (Qiagen), and ligated with NdeI and XhoI double digested pET24a plasmid DNA. The ligation reaction was performed for 3 h at room temperature. A 5-μL aliquot of the ligation mixture was used to transform 100 μL of chemically competent E. coli DH5α cells. Colonies containing the plasmid were selected on LB agar supplemented with 50 μg/mL kanamycin. The construct was verified for the correct insert using NdeI and XhoI double digestion of plasmids extracted from four single colonies and further verified by sequencing of both DNA strands. Plasmid pET24a harboring the dacB gene was purified using QIAPre spin MiNiprep columns (Qiagen).
In vitro Transcription Assay
In vitro transcription levels of dacB encoding E. coli PBP4 were evaluated with and without compound 3. The 6633bp template plasmid DNA, which codes for 1607nt transcript, was purified using QIAPre spin MiNiprep columns (Qiagen, Venlo, Netherlands), and linearized with restriction enzyme XhoI. After linearization, template DNA was purified by phenol/chloroform extraction and a 2-μL aliquot of the sample (0.5 μg/μL) was used for each reaction. The dacB gene was transcribed in vitro using a T7 Transcription kit (Thermo Fisher Scientific Inc., Waltham, MA). The assay mixtures were prepared according to the manufacturer’s instructions and supplemented with 0.5, 5, 50, and 160 μg/mL of compound 3, along with the negative control. The assay mixtures were incubated for 2 h at 37 °C, and then placed on ice to stop transcription. Template DNA was removed with 2 μL of RNase-free DNaseI added to each tube, followed by incubation at 37 °C for 15 min, and then 2 μL of 0.5 M EDTA (pH 8.0) was added to each tube, followed by incubation at 65 °C for 10 min. The reaction mixtures were diluted 30-fold with DEPC-treated water to a final concentration of 0.1–0.5 μg/μL RNA transcripts and 8-μL aliquots of the diluted transcripts were loaded on a 1% denaturing formaldehyde gel in MOPS buffer (pH 7.0). The gel was visualized by Gel Doc EZ Imager (Bio-Rad Laboratories, Inc., Hercules, CA).
In Vitro Transcription/Translation Assay
An in vitro transcription/translation system was utilized to investigate the effect of compound 3 on translation processes. Plasmid pUC19, containing the lacZ gene that encodes β-galactosidase, was used as a template, and the rest of the transcription/translation machinery came from the E. coli S30 extract system (circular DNA) (Promega, Madison, WI, USA). A series of samples were prepared according to the manufacturer’s protocol and supplemented with 0.5, 5, 50, and 160 μg/mL of compound 3, along with the negative control. The reaction mixtures were incubated at 37 °C for 2 h, followed by placing the tubes on ice for 5 min to stop translation. The activity of β-galactosidase was quantified spectrophotometrically for each reaction using the β-galactosidase assay kit (Promega, Madison WI) according to the manufacturer’s instructions. The kit contains the chromogenic substrate o-nitrophenyl-β-D-galacoside, which is hydrolyzed by β-galactosidase from the reaction mixtures, resulting in the formation of o-nitrophenolate. The amount of o-nitrophenolate formed was measured by absorbance at 420 nm. The amounts of β-galactosidase from the reaction mixtures were calculated on the basis of a standard curve.
PBP2a-Binding Assay
PBP2a was cloned in E. coli as previously described.26 The assay involves the use of BOCILLIN FL, a commercially available fluorescent penicillin (Molecular Probes, Inc., CA), as a labeling reagent for the enzyme active site.30 A typical reaction mixture (20 μL) contains PBP2a (2.5 μM) and a given concentration of a putative inhibitor (antibiotic) in 25 mM Hepes, 1 M NaCl (pH 7.0). The mixture is incubated for 5 min at room temperature. At this point, the amount of uncomplexed (free) PBP is assayed by the addition of BOCILLIN FL to afford a final concentration of 30 μM, followed by an additional incubation at 37 °C for 10 min. SDS sample buffer (15 μL) is added to the reaction mixture, and it is boiled for 3 min. The samples (35 μL in total) are loaded onto 10% SDS-PAGE, and the gel is developed and scanned using Storm840 Fluorimager. The fluorescent bands are quantified using IMAGEQUANT 5.2 software. A control sample is also routinely prepared in which PBP2a is incubated directly with BOCILLIN FL for 10 min and quenched using the same SDS sample buffer.
Nitrocefin assay
Nitrocefin was synthesized as previously described,31 following the procedure previously reported.26
Acknowledgments
This work was supported by Grant AI090818 from the National Institutes of Health (to M.C. and S.M.).
Author Contributions
¶ Z.P. and H.P. have contributed equally.
The authors declare no competing financial interest.
Funding Statement
National Institutes of Health, United States
References
- Klein E.; Smith D. L.; Laxminarayan R. Hospitalizations and deaths caused by methicillin-resistant Staphylococcus aureus, United States, 1999–2005. Emerg. Infect. Dis. 2007, 13, 1840–1846. [DOI] [PMC free article] [PubMed] [Google Scholar]
- Klevens R. M.; Morrison M. A.; Nadle J.; Petit S.; Gershman K.; Ray S.; Harrison L. H.; Lynfield R.; Dumyati G.; Townes J. M.; Craig A. S.; Zell E. R.; Fosheim G. E.; McDougal L. K.; Carey R. B.; Fridkin S. K. Invasive methicillin-resistant Staphylococcus aureus infections in the United States. JAMA, J. Am. Med. Assoc. 2007, 298, 1763–1771. [DOI] [PubMed] [Google Scholar]
- Klevens R. M.; Edwards J. R.; Tenover F. C.; McDonald L. C.; Horan T.; Gaynes R. Changes in the epidemiology of methicillin-resistant Staphylococcus aureus in intensive care units in US hospitals, 1992–2003. Clin. Infect. Dis. 2006, 42, 389–391. [DOI] [PubMed] [Google Scholar]
- Kallen A. J.; Mu Y.; Bulens S.; Reingold A.; Petit S.; Gershman K.; Ray S. M.; Harrison L. H.; Lynfield R.; Dumyati G.; Townes J. M.; Schaffner W.; Patel P. R.; Fridkin S. K. Health care-associated invasive MRSA infections, 2005–2008. JAMA, J. Am. Med. Assoc. 2010, 304, 641–648. [DOI] [PubMed] [Google Scholar]
- Burton D. C.; Edwards J. R.; Horan T. C.; Jernigan J. A.; Fridkin S. K. Methicillin-resistant Staphylococcus aureus central line-associated bloodstream infections in US intensive care units, 1997–2007. JAMA, J. Am. Med. Assoc. 2009, 301, 727–736. [DOI] [PubMed] [Google Scholar]
- Overbye K. M.; Barrett J. F. Antibiotics: Where did we go wrong?. Drug Discovery Today 2005, 10, 45–52. [DOI] [PubMed] [Google Scholar]
- French G. L. Bactericidal agents in the treatment of MRSA infections--The potential role of daptomycin. J. Antimicrob. Chemother. 2006, 58, 1107–1117. [DOI] [PubMed] [Google Scholar]
- Kaka A. S.; Rueda A. M.; Shelburne S. A. 3rd; Hulten K.; Hamill R. J.; Musher D. M. Bactericidal activity of orally available agents against methicillin-resistant Staphylococcus aureus. J. Antimicrob. Chemother. 2006, 58, 680–683. [DOI] [PubMed] [Google Scholar]
- Appelbaum P. C. The emergence of vancomycin-intermediate and vancomycin-resistant Staphylococcus aureus. Clin. Microbiol. Infect. 2006, 12Suppl 116–23. [DOI] [PubMed] [Google Scholar]
- Tsiodras S.; Gold H. S.; Sakoulas G.; Eliopoulos G. M.; Wennersten C.; Venkataraman L.; Moellering R. C.; Ferraro M. J. Linezolid resistance in a clinical isolate of Staphylococcus aureus. Lancet 2001, 358, 207–208. [DOI] [PubMed] [Google Scholar]
- Prystowsky J.; Siddiqui F.; Chosay J.; Shinabarger D. L.; Millichap J.; Peterson L. R.; Noskin G. A. Resistance to linezolid: characterization of mutations in rRNA and comparison of their occurrences in vancomycin-resistant enterococci. Antimicrob. Agents Chemother. 2001, 45, 2154–2156. [DOI] [PMC free article] [PubMed] [Google Scholar]
- Silverman J. A.; Oliver N.; Andrew T.; Li T. Resistance studies with daptomycin. Antimicrob. Agents Chemother. 2001, 45, 1799–1802. [DOI] [PMC free article] [PubMed] [Google Scholar]
- Lewis J. S. 2nd; Owens A.; Cadena J.; Sabol K.; Patterson J. E.; Jorgensen J. H. Emergence of daptomycin resistance in Enterococcus faecium during daptomycin therapy. Antimicrob. Agents Chemother. 2005, 49, 1664–1665. [DOI] [PMC free article] [PubMed] [Google Scholar]
- Talbot G. H.; Bradley J.; Edwards J. E. Jr.; Gilbert D.; Scheld M.; Bartlett J. G. Bad bugs need drugs: An update on the development pipeline from the Antimicrobial Availability Task Force of the Infectious Diseases Society of America. Clin. Infect. Dis. 2006, 42, 657–668. [DOI] [PubMed] [Google Scholar]
- Enright M. C.; Robinson D. A.; Randle G.; Feil E. J.; Grundmann H.; Spratt B. G. The evolutionary history of methicillin-resistant Staphylococcus aureus (MRSA). Proc. Natl. Acad. Sci. U.S.A. 2002, 99, 7687–7692. [DOI] [PMC free article] [PubMed] [Google Scholar]
- Llarrull L. I.; Fisher J. F.; Mobashery S. Molecular basis and phenotype of methicillin resistance in Staphylococcus aureus and insights into new beta-lactams that meet the challenge. Antimicrob. Agents Chemother. 2009, 53, 4051–4063. [DOI] [PMC free article] [PubMed] [Google Scholar]
- Otero L. H.; Rojas-Altuve A.; Llarrull L. I.; Carrasco-Lopez C.; Kumarasiri M.; Lastochkin E.; Fishovitz J.; Dawley M.; Hesek D.; Lee M.; Johnson J. W.; Fisher J. F.; Chang M.; Mobashery S.; Hermoso J. A. How allosteric control of Staphylococcus aureus penicillin-binding protein 2a enables methicillin-resistance and physiological function. Proc. Natl. Acad. Sci. U.S.A. 2013, 110, 16808–16813. [DOI] [PMC free article] [PubMed] [Google Scholar]
- Georgopapadakou N. H.; Dix B. A.; Mauriz Y. R. Possible physiological functions of penicillin-binding proteins in Staphylococcus aureus. Antimicrob. Agents Chemother. 1986, 29, 333–336. [DOI] [PMC free article] [PubMed] [Google Scholar]
- Sauvage E.; Kerff F.; Terrak M.; Ayala J. A.; Charlier P. The penicillin-binding proteins: structure and role in peptidoglycan biosynthesis. FEMS Microbiol. Rev. 2008, 32, 234–258. [DOI] [PubMed] [Google Scholar]
- Fisher J. F.; Meroueh S. O.; Mobashery S. Bacterial resistance to beta-lactam antibiotics: compelling opportunism, compelling opportunity. Chem. Rev. 2005, 105, 395–424. [DOI] [PubMed] [Google Scholar]
- Wong K. K.; Pompliano D. L. Peptidoglycan biosynthesis. Unexploited antibacterial targets within a familiar pathway. Adv. Exp. Med. Biol. 1998, 456, 197–217. [PubMed] [Google Scholar]
- Irwin J. J.; Shoichet B. K. ZINC--a free database of commercially available compounds for virtual screening. J. Chem. Inf. Model. 2005, 45, 177–182. [DOI] [PMC free article] [PubMed] [Google Scholar]
- Lim D.; Strynadka N. C. Structural basis for the beta lactam resistance of PBP2a from methicillin-resistant Staphylococcus aureus. Nat. Struct. Biol. 2002, 9, 870–876. [DOI] [PubMed] [Google Scholar]
- Boucher H. W.; Talbot G. H.; Bradley J. S.; Edwards J. E.; Gilbert D.; Rice L. B.; Scheld M.; Spellberg B.; Bartlett J. Bad bugs, no drugs: No ESKAPE! An update from the Infectious Diseases Society of America. Clin. Infect. Dis. 2009, 48, 1–12. [DOI] [PubMed] [Google Scholar]
- Miller A. A.; Bundy G. L.; Mott J. E.; Skepner J. E.; Boyle T. P.; Harris D. W.; Hromockyj K. R.; Marotti K. R.; Zurenko G. E.; Munzer J. B.; Sweeney M. T.; Bammert G. F.; Hamel J. C.; Ford C. W.; Zhong W.; Graber D. R.; Martin G. E.; Han F.; Dolak L. A.; Seest E. P.; Ruble J. C.; Kamilar G. M.; Palmer J. R.; Banitt L. S.; Hurd A. R.; Barbachyn M. R. Discovery and Characterization of QPT-1, the Progenitor of a New Class of Bacterial Topoisomerase Inhibitors. Antimicrob. Agents Chemother. 2008, 52, 2806–2812. [DOI] [PMC free article] [PubMed] [Google Scholar]
- Fuda C.; Suvorov M.; Vakulenko S. B.; Mobashery S. The basis for resistance to beta-lactam antibiotics by penicillin-binding protein 2a of methicillin-resistant Staphylococcus aureus. J. Biol. Chem. 2004, 279, 40802–40806. [DOI] [PubMed] [Google Scholar]
- Methods for Dilution Antimicrobial Susceptibility Tests for Bacteria That Grow Aerobically: Approved Standard, 7th: document M7-A7 ed., Clinical and Laboratory Standards Institute (CLSI): Wayne PA, 2006. [Google Scholar]
- Lorian V., Ed. Antibiotics in laboratory medicine, 4th ed., Williams & Wilkins: Baltimore, 1996. [Google Scholar]
- Xiong Y. Q.; Bayer A. S.; Yeaman M. R. Inhibition of intracellular macromolecular synthesis in Staphylococcus aureus by thrombin-induced platelet microbicidal proteins. J. Infect. Dis. 2002, 185, 348–356. [DOI] [PubMed] [Google Scholar]
- Zhao G.; Meier T. I.; Kahl S. D.; Gee K. R.; Blaszczak L. C. BOCILLIN FL, a sensitive and commercially available reagent for detection of penicillin-binding proteins. Antimicrob. Agents Chemother. 1999, 43, 1124–1128. [DOI] [PMC free article] [PubMed] [Google Scholar]
- Lee M.; Hesek D.; Mobashery S. A practical synthesis of nitrocefin. J. Org. Chem. 2005, 70, 367–369. [DOI] [PubMed] [Google Scholar]