

Summary
Reactive oxygen species (ROS) are produced during normal metabolism and can function as signaling molecules. ROS at elevated levels, however, can damage cells. Here we identify the conserved TORC2/Ypk1 signaling module as an important regulator of ROS in the model eukaryotic organism, S. cerevisiae. We show that TORC2/Ypk1 suppresses ROS produced both by mitochondria as well as by non-mitochondrial sources, including changes in acidification of the vacuole. Furthermore, we link vacuole-related ROS to sphingolipids, essential components of cellular membranes, whose synthesis is also controlled by TORC2/Ypk1 signaling. In total, our data reveal that TORC2/Ypk1 act within a homeostatic feedback loop to maintain sphingolipid levels and that ROS are a critical regulatory signal within this system. Thus ROS sensing and signaling by TORC2/Ypk1 play a central physiological role in sphingolipid biosynthesis and in the maintenance of cell growth and viability.
Introduction
Regulation of cell proliferation requires a balanced response to both growth and stress related cues. The ability of cells to coordinate this balance occurs, in part, through the evolutionarily conserved TOR kinase signaling network. TOR functions as part of two distinct complexes, TOR Complexes 1 and 2 (TORC1 and TORC2), which phosphorylate and modulate the activity of different members of the AGC family of protein kinases. Thus, in mammalian cells, mTORC1 recognizes S6K1 whereas mTORC2 recognizes AKT (also known as PKB) as well as SGK (Hara et al., 2002; Sarbassov et al., 2005). This specificity extends to budding yeast, where TORC1 recognizes Sch9 and TORC2 recognizes Ypk1 and Ypk2 (Kamada et al., 2005; Niles et al., 2012; Urban et al., 2007). Recognition of Ypk1/2 by TORC2 also requires the activity of the PH-domain containing proteins Slm1 and Slm2, which act by recruiting Ypk1/2 to the plasma membrane (PM), where TORC2 is localized (Niles et al., 2012). TORC2 phosphorylation of Ypk1/2 enhances their subsequent phosphorylation and activation by Pkh1/2, orthologs of mammalian PDK1 (Casamayor et al., 1999). Following activation, Ypk1/2 carry out a number of functions to promote cellular growth, including polarization of the actin cytoskeleton, receptor-mediated endocytosis, and sphingolipid biosynthesis (Loewith and Hall, 2011).
How TORC2 activity is modulated within cells remains poorly understood, however, recent evidence suggests that complex sphingolipids participate in this process (Berchtold et al., 2012). Sphingolipids are essential structural components of eukaryotic membranes and, together with their biosynthetic precursors, the sphingoid long chain bases (LCBs) and ceramides, play important roles in cell signaling, intracellular trafficking, and response to stress. Previous studies have established TORC2/Ypk1/2 signaling as a positive regulator of the early steps of sphingolipid biosynthesis, including the first step carried out by the enzyme serine palmityl transferase (SPT) as well as the subsequent formation of ceramides (Aronova et al., 2008; Roelants et al., 2011). Remarkably, inhibition of SPT activity with the drug myriocin was observed to result in increased phosphorylation of Ypk1 by TORC2 in a manner that requires changes in the PM-localization of Slm1/2. Specifically, Slm1 was shown to move from PM-associated structures termed eisosomes to a domain known as the membrane compartment containing TORC2 (MCT) (Berchtold et al., 2012). Thus it has been proposed that depletion of sphingolipids within the PM leads to Slm1/2 relocalization and increased activation of Ypk1 as part of a homeostatic feedback mechanism to maintain normal levels of sphingolipids. The precise nature of the PM-stress that results in Slm1/2 relocation following sphingolipid depletion remains ill defined.
Another important cellular process that has been linked to TORC2/Ypk1/2 signaling is control of oxidative stress. In particular, we and others have observed that impaired TORC2/Ypk1/2 signaling results in increased expression of genes associated with suppression of reactive oxygen species (ROS), specifically genes regulated by the oxidative stress-responsive transcription factor Yap1 (Mulet et al., 2006; Niles et al., 2012). ROS, which includes superoxide, hydrogen peroxide, and the hydroxyl radical, are produced in cells as part of normal metabolism, and have many beneficial roles, including signal transduction. Unregulated ROS can result in cellular damage, however, including oxidation of proteins, lipids, and DNA (Farrugia and Balzan, 2012). As such, ROS are associated with many diseases, including neurodegenerative diseases like Alzheimer’s and Parkinson’s, cardiovascular disease, cancer, as well as aging (Finkel, 2005). ROS are produced from many sources in both mammalian and yeast cells, with a major source being the mitochondrial electron transport chain (Fang and Beattie, 2003). ROS are also produced from non-mitochondrial sources, due to ER stress (Haynes et al., 2004) and by exposure to heavy metals and other environmental factors (Halliwell and Cross, 1994). More recently, ROS has been shown to accumulate following defects in vacuolar acidification as well as decreased levels of sphingolipids (Kajiwara et al., 2012; Milgrom et al., 2007).
Here we report that impaired TORC2/Ypk1 signaling indeed results in increased ROS that are produced by two distinct sources. One source is due to improper mitochondrial respiration that we show is coupled to increased Protein kinase A (PKA) activity and a subsequent repression of mitochondrial membrane potential. The second source of ROS is due to defects in vacuolar acidification, which is caused by increased activity of the amino phospholipid flippase kinase Fpk1 as well as decreased levels of sphingolipids. Remarkably, we find that ROS associated with decreased sphingolipids is specifically responsible for promoting changes in the localization of Slm1 at the PM and for TORC2-dependent stimulation of Ypk1 phosphorylation. Moreover, we demonstrate that ROS accumulation contributes to decreased growth and survival within Ypk1-deficient cells. Together, these results reveal a complex network regulated by TORC2/Ypk1 signaling to sense and regulate ROS in cells to maintain sphingolipid levels as well as cell viability.
Results
TORC2/Ypk1 signaling modulates intracellular ROS
TORC2/Ypk1/2 signaling negatively regulates the transcription of genes controlled by the oxidative stress transcription factor Yap1 (Mulet et al., 2006; Niles et al., 2012). Given the consequences of oxidative damage that result from increased ROS, we sought to test whether TORC2/Ypk1/2 signaling regulates ROS accumulation. Toward this end, we examined the effect of rapidly and specifically inhibiting Ypk1 by utilizing a plasmid-expressed ATP-analog sensitive allele of Ypk1 (Ypk1-AS) in a strain deleted for endogenous YPK1 and YPK2 (Niles et al., 2012). Indirect in vivo levels of ROS were quantified as the percent of growing cells that labeled with the fluorescent ROS indicator dye, H2DCFDA (DCF) (Lee et al., 2011). To first confirm the reactivity of DCF to ROS under our experimental conditions, we treated cells with H2O2, which resulted in positive labeling of 100% of cells (Figure 1A).
Figure 1. TORC2/Ypk1 signaling regulates ROS.

(A) Ypk1-WT (PLY1083), Ypk1-AS (PLY1098), and Ypk1- AS yap1Δ (PLY1527), were grown in SCD-Ura media, either with or without 20 mM NAC, then treated for 1 hr with 0.5 μM 2,3-DMB-PPI or with 1 mM H2O2. All strains were incubated with 10 μM 2,7-Dichlorofluorescin diacetate (DCF) for the last 30 min prior to imaging by fluorescence microscopy. Quantification represents percentage of 200–300 cells labelled with DCF, from at least three experiments. (B) WT (PLY062), ypk1Δ (PLY521), and ypk2Δ (PLY1360) cells were grown in SCD media, and ROS was determined and quantified as in (A). (C) WT (INA17-4D), pkh1/2-ts (INA106-3B), torc2-ts (PLY1134), and PLY1134 transformed with Ypk1D242A (pPL240) were grown overnight at 25°C, then shifted to 37°C or 30°C as noted for 1 hour. ROS was determined and quantified as in (A). (D) Ypk1-AS cells were transformed with either Ypk1-WT (pPL433), Ypk1T504A (pPL530), or Ypk1S644A/T662A (pPL491). Cells were grown in SCD-Ura/-Leu media, and ROS was determined and quantified as in (A). Protein extracts were prepared and resolved by SDS/PAGE and immunoblotted with α-HA antibody. (E) Ypk1-WT, Ypk1-AS, and Ypk1-AS yap1Δ (PLY1527) were grown on SCD-Ura plates containing 0.5 μM 2,3-DMBPPI with and without 0.5 mM H2O2 for approximately 2 days.
We next treated Ypk1-AS cells with the inhibitor 2,3-DMB-PP1 for 1 hour, which resulted in a four-fold increase in ROS compared to addition of 2,3-DMB-PP1 to inhibitor-insensitive Ypk1-WT cells (54% versus 12% DCF-positive cells) (Figure 1A). Consistent with this difference being related to ROS, we observed a further increase in DCF-positive cells (68%) when Ypk1-AS cells were deleted for YAP1 (Figure 1A), as yap1Δ cells are known to be deficient in removing ROS (Kuge et al., 1997). Moreover, treating Ypk1-AS cells with N-acetyl cysteine (NAC), a ROS scavenger, resulted in a partial reduction in ROS (30% DCF-positive cells) (Figure 1A). Because NAC is a specific scavenger of free hydroxyl radicals (Brennan and Schiestl, 1997), the incomplete rescue we observed is likely due to additional forms of radicals being produced in Ypk1-AS cells.
The low levels of ROS in Ypk1-WT cells (ypk1Δypk2Δ + pYpk1-WT), which lack endogenous Ypk2 activity, suggested Ypk2 does not contribute significantly to suppression of ROS. We tested this directly by using single gene deletions, where we observed that ypk1Δ but not ypk2Δ cells have increased ROS (Figure 1B). Because ROS is known to inhibit growth, increased ROS may in part explain the slow growth phenotype associated with ypk1Δ but not ypk2Δ cells (Chen et al., 1993) (see below).
For Ypk1 to be activated, it must be first phosphorylated by TORC2, which allows for subsequent phosphorylation by Pkh1/2 (Casamayor et al., 1999; Niles et al., 2012). To test the role of TORC2 and Pkh1/2 in Ypk1-dependent regulation of ROS, we utilized temperature sensitive pkh1/2-ts (pkh1D398G pkh2Δ) and torc2-ts (avo3-30) alleles (Aronova et al., 2008; Inagaki et al., 1999) to reduce the activity of Pkh1/2 and TORC2, respectively. After shifting pkh1/2-ts cells to 37°C, we found that ROS increased significantly (53% DCF-positive cells). We also observed elevated ROS in torc2-ts cells grown at both permissive (25°C) and non-permissive (30°C) temperatures (Figure 1C). Increased ROS at 25°C is consistent with previous findings that TORC2 activity is compromised in this mutant even at the permissive temperature (Aronova et al., 2008; Niles et al., 2012). We demonstrated further that increased ROS in torc2-ts cells was specific to Ypk1 signaling, as expression of a constitutively active allele of Ypk1 (Ypk1D242A) (Niles et al., 2012), which bypasses the need for TORC2-dependent phosphorylation, reduced nearly all ROS in torc2-ts cells grown at 30°C (Figure 1C). In addition, we transformed Ypk1-AS cells with plasmids that expressed either WT Ypk1 or versions of Ypk1 that carried mutations at the Pkh1/2 (Ypk1T504A) or the TORC2 phosphorylation sites (Ypk1S644A/T662A) (Niles et al., 2012). We observed that expression of WT Ypk1 suppressed elevated ROS in Ypk1-AS cells, but not the Ypk1 phosphorylation-site mutants, despite the fact that all forms produced an equal level of Ypk1 protein (Figure 1D). From these results, we concluded that Ypk1 must be phosphorylated and activated by both TORC2 and Pkh1/2 to prevent elevated ROS.
As cells with increased ROS are more sensitive to treatment with H2O2 (Lee et al., 2011), we examined the sensitivity of Ypk1-AS cells to H2O2. We plated Ypk1-AS cells onto solid agar plates containing sub-lethal concentrations of inhibitor, either in the presence or absence of 0.5 mM H2O2, where Ypk1-WT cells grew similarly on inhibitor-containing plates with or without H2O2 (Figure 1C). By contrast, growth of Ypk1-AS cells was reduced significantly in the presence of H2O2 (Figure 1C). Moreover, deletion of YAP1 from Ypk1-AS cells completely inhibited their growth in the presence of analog and H2O2 (Figure 1D). Taken together, our data demonstrate that TORC2/Ypk1 signaling is essential for suppression of ROS.
TPK3-dependent mitochondrial respiration is a source for ROS in Ypk1-AS cells
As mitochondria are a known producer of free radicals within cells, we examined the potential contribution of mitochondria as a source of ROS in Ypk1-deficient cells. To do this, we monitored ROS in Ypk1-AS cells that were made respiratory deficient by loss of mitochondrial DNA (termed Ypk1-AS rho0 cells). We observed that ROS in Ypk1-AS rho0 cells were reduced significantly compared to Ypk1-AS cells (26 % versus 54% DCF-positive cells), suggesting Ypk1 signaling influences mitochondrial respiratory activity (Figure 2A). To directly examine the role of mitochondrial respiration on ROS, we treated Ypk1-AS cells with 30 μM myxothiazol, a respiratory inhibitor that blocks Complex III of the electron transport chain (Machida et al., 1998), where a similar decrease in ROS was observed (Figure 2A). As increased ROS from mitochondria often correlates with defects in mitochondrial membrane potential (MMP), we measured MMP in Ypk1-AS cells using the fluorescent dye DiOC6 (Graef and Nunnari, 2011). Indeed, we observed that inhibition of Ypk1 resulted in a 46% decrease in MMP, relative to Ypk1-WT cells (Figure 2B). These results demonstrate a link between TORC2/Ypk1 signaling and mitochondrial activity and identify mitochondria as a source for ROS in Ypk1-AS cells.
Figure 2. PKA-dependent mitochondrial ROS production following Ypk1 inhibition.

(A) Ypk1-WT (PLY1083), Ypk1-AS (PLY1098), Ypk1-AS rho0 (PLY1528), Ypk1-AS tpk3Δ (PLY1529), and Ypk1-AS tpk3Δ rho0 (PLY1530) were grown in SCD-Ura media, then treated for 1 hr with 0.5 μM 2,3-DMB-PPI or with 30 μM myxothiazol (myxo) for 70 min (including a 10 min pre-treatment) where noted. ROS was determined and quantified as in Figure 1A. (B) Ypk1-WT, Ypk1-AS, and Ypk1-AS tpk3Δ were grown in SCD-Ura media, then treated for 1 hr with 0.5 μM 2,3-DMB-PPI or with 50 μM CCCP. All strains were incubated with 20 μM 3,3′-dihexyloxacarbocyanine iodine (DiOC6) for the last 5 min prior to imaging by fluorescence microscopy. Quantification represents pixel intensities from several mitochondrial tubules from at least 5 different cells. (C) Ypk1-WT, Ypk1-AS, and Ypk1-AS tpk3Δ cells transformed with pPL585 (Cki1) were grown in SCD-Ura/-Leu media, then treated for 1 hr with 0.5 μM 2,3-DMB-PPI or 30 min with 200 nM rapamycin (Rap). Protein extracts were prepared and resolved by SDS/PAGE and immunoblotted with α-Myc antibody. Quantification describes the ratio of Cki-P/Cki1 relative to Ypk1- WT for three separate experiments. (D) PDE2 transcript levels were compared between Ypk1-AS and Ypk1-WT that had been treated with 0.5 μM 2,3-DMB-PPI for the indicated times (data from (Niles et al., 2012)). (E) Ypk1-WT, Ypk1-AS, and Ypk1-AS and Ypk1-AS tpk3Δ cells both transformed with pPL582 (PDE2) were grown in SCD-Ura/-Leu media, then treated for 1 hr with 0.5 μM 2,3-DMB-PPI. ROS was determined and quantified as in Figure 1A.
ROS produced by mitochondria has been shown to increase following inappropriate activation of Tpk3, one of three PKA catalytic subunits (Leadsham and Gourlay, 2010). To test whether mitochondrial ROS in Ypk1-AS cells was influenced by this kinase, we examined ROS in Ypk1-AS cells following deletion of TPK3. Indeed, we observed that ROS was reduced significantly in Ypk1-AS tpk3Δ cells compared to Ypk1-AS cells (Figure 2A). Moreover, we observed very similar levels of ROS in Ypk1-AS tpk3Δ and Ypk1-AS tpk3Δ rho0 cells (34% versus 31% DCF-positive cells), as would be expected if Tpk3 contributes to ROS produced by mitochondria (Figure 2A). In agreement with these findings, we observed that deletion of TPK3 from Ypk1-AS cells restored MMP (Figure 2B).
An important prediction from the above results was that Tpk3-dependent PKA activity would be elevated in Ypk1-AS cells. We therefore examined PKA activity in vivo using a PKA substrate reporter plasmid, which encodes the first 200 amino acids of the protein Cki1, which possesses two known PKA phosphorylation sites (Deminoff et al., 2006). Phosphorylation by PKA results in a slower mobility species on SDS-PAGE gels, as detected by Western blot (referred to as Cki1-P). We observed an approximate two-fold increase in the Cki1-P/Cki1 ratio in Ypk1-AS compared to Ypk1-WT cells, thus confirming that PKA activity was increased following Ypk1 inhibition (Figure 2C). This increase was similar to treating cells with rapamycin, an inhibitor of TORC1, which is known to increase PKA activity (Deminoff et al., 2006). Importantly, we observed that deletion of TPK3 from Ypk1-AS cells reduced significantly Cki1 phosphorylation, indicating Tpk3 is indeed primarily responsible for increased PKA activity in Ypk1-AS cells (Figure 2C). Together from these results we conclude that Ypk1 and PKA interact functionally to regulate mitochondrial ROS accumulation.
PKA activity is regulated positively by cAMP, where higher levels of this molecule result in greater PKA activation. PDE2 encodes the phosphodiesterase that catalyzes the breakdown of cAMP (Leadsham and Gourlay, 2010). Interestingly, we observed that PDE2 mRNA levels declined significantly in Ypk1-AS cells, suggesting elevated PKA activity and a concomitant increase in ROS may result from decreased PDE2 expression (Niles et al., 2012) (Figure 2D). We tested this directly by overexpressing PDE2 in Ypk1-AS cells, where a significant reduction in ROS was observed (Figure 2D). Because we observed similar levels of ROS in both Ypk1-AS tpk3Δ as well as Ypk1-AS tpk3Δ cells overexpressing PDE2, these data suggest that Pde2 specifically regulates Tpk3-dependent mitochondrial ROS production in Ypk1-AS cells.
Regulation of vacuolar acidification and ROS by the Fpk1 kinase
Because inhibition of mitochondrial respiration did not eliminate completely ROS from Ypk1-deficient cells, we examined other known targets of TORC2/Ypk1 signaling to identify additional components that might contribute to ROS accumulation. One recently identified target is the phospholipid flippase kinase Fpk1, where direct phosphorylation by Ypk1 inhibits its activity (Roelants et al., 2010). To test whether overactive Fpk1 plays a role in ROS accumulation following inhibition of Ypk1, we deleted FPK1 from Ypk1-AS cells and measured ROS. Indeed, we observed that ROS dropped significantly in Ypk1-AS fpk1Δ cells compared to Ypk1-AS cells (23% versus 54% DCF-positive cells) (Figure 3A). Deletion of three of the five known flippase genes (DNF1, DNF2, and DNF3) also resulted in a significant reduction in ROS in Ypk1-AS cells, indicating that Fpk1-dependent ROS was due primarily to its role in flippase activation (Figure 3A).
Figure 3. Overactive Fpk1 results in defects in vacuolar acidification and ROS.
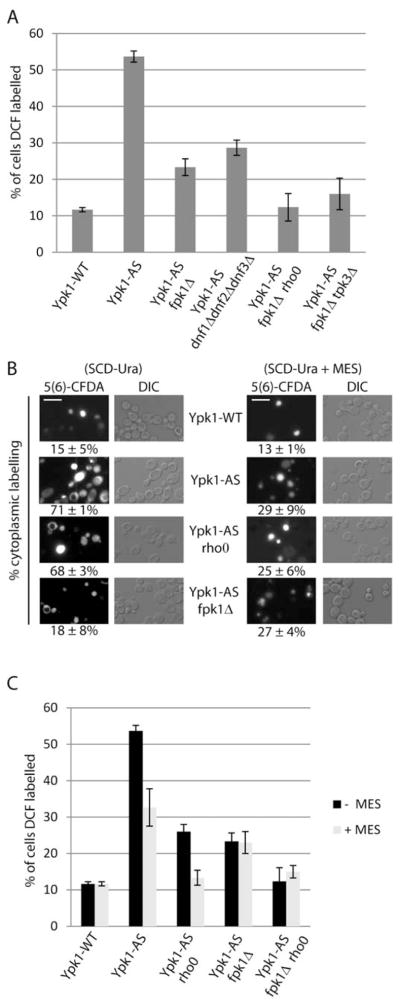
(A) Ypk1-WT (PLY1083), Ypk1-AS (PLY1098), Ypk1-AS fpk1Δ (PLY1533), Ypk1-AS dnf1Δdnf2Δdnf3Δ (PLY1534), Ypk1-AS fpk1Δ rho0 (PLY1536), Ypk1-AS fpk1Δtpk3Δ (PLY1535), were grown in SCD-Ura media, then treated for 1 hr with 0.5 μM 2,3-DMB-PPI. ROS was determined and quantified as in Figure 1A. (B) Ypk1-WT, Ypk1-AS, Ypk1-AS fpk1Δ, Ypk1-AS rho0 (PLY1528) were grown in either SCD-Ura or SCD-Ura + 50 mM MES pH 6.2, treated with 0.5 μM 2,3-DMB-PPI for 1 hr, and incubated for the last 30 min with 5 μM 5(6)-Carboxyfluorescein diacetate (5(6)-CFDA). Quantification corresponds to the percent of labeled cells with cytoplasmic labeling, including cells with both vacuolar and extra-vacuolar labeling, for three separate experiments. Scale bar, 5 μm. (C) Ypk1-WT, Ypk1-AS, Ypk1-AS rho0, Ypk1-AS fpk1Δ, and Ypk1-AS fpk1Δ rho0 were grown in either SCD-Ura or SCD-Ura + 50 mM MES pH 6.2, and treated with 0.5 μM 2,3-DMB-PPI for 1 hr. ROS was determined and quantified as in Figure 1A.
As a similar reduction in ROS was observed when Ypk1-deficient cells were either made respiratory incompetent or deleted for FPK1 (compare Figures 2A and 3A), this raised the question whether mitochondria and Fpk1 act within the same pathway or in different pathways to regulate ROS. Accordingly, we constructed a respiratory deficient Ypk1-AS fpk1Δ rho0 strain and measured ROS, which, remarkably, exhibited levels of ROS that were very similar to Ypk1-WT cells (Figure 3A). This result demonstrated that the ROS from overactive Fpk1 was from a source different from mitochondrial respiration and that both sources account for most, if not all, of ROS observed in Ypk1-deficient cells. Importantly, WT levels of ROS were also observed in Ypk1-AS fpk1Δ tpk3Δ cells, consistent with our conclusion that Tpk3 and mitochondria function within the same pathway to modulate ROS (Figure 3A).
Results of recent studies have demonstrated that both phospholipid flippase activity and oxidative stress are linked to maintenance of vacuolar acidification (Brett et al., 2011; Thorpe et al., 2004), suggesting loss of vacuolar acidification might contribute to Fpk1-dependent ROS in Ypk1-deficient cells. To test this possibility, we used the pH reactive dye 5(6)-carboxyfluorescein diacetate (5(6)-CFDA) (Preston et al., 1989) to examine whether vacuole acidification was perturbed in Ypk1-AS cells. In Ypk1-WT cells, 5(6)-CFDA labeling was restricted to the vacuole in most cells, indicating normal vacuolar acidification (Figure 3A). By contrast, in Ypk1-AS cells, 5(6)-CFDA labeling was either greatly reduced or completely absent from vacuoles and instead there was a concomitant increase in cytoplasmic labeling, indicative of cytoplasmic acidification (Preston et al., 1989) (Figure 3B). This change was not related to mitochondrial respiration, as a majority of Ypk1-AS rho0 cells also displayed similar perturbations in vacuolar labeling (Figure 3B). By contrast, deletion of FPK1 from Ypk1-AS cells largely rescued these defects, demonstrating that overactive Fpk1 results in defects in vacuolar structure and/or function to cause changes in acidification. Consistent with these findings, we observed that we could neutralize a significant portion of the intracellular acidification defects as well as elevated ROS in Ypk1-AS and Ypk1-AS rho0 cells, but observed no change in Ypk1-AS fpk1Δ cells, by supplementing the growth media with the buffer MES (pH 6.2) (Figure 3B and 3C). Together, these results support the conclusion that intracellular acidification in Ypk1-AS cells was caused by overactive Fpk1 and results in a unique source of ROS that is independent from mitochondria.
Regulation of vacuolar acidification and ROS by sphingolipids
Sphingolipids have been shown recently to regulate both ROS (Kajiwara et al., 2012) as well as vacuolar morphology and function (Chung et al., 2003; Faergeman et al., 2004). We therefore hypothesized that decreased levels of sphingolipids may act in concert with overactive Fpk1 to promote vacuolar acidification defects and ROS in Ypk1-AS cells. Accordingly, we first tested whether sphingolipid levels were altered in Ypk1-AS cells, by using LC-MS/MS to measure levels of the major species of ceramide in yeast, C26-PHS, where a significant decrease was observed relative to Ypk1-WT cells (Figure 4A). We also examined levels of precursors to ceramides, the LCBs dihydrosphingosine (DHS) and phytosphingosine (PHS), as well as their phosphorylated forms (DHS-P and PHS-P). We observed that Ypk1-AS cells possessed a significant reduction in PHS and DHS and a commensurate increase in PHS-P and DHS-P (Figure 4B and C). These changes in ceramides, LCBs and LCBPs were remarkably similar to what we observed previously within torc2-ts cells (Aronova et al., 2008). Importantly, a reduction in ceramides is consistent with the hypothesis that reduced levels of sphingolipids contribute to the accumulation of ROS in Ypk1-AS cells.
Figure 4. Regulation of vacuolar acidification and ROS by sphingolipids.

(A–C) Ypk1-WT (PLY1083) and Ypk1-AS (PLY1098) cells were grown in SCD-uracil, and treated with 0.5 μM 2,3-DMB-PPI for 1 hr. Lipids were extracted, and levels were analyzed by mass spectroscopy. (D) Ypk1-WT, Ypk1-AS, Ypk1-AS lcb4Δ (PLY1556), Ypk1-AS fpk1Δ (PLY1533), Ypk1-AS fpk1Δ lcb4Δ (PLY1558) cells were grown in SCD-uracil, with 4 μM PHS where noted, and treated with 0.5 μM 2,3-DMB-PPI for 1 hr. ROS was determined and quantified as in Figure 1A. (E) Ypk1-WT, Ypk1-AS, and Ypk1-AS lcb4Δ were grown in SCD-Ura, with 4 μM PHS where noted, and treated as in Figure 3B. (F) WT (PLY062) and fpk1Δ (PLY1551) were grown in either SCD or SCD + 50 mM MES pH 6.2, and treated with 1.25 μM myriocin (Myr) for 2 hrs. 5 μM 5(6)-CFDA was added for the last 30 min. Quantification as in Figure 3B. (G) Same as in (F), except ROS was determined and quantified as in Figure 1A. (H) WT cells grown in SCD media with or without 20 mM NAC pH 8.0 were treated with either DMSO, 1.25 μM myriocin (Myr), or 1.25 μM aureobasidin A (AbA) for 1 hr. lag1Δlac1Δ + pTet-LAG1 (PLY1501) cells were grown in SCD with or without 20 mM NAC were treated with 30 μg/ml doxycycline for 2 days (cultures diluted and re-treated 2 times). ROS was determined and quantified as in Figure 1A.
To test directly if sphingolipid levels affect ROS in Ypk1-AS cells, we first utilized an approach that we used previously to increase sphingolipid levels in torc2-ts cells (Aronova et al., 2008). Specifically, addition of PHS to torc2-ts cells, which also carry a deletion for LCB4, the major LCB kinase, increased synthesis of ceramides to a level that was sufficient to restore growth and viability (Aronova et al., 2008). Here, we observed that treating Ypk1-AS lcb4Δ cells with PHS significantly reduced ROS (29% versus 54% DCF positive cells), indicating sphingolipids are indeed involved in Ypk1-dependent regulation of ROS (Figure 4D). Moreover, we observed that levels of ROS were similar in Ypk1-AS fpk1Δ cells, Ypk1-AS lcb4Δ cells treated with PHS, and in Ypk1-AS fpk1Δlcb4Δ cells treated with PHS, suggesting that sphingolipids and Fpk1 regulate ROS within the same pathway (Figure 4D). To test whether sphingolipid depletion affected ROS due to defects in vacuolar acidification, we treated Ypk1-AS lcb4Δ cells with PHS and monitored acidification with 5(6)-CFDA. We found that, similar to deletion of Fpk1, addition of PHS to Ypk1-AS lcb4Δ cells rescued the vacuolar acidification defect in Ypk1-AS cells (Figure 4E). Thus, Fpk1 and sphingolipids both regulate ROS through maintenance of vacuolar acidification.
We next took a second approach to examine further the connection between Fpk1 and sphingolipids, by treating WT and fpk1Δ cells with the sphingolipid biosynthesis inhibitor drug myriocin and then measured vacuolar acidification. We observed that, like inhibition of Ypk1, treating WT cells with myriocin resulted in decreased vacuolar and increased cytoplasmic acidification, both of which could be rectified by supplementing myriocin-treated media with MES (pH 6.2) (Figure 4F). Importantly, deletion of FPK1 also rescued these myriocin-induced acidification phenotypes (Figure 4F), confirming a role for Fpk1 in sphingolipid-dependent changes in vacuolar acidification. Moreover, these observed acidification defects correlated with changes in ROS, in that treating cells with myriocin caused a significant increase in ROS that could be reversed either by the addition of MES or by deletion of FPK1 (Figure 4G). To more precisely determine the sphingolipid species that was required to regulate vacuolar acidification, we inhibited sphingolipid biosynthesis at two additional downstream steps, formation of ceramides and formation of the complex sphingolipid species inositol-phosphoceramide (IPC) (Figure 4H and I). We observed that inhibition of both steps resulted in increased ROS in a manner that could be prevented by addition of the ROS scavenger NAC, demonstrating that biosynthesis of IPC at least is necessary to prevent ROS (Figure 4H & I).
Sphingolipid-mediated ROS activates TORC2/Ypk1 signaling
A link between sphingolipids and TORC2 phosphorylation of Ypk1 has been previously demonstrated, however, the molecular basis for this regulation remains incompletely characterized (Berchtold et al., 2012; Roelants et al., 2011). Given our results above, we wanted to test whether increased Ypk1 phosphorylation following sphingolipid depletion was dependent on ROS. Thus, we pre-treated WT cells with NAC prior to treatment with myriocin, and measured TORC2-dependent phosphorylation of Ypk1 at the hydrophobic motif phosphorylation site (Serine 662) (Niles et al., 2012). We observed that myriocin-induced hyper-phosphorylation of Ypk1 was significantly attenuated by addition of NAC (Figure 5A). Similar results were observed when we interrupted sphingolipid biosynthesis at the formation of ceramides and IPC, consistent with increased phosphorylation of Ypk1 following sphingolipid depletion due specifically to increased ROS (Figure 5A).
Figure 5. Increased ROS activates TORC2 phosphorylation of Ypk1.

(A) WT (PLY062) and lag1Δlac1Δ + pTet-Lag1 (PLY1501) cells transformed with pPL215 (Ypk1-HA) were grown as in SCD-Ura as in Figure 4H. Cells were harvested and lysed, and the resulting protein extracts were resolved by SDS/PAGE and immunoblotted with α-phospho-Ypk1 (T662), α-HA, and α-G6PDH (as a loading control) antisera. Quantification is relative to untreated WT from each strain, after normalizing to the α-HA signal. (B) Pil1- mCherry tagged W303 co-expressing Slm1-GFP (PLY1555) were grown in SCD minus uracil media, with or without 20 mM NAC pH 8.0 overnight, then treated with DMSO or 1.25 μM Myriocin for 1h. Top section images were collected by confocal microscopy. Inlays depict magnified regions of Slm1 (left), Pil1 (middle), and overlay (right). (C) Colocalization was determined using the Pearson coefficient (ImageJ software).
Because increased phosphorylation of Ypk1 following treatment with myriocin requires the relocalization of Slm1 from eisosomes to the MCT (Berchtold et al., 2012), we examined whether this step was ROS-dependent as well using Slm1-GFP and fluorescence microscopy. As described previously (Berchtold et al., 2012), in untreated cells a significant proportion of Slm1-GFP is localized to punctate structures marked by the eisosome component Pil1-mCherry and is displaced from eisosomes following myriocin treatment, a result that we confirmed (Figure 5B and C). Remarkably, we observed that this relocalization was prevented completely by pre-incubation with NAC (Figures 5B and 5C). We concluded from these findings that ROS is the critical signal within a feedback loop that links sphingolipid depletion to phosphorylation of Ypk1 by TORC2, which acts both to increase sphingolipid biosynthesis as well as reduce ROS.
Regulation of ROS by Ypk1 is essential for growth and survival
One important function of homeostatic feedback mechanisms is to ensure survival of cells under stress. Therefore, we asked whether the essential function of Ypk1 is related to its suppression of ROS accumulation. Accordingly, we examined the growth of strains on solid agar plates containing 1 μM 2,3-DMB-PP1, which was sufficient to prevent growth of Ypk1-AS but not Ypk1-WT cells (Figure 6A). We observed that deletion of FPK1 resulted in partial rescue of growth for Ypk1-AS cells and that there was additional improvement by eliminating mitochondrial respiration, as Ypk1-AS fpk1Δ rho0 cells grew almost as well as Ypk1-WT cells (Figure 6A). Because the rescue of growth in Ypk1-AS fpk1Δ cells required Yap1, we concluded that this rescue was due specifically to a reduction in ROS (Figure 6B). In addition, while loss of mitochondrial respiration alone was insufficient to rescue growth, we observed that neutralizing cytoplasmic acidification and reducing ROS further by adding MES to plates enabled Ypk1-AS rho0 cells to grow nearly as well as Ypk1-WT cells (Figure 6C). We concluded from these results that elevated ROS is a major cause of growth inhibition in Ypk1 deficient cells.
Figure 6. ROS prevention is an essential function of TORC2/Ypk1 signaling.

(A) Ypk1-WT (PLY1083), Ypk1-AS (PLY1098), Ypk1-AS rho0 (PLY1528), Ypk1-AS fpk1Δ (PLY1533), and Ypk1-AS fpk1Δ rho0 (PLY1536) were grown on SCD-Ura plates with and without 1 μM 2,3-DMB-PPI for approximately 2 days. (B) Ypk1-AS, Ypk1-AS fpk1Δ and Ypk1-AS fpk1Δyap1Δ (PLY1537) were grown on SCD-Ura plates with and without 1 μM 2,3-DMB-PPI for approximately 2 days. (C) Ypk1-WT, Ypk1-AS, and Ypk1-AS rho0 were grown on SCD-Ura plates containing 1 μM 2,3-DMB-PPI and with or without 50 mM MES pH 6.2 for approximately 2 days. (D) WT (PLY062) were grown overnight in YPD. Equal numbers of cells were serially diluted and plated on YPD control plate, or YPD plus 1μM myriocin, or plus 1μM myriocin and 20mM NAC, and grown for approximately 2 days. (E) Ypk1-WT, Ypk1-AS, Ypk1-AS rho0, Ypk1-AS fpk1Δ, and Ypk1-AS fpk1Δ rho0 were grown in SCD-Ura, then treated with 5 μM 2,3-DMB-PPI for 5 hours, then equal number of cells were plated onto SCD-Ura plates without inhibitor, and grown for approximately 2 days. Number of colonies were counted, and normalized to Ypk1-WT.
As the accumulation of ROS also leads to a rapid decrease in cell viability (Cabiscol et al., 2000), we hypothesized that growth inhibition was due to an increase in ROS-mediated cell killing in Ypk1-AS cells. To test this, we performed a short-term inhibition of Ypk1-AS in liquid cell culture, followed by plating an equal number of cells onto solid agar plates without inhibitor and counted the number of resulting colonies formed after two days. Thus, while only 10% of Ypk1-AS cells survived, approximately 40% of Ypk1-AS fpk1Δ rho0 cells survived brief treatment with inhibitor (Figure 6E). These differences were specific for Ypk1 inhibition, as all four strains grew identically in the absence of inhibitor. Taken together, we concluded that regulation of ROS by TORC2/Ypk1 signaling is essential for maintaining cell growth and viability.
Finally, previous studies have shown that a kinase dead version of Fpk1 or deletion of DNF1/2/3 afforded greater resistance to myriocin (Roelants et al., 2010). Based on our present results, we hypothesized that elevated ROS is responsible for growth inhibition following sphingolipid depletion. To test this, we plated WT cells on YPD plates that contained either myriocin or myriocin plus NAC, and compared this to growth on untreated plates. Thus, whereas no growth was observed on plates containing myriocin, growth was restored on plates that included NAC (Figure 6D). Thus, we conclude that ROS is a primary cause of cell death following sphingolipid depletion.
Discussion
Our findings presented here demonstrate that TORC2/Ypk1 signaling plays a critical role in both modulating as well as responding to intracellular levels of ROS. In particular, we have shown that Ypk1 activity suppresses ROS that accumulate through two distinct sources, one of which results from impaired mitochondrial respiration and reduced mitochondrial membrane potential (MMP), and a second source that is attributable to defects in vacuolar acidification and aberrant acidification of the cytoplasm. Importantly, we find that intracellular levels of sphingolipids contribute both to maintenance of vacuolar acidification as well as suppression of ROS. Remarkably, the ROS that results from sphingolipid depletion leads to hyper-phosphorylation and activation of Ypk1 by TORC2, wherein activated Ypk1 in turn functions as a positive regulator of sphingolipid biosynthesis. Thus our findings reveal an important and novel role for ROS as a signal to activate TORC2/Ypk1 signaling, both to maintain appropriate levels of sphingolipids as well as suppress the accumulation of ROS.
The identification of mitochondria as a source of ROS in Ypk1-deficient cells reveals an unexpected link between TORC2/Ypk1 signaling and PKA-mediated regulation of mitochondrial activity, specifically involving the Tpk3 catalytic subunit of PKA. Previous studies have established complex regulatory relationships between TORC1 and PKA, but so far little is known about how TORC2 may interact functionally with PKA. Our results are consistent with prior findings that Tpk3 is required for increased mitochondria-derived ROS following activation of Ras, an upstream activator of PKA (Gourlay and Ayscough, 2006). In addition, overactive Tpk3 has been shown to repress the expression of genes that encode components of the mitochondrial electron transport chain, suggesting a possible mechanism by which MMP is decreased and ROS is increased in Tpk3-activated cells (Leadsham and Gourlay, 2010). Interestingly, our own DNA microarray analyses identified many of these same target genes as being down regulated in Ypk1-deficient cells (Niles et al., 2012). Furthermore, here we have now identified Ypk1-mediated repression of PDE2, which encodes the cAMP phosphodiesterase that negatively regulates PKA activity, as a potential mechanism by which Tpk3 activity is increased in Ypk1-deficient cells. Potential factors that regulate PDE2 expression and/or mRNA stability and that thus could be a target for TORC2/Ypk1 regulation remain to be identified.
Our discovery that defects in vacuolar acidification represent a second source of ROS in Ypk1-deficient cells emphasize emerging connections between vacuolar and mitochondrial function, including a recent study where changes in vacuolar pH are linked to alterations in MMP and result in decreased replicative lifespan in yeast (Hughes and Gottschling, 2012). Moreover, because we demonstrate that maintenance of vacuolar pH is affected both by the phospholipid flippase Fpk1 as well as sphingolipids, our data reveal that the proper content as well as distribution of both types of lipids are likely to be important for normal vacuolar acidification. Proper acidification of the vacuole depends on the vacuolar proton gradient that is generated by the vacuolar H+-ATPase (V-ATPase), where defects in its activity have been linked to cytoplasmic acidification and the generation of ROS (Milgrom et al., 2007). The yeast V-ATPase consists of at least 14 different protein subunits that assemble into two distinct complexes (V0 and V1), which then form two different sub-populations of enzyme, one that is retained with the Golgi/endosomal network and another that is transported to the vacuole (Manolson et al., 1994; Nishi and Forgac, 2002). Hyperactive Fpk1 within Ypk1-deficient cells could feasibly disrupt any number of steps in V-ATPase assembly and/or trafficking, given that phospholipid flippase regulation is crucial for proper protein sorting within both endosomes as well as the vacuole (Hua et al., 2002). Similarly, appropriate levels of sphingolipids are also known to be important for generation of a functional V1 domain (Chung et al., 2003). The precise functional relationship between Fpk1 and sphingolipids, in particular with respect to maintenance of vacuolar acidification and their links to TORC/Ypk1 signaling, remains to be determined.
Perhaps one of the most significant findings presented here is that accumulation of ROS following sphingolipid depletion is responsible for the changes in localization of Slm1 from eisosomes to the MCT, where TORC2-mediated phosphorylation of Ypk1 occurs. Previously it was suggested that loss of sphingolipids by treatment with myriocin results in deformation of the PM, an effect that could be mimicked by mechanical membrane “stretching”, and that this induces a stress that presumably disrupts interactions between eisososmes and Slm1 (Berchtold et al., 2012). Based upon our data we suggest that ROS generated by sphingolipid depletion may affect directly the association of Slm1 with eisosomes. Eisosomes are composed of dozens of proteins, including the core structural components Pil1 and Lsp1 (Walther et al., 2006). Interestingly, myriocin treatment is known to affect eisosome assembly as well as stability (Luo et al., 2008). Thus, should any of these proteins be sensitive to damage by ROS, this could explain in part changes in eisosome structure that perturb interactions with Slm1. Alternatively, Slm1 possesses two membrane binding domains, an F-BAR domain as well as a PH domain, both of which are required for localization to eisosomes (Olivera-Couto et al., 2011). Thus, damage to these membrane binding domains and/or oxidation of their target lipids could result in the release of Slm1 from eisosomes, allowing for subsequent relocalization to the MCT.
Because unregulated ROS is associated with numerous diseases, including neurodegenerative diseases like Alzheimer’s and Parkinson’s, cardiovascular disease, cancer as well as aging (Reviewed in (Finkel, 2005)), understanding the scope of signaling pathways that are responsible for ROS accumulation in eukaryotic cells remains of great importance. Therefore, our findings are important as they reveal that the conserved TORC2 signaling network plays an important role in the regulation of ROS and, moreover, demonstrate that ROS can act as an important signal for the activation of TORC2. We argue that features of the regulation we have identified in yeast are likely to be conserved in higher eukaryotes, given the extensive conservation of TORC2 signaling. For example, the P4 ATPase family of flippases, which we have shown are aberrantly hyperactivated in Ypk1-deficient cells, have been associated with several different disease states in mammals (Folmer et al., 2009). Furthermore, recent studies in mammalian cells have shown that signaling from mTORC2 to the downstream targets Akt and Sgk1 is influenced by ROS (Nayak et al., 2012). As both ROS and TORC2 activity are often elevated in cancer cells (Masri et al., 2007; Szatrowski and Nathan, 1991), an intriguing possibility is that ROS stimulates the activity of mTORC2, thus leading to activation of pro-survival pathways in these cells. As TORC2 inhibitors are developed for treatment of cancer, our findings presented suggest that specifically targeting the ROS-related stress responsive functions of TORC2 signaling represents a novel avenue for therapeutic development.
Methods
Strains, Media, and Plasmids
Yeast strains and plasmids used in this study are listed in Table 1. Culture medium used was synthetic complete dextrose (SCD) (0.8% yeast nitrogen base without amino acids, pH 5.5, 2% dextrose) supplemented with amino acids as described previously (Sherman, 1991). All yeast transformations were conducted using a lithium acetate procedure (Geitz and Woods, 1998). Strains were made respiratory deficient (rho0) by treating with 25 μg/ml ethidium bromide for 16 hours, as described in (Fox et al., 1991). Construction of deletion strains was performed as described previously (Dilova et al., 2004; Guldener et al., 1996). Construction of expression plasmids was performed by PCR amplification, with mutations introduced by PCR SOEing. pPL547 was made by inserting the Tet-repressible promoter from pCM184 (ATCC) before Lag1 in pRS315 using the NotI and HindIII restriction sites. pPL585 was constructed by removing the entire cassette from pPHY2328 (Deminoff et al., 2006) with the restriction enzymes XhoI and SacI, and ligating it into pRS425.
Table 1.
S. cerevisiae strains and plasmids used in this study.
| Strain | Genotype | Source |
|---|---|---|
| PLY062 | W303α | (Nasmyth et al., 1990) |
| PLY521 | W303α, ypk1::TRP | This study |
| PLY1083 | W303α, except ypk1::TRP1 ypk2::HIS3 + [pPL216] | (Niles et al., 2012) |
| PLY1098 | W303α, except ypk1::TRP1 ypk2::HIS3 + [pPL220] | This study |
| PLY1134 | W303α, except avo3-30-MYC:TRP1 | (Niles et al., 2012) |
| PLY1360 | W303α, except ypk2::HIS3 | This study |
| INA17-4D | MATa ura3 leu2 his2 trp1 ade1 | (Inagaki et al., 1999) |
| INA106-3B | INA17-4D, except pkh1 D398G pkh2::Leu2 | (Inagaki et al., 1999) |
| PLY1501 | LHYa, except lac1::HIS lag1::TRP + [pPL547] | This study |
| PLY1527 | W303α, except ypk1::TRP1 ypk2::HIS3 yap1::KanMX + [pPL220] | This study |
| PLY1528 | W303α, except ypk1::TRP1 ypk2::HIS3 rho0 + [pPL220] | This study |
| PLY1529 | W303α, except ypk1::TRP1 ypk2::HIS3 tpk3::KanMx + [pPL220] | This study |
| PLY1530 | W303α, except ypk1::TRP1 ypk2::HIS3 tpk3::KanMx rho0 + [pPL251] | This study |
| PLY1533 | W303α, except ypk1::TRP1 ypk2::HIS3 fpk1::KanMx + [pPL220] | This study |
| PLY1534 | W303α, except ypk1::TRP1 ypk2::HIS3 dnf3::markerless dnf2::NAT dnf1::KanMx + [pPL220] | This study |
| PLY1535 | W303α, except ypk1::TRP1 ypk2::HIS3 fpk1::NAT tpk3::KanMx + [pPL251] | This study |
| PLY1536 | W303α, except ypk1::TRP1 ypk2::HIS3 fpk1::KanMx rho0+ [pPL220] | This study |
| PLY1537 | W303α, except ypk1::TRP1 ypk2::HIS3 yap1::KanMx fpk1::NAT + [pPL220] | This study |
| PLY1551 | W303α, except fpk1::KanMx | This study |
| PLY1555 | W303α, except PIL1-mCherry:KanMx + [pPL580] | This study |
| PLY1556 | W303α, except ypk1::TRP1 ypk2::HIS3 lcb4::KanMx + [pPL220] | This study |
| PLY1558 | W303α, except ypk1::TRP1 ypk2::HIS3 fpk1::KanMx lcb4::markerless + [pPL220] | This study |
| Plasmid | Vector | Insert/ORF | Source |
|---|---|---|---|
| pRS315 | (Sikorski and Heiter, 1989) | ||
| pRS316 | (Sikorski and Heiter, 1989) | ||
| pRS425 | (Sikorski and Heiter, 1989) | ||
| pPL187 | (Niles et al., 2012) | ||
| pPL420 | (Niles et al., 2012) | ||
| pPL215 | pPL187 | YPK1 | (Niles et al., 2012) |
| pPL216 | pRS316 | YPK1 | This study |
| pPL220 | pRS316 | YPK1L424G | This study |
| pPL240 | pPL187 | YPK1D242A | (Niles et al., 2012) |
| pPL251 | pRS315 | YPK1L424G | (Niles et al., 2012) |
| pPL433 | pPL420 | YPK1 | (Niles et al., 2012) |
| pPL491 | pPL420 | YPK1S644A/T662A | This study |
| pPL530 | pPL420 | YPK1T504A | This study |
| pPL547 | pRS315 | pTet-LAG1 | This study |
| pPL580 | p416Met25 | SLM1-GFP | This study |
| pPL582 | pPL187 | PDE2 | This study |
| pPL585 | pRS425 | prCUP-6xMYC-cki12–200 (S125/130A) | This study |
Fluorescence Microscopy
DFC-DA, 5(6)CFDA, and DiOC6 imaging was performed using a Nikon E600 fluorescent microscope as described (Niles et al., 2012). Fluorescent protein imaging was performed using the spinning disc module of a Marianas SDC Real Time 3D Confocal-TIRF microscope (Intelligent Imaging Innovations, 3i) as described (Niles et al., 2012). Image capture and processing was done using SlideBook5 software (3i), and Photoshop (Adobe). Pearson coefficient for colocalization determined using ImageJ software (NIH) as previously described (French et al., 2008).
Western Blotting
Protein extracts were prepared using the NaOH cell lysis method (Dilova et al., 2004), and loaded onto SDS-PAGE gels and transferred to nitrocellulose membrane. Membranes were probed with α-phospho-Ypk1(T662) (Niles et al., 2012), α-Myc (1:1000; Covance), α-HA (12CA5, 1:5000; Covance), and α-G6PDH (1:100,000; Sigma-Aldrich) primary antibodies, and visualized using the appropriate secondary antibodies conjugated to IRDye (1:5000; LI-COR Biosciences) on the Odyssey Infrared Imaging System (LI-COR Biosciences). Images were quantified using ImageQuant software (GE Healthcare).
LC-MS/MS Analysis of LCBs, LCBPs, and Ceramides
Lipids were extracted and analyzed as described in (Aronova et al., 2008), using a Applied Biosystems Qtrap 4000 triple quadrupole mass spectrometer coupled to a Waters Acquity Ultra Performance LC system (UC Davis Metabolomics Core).
Statistical Analysis
Averages are presented with means ± standard error of the mean (SEM). P-values were calculated using Student’s t-test.
Highlights.
TORC2/Ypk1 signaling and sphingolipids regulate vacuolar acidification to prevent ROS.
Sphingolipid depletion results in ROS and activates TORC2/Ypk1 signaling.
Impaired Ypk1 activity also results in ROS via aberrant mitochondrial respiration.
Regulation of ROS is essential for TORC2/Ypk1-mediated cell growth and survival.
Acknowledgments
We thank K. Shokat for his generous sharing of the 2,3-DMB-PPI inhibitor, S. Lin for the reusable Kanr gene replacement system, P. Herman for pPHY2328 (prCUP-6xMYC-cki12–200 (S125/130A)), J. Sellers for assistance with microscopy, the MCB Light Microscope Imaging Facility, and members of the Powers lab, J. Nunnari, and M. Graef for helpful discussions. This work was supported by NIH Grant GM086387 (to TP).
Footnotes
Publisher's Disclaimer: This is a PDF file of an unedited manuscript that has been accepted for publication. As a service to our customers we are providing this early version of the manuscript. The manuscript will undergo copyediting, typesetting, and review of the resulting proof before it is published in its final citable form. Please note that during the production process errors may be discovered which could affect the content, and all legal disclaimers that apply to the journal pertain.
References
- Aronova S, Wedaman K, Aronov PA, Fontes K, Ramos K, Hammock BD, Powers T. Regulation of ceramide biosynthesis by TOR complex 2. Cell Metab. 2008;7:148–158. doi: 10.1016/j.cmet.2007.11.015. [DOI] [PMC free article] [PubMed] [Google Scholar]
- Berchtold D, Piccolis M, Chiaruttini N, Riezman I, Riezman H, Roux A, Walther TC, Loewith R. Plasma membrane stress induces relocalization of Slm proteins and activation of TORC2 to promote sphingolipid synthesis. Nat Cell Biol. 2012;14:542–547. doi: 10.1038/ncb2480. [DOI] [PubMed] [Google Scholar]
- Brennan RJ, Schiestl RH. Diaminotoluenes induce intrachromosomal recombination and free radicals in Saccharomyces cerevisiae. Mutat Res. 1997;381:251–258. doi: 10.1016/s0027-5107(97)00201-7. [DOI] [PubMed] [Google Scholar]
- Brett CL, Kallay L, Hua Z, Green R, Chyou A, Zhang Y, Graham TR, Donowitz M, Rao R. Genome-wide analysis reveals the vacuolar pH-stat of Saccharomyces cerevisiae. PLoS One. 2011;6:e17619. doi: 10.1371/journal.pone.0017619. [DOI] [PMC free article] [PubMed] [Google Scholar]
- Cabiscol E, Piulats E, Echave P, Herrero E, Ros J. Oxidative stress promotes specific protein damage in Saccharomyces cerevisiae. J Biol Chem. 2000;275:27393–27398. doi: 10.1074/jbc.M003140200. [DOI] [PubMed] [Google Scholar]
- Casamayor A, Torrance PD, Kobayashi T, Thorner J, Alessi DR. Functional counterparts of mammalian protein kinases PDK1 and SGK in budding yeast. Curr Biol. 1999;9:186–197. doi: 10.1016/s0960-9822(99)80088-8. [DOI] [PubMed] [Google Scholar]
- Chen P, Lee KS, Levin DE. A pair of putative protein kinase genes (YPK1 and YPK2) is required for cell growth in Saccharomyces cerevisiae. Mol Gen Genet. 1993;236:443–447. doi: 10.1007/BF00277146. [DOI] [PubMed] [Google Scholar]
- Chung JH, Lester RL, Dickson RC. Sphingolipid requirement for generation of a functional v1 component of the vacuolar ATPase. J Biol Chem. 2003;278:28872–28881. doi: 10.1074/jbc.M300943200. [DOI] [PubMed] [Google Scholar]
- Deminoff SJ, Howard SC, Hester A, Warner S, Herman PK. Using substrate-binding variants of the cAMP-dependent protein kinase to identify novel targets and a kinase domain important for substrate interactions in Saccharomyces cerevisiae. Genetics. 2006;173:1909–1917. doi: 10.1534/genetics.106.059238. [DOI] [PMC free article] [PubMed] [Google Scholar]
- Dilova I, Aronova S, Chen JC, Powers T. Tor signaling and nutrient-based signals converge on Mks1p phosphorylation to regulate expression of Rtg1.Rtg3p-dependent target genes. J Biol Chem. 2004;279:46527–46535. doi: 10.1074/jbc.M409012200. [DOI] [PubMed] [Google Scholar]
- Faergeman NJ, Feddersen S, Christiansen JK, Larsen MK, Schneiter R, Ungermann C, Mutenda K, Roepstorff P, Knudsen J. Acyl-CoA-binding protein, Acb1p, is required for normal vacuole function and ceramide synthesis in Saccharomyces cerevisiae. Biochem J. 2004;380:907–918. doi: 10.1042/BJ20031949. [DOI] [PMC free article] [PubMed] [Google Scholar]
- Fang J, Beattie DS. External alternative NADH dehydrogenase of Saccharomyces cerevisiae: a potential source of superoxide. Free Radic Biol Med. 2003;34:478–488. doi: 10.1016/s0891-5849(02)01328-x. [DOI] [PubMed] [Google Scholar]
- Farrugia G, Balzan R. Oxidative stress and programmed cell death in yeast. Front Oncol. 2012;2:64. doi: 10.3389/fonc.2012.00064. [DOI] [PMC free article] [PubMed] [Google Scholar]
- Finkel T. Radical medicine: treating ageing to cure disease. Nat Rev Mol Cell Biol. 2005;6:971–976. doi: 10.1038/nrm1763. [DOI] [PubMed] [Google Scholar]
- Folmer DE, Elferink RP, Paulusma CC. P4 ATPases - lipid flippases and their role in disease. Biochim Biophys Acta. 2009;1791:628–635. doi: 10.1016/j.bbalip.2009.02.008. [DOI] [PubMed] [Google Scholar]
- Fox TD, Folley LS, Mulero JJ, McMullin TW, Thorsness PE, Hedin LO, Costanzo MC. Analysis and manipulation of yeast mitochondrial genes. Methods Enzymol. 1991;194:149–165. doi: 10.1016/0076-6879(91)94013-3. [DOI] [PubMed] [Google Scholar]
- French AP, Mills S, Swarup R, Bennett MJ, Pridmore TP. Colocalization of fluorescent markers in confocal microscope images of plant cells. Nat Protoc. 2008;3:619–628. doi: 10.1038/nprot.2008.31. [DOI] [PubMed] [Google Scholar]
- Geitz RD, Woods RA. Transformation of yeast by the lithium acetate/single-stranded carrier DNA/PEG method. In: Brown AJP, Tuite MF, editors. Methods in Microbiology. New York: Academic Press; 1998. [Google Scholar]
- Gourlay CW, Ayscough KR. Actin-induced hyperactivation of the Ras signaling pathway leads to apoptosis in Saccharomyces cerevisiae. Mol Cell Biol. 2006;26:6487–6501. doi: 10.1128/MCB.00117-06. [DOI] [PMC free article] [PubMed] [Google Scholar]
- Graef M, Nunnari J. Mitochondria regulate autophagy by conserved signalling pathways. EMBO J. 2011;30:2101–2114. doi: 10.1038/emboj.2011.104. [DOI] [PMC free article] [PubMed] [Google Scholar]
- Guldener U, Heck S, Fielder T, Beinhauer J, Hegemann JH. A new efficient gene disruption cassette for repeated use in budding yeast. Nucleic Acids Res. 1996;24:2519–2524. doi: 10.1093/nar/24.13.2519. [DOI] [PMC free article] [PubMed] [Google Scholar]
- Halliwell B, Cross CE. Oxygen-derived species: their relation to human disease and environmental stress. Environ Health Perspect. 1994;102(Suppl 10):5–12. doi: 10.1289/ehp.94102s105. [DOI] [PMC free article] [PubMed] [Google Scholar]
- Hara K, Maruki Y, Long X, Yoshino K, Oshiro N, Hidayat S, Tokunaga C, Avruch J, Yonezawa K. Raptor, a binding partner of Target of Rapamycin (TOR), mediates TOR action. Cell. 2002;110:177–189. doi: 10.1016/s0092-8674(02)00833-4. [DOI] [PubMed] [Google Scholar]
- Haynes CM, Titus EA, Cooper AA. Degradation of misfolded proteins prevents ERderived oxidative stress and cell death. Mol Cell. 2004;15:767–776. doi: 10.1016/j.molcel.2004.08.025. [DOI] [PubMed] [Google Scholar]
- Hua Z, Fatheddin P, Graham TR. An essential subfamily of Drs2p-related P-type ATPases is required for protein trafficking between Golgi complex and endosomal/vacuolar system. Mol Biol Cell. 2002;13:3162–3177. doi: 10.1091/mbc.E02-03-0172. [DOI] [PMC free article] [PubMed] [Google Scholar]
- Hughes AL, Gottschling DE. An early age increase in vacuolar pH limits mitochondrial function and lifespan in yeast. Nature. 2012;492:261–265. doi: 10.1038/nature11654. [DOI] [PMC free article] [PubMed] [Google Scholar]
- Inagaki M, Schmelzle T, Yamaguchi K, Irie K, Hall MN, Matsumoto K. PDK1 homologs activate the Pkc1-mitogen-activated protein kinase pathway in yeast. Mol Cell Biol. 1999;19:8344–8352. doi: 10.1128/mcb.19.12.8344. [DOI] [PMC free article] [PubMed] [Google Scholar]
- Kajiwara K, Muneoka T, Watanabe Y, Karashima T, Kitagaki H, Funato K. Perturbation of sphingolipid metabolism induces endoplasmic reticulum stress-mediated mitochondrial apoptosis in budding yeast. Mol Microbiol. 2012;86:1246–1261. doi: 10.1111/mmi.12056. [DOI] [PubMed] [Google Scholar]
- Kamada Y, Fujioka Y, Suzuki NN, Inagaki F, Wullschleger S, Loewith R, Hall MN, Ohsumi Y. Tor2 directly phosphorylates the AGC kinase Ypk2 to regulate actin polarization. Mol Cell Biol. 2005;25:7239–7248. doi: 10.1128/MCB.25.16.7239-7248.2005. [DOI] [PMC free article] [PubMed] [Google Scholar]
- Kuge S, Jones N, Nomoto A. Regulation of yAP-1 nuclear localization in response to oxidative stress. EMBO J. 1997;16:1710–1720. doi: 10.1093/emboj/16.7.1710. [DOI] [PMC free article] [PubMed] [Google Scholar]
- Leadsham JE, Gourlay CW. cAMP/PKA signaling balances respiratory activity with mitochondria dependent apoptosis via transcriptional regulation. BMC Cell Biol. 2010;11:92. doi: 10.1186/1471-2121-11-92. [DOI] [PMC free article] [PubMed] [Google Scholar]
- Lee ME, Singh K, Snider J, Shenoy A, Paumi CM, Stagljar I, Park HO. The Rho1 GTPase acts together with a vacuolar glutathione S-conjugate transporter to protect yeast cells from oxidative stress. Genetics. 2011;188:859–870. doi: 10.1534/genetics.111.130724. [DOI] [PMC free article] [PubMed] [Google Scholar]
- Loewith R, Hall MN. Target of rapamycin (TOR) in nutrient signaling and growth control. Genetics. 2011;189:1177–1201. doi: 10.1534/genetics.111.133363. [DOI] [PMC free article] [PubMed] [Google Scholar]
- Luo G, Gruhler A, Liu Y, Jensen ON, Dickson RC. The sphingolipid long-chain base- Pkh1/2-Ypk1/2 signaling pathway regulates eisosome assembly and turnover. J Biol Chem. 2008;283:10433–10444. doi: 10.1074/jbc.M709972200. [DOI] [PMC free article] [PubMed] [Google Scholar]
- Machida K, Tanaka T, Fujita K, Taniguchi M. Farnesol-induced generation of reactive oxygen species via indirect inhibition of the mitochondrial electron transport chain in the yeast Saccharomyces cerevisiae. J Bacteriol. 1998;180:4460–4465. doi: 10.1128/jb.180.17.4460-4465.1998. [DOI] [PMC free article] [PubMed] [Google Scholar]
- Manolson MF, Wu B, Proteau D, Taillon BE, Roberts BT, Hoyt MA, Jones EW. STV1 gene encodes functional homologue of 95-kDa yeast vacuolar H(+)-ATPase subunit Vph1p. J Biol Chem. 1994;269:14064–14074. [PubMed] [Google Scholar]
- Masri J, Bernath A, Martin J, Jo OD, Vartanian R, Funk A, Gera J. mTORC2 activity is elevated in gliomas and promotes growth and cell motility via overexpression of rictor. Cancer Res. 2007;67:11712–11720. doi: 10.1158/0008-5472.CAN-07-2223. [DOI] [PubMed] [Google Scholar]
- Milgrom E, Diab H, Middleton F, Kane PM. Loss of vacuolar proton-translocating ATPase activity in yeast results in chronic oxidative stress. J Biol Chem. 2007;282:7125–7136. doi: 10.1074/jbc.M608293200. [DOI] [PubMed] [Google Scholar]
- Mulet JM, Martin DE, Loewith R, Hall MN. Mutual antagonism of target of rapamycin and calcineurin signaling. J Biol Chem. 2006;281:33000–33007. doi: 10.1074/jbc.M604244200. [DOI] [PubMed] [Google Scholar]
- Nayak BK, Feliers D, Sudarshan S, Friedrichs WE, Day RT, New DD, Fitzgerald JP, Eid A, Denapoli T, Parekh DJ, et al. Stabilization of HIF-2alpha through redox regulation of mTORC2 activation and initiation of mRNA translation. Oncogene. 2012 doi: 10.1038/onc.2012.333. [DOI] [PMC free article] [PubMed] [Google Scholar]
- Niles BJ, Mogri H, Hill A, Vlahakis A, Powers T. Plasma membrane recruitment and activation of the AGC kinase Ypk1 is mediated by target of rapamycin complex 2 (TORC2) and its effector proteins Slm1 and Slm2. Proc Natl Acad Sci U S A. 2012;109:1536–1541. doi: 10.1073/pnas.1117563109. [DOI] [PMC free article] [PubMed] [Google Scholar]
- Nishi T, Forgac M. The vacuolar (H+)-ATPases--nature’s most versatile proton pumps. Nat Rev Mol Cell Biol. 2002;3:94–103. doi: 10.1038/nrm729. [DOI] [PubMed] [Google Scholar]
- Olivera-Couto A, Grana M, Harispe L, Aguilar PS. The eisosome core is composed of BAR domain proteins. Mol Biol Cell. 2011;22:2360–2372. doi: 10.1091/mbc.E10-12-1021. [DOI] [PMC free article] [PubMed] [Google Scholar]
- Preston RA, Murphy RF, Jones EW. Assay of vacuolar pH in yeast and identification of acidification-defective mutants. Proc Natl Acad Sci U S A. 1989;86:7027–7031. doi: 10.1073/pnas.86.18.7027. [DOI] [PMC free article] [PubMed] [Google Scholar]
- Roelants FM, Baltz AG, Trott AE, Fereres S, Thorner J. A protein kinase network regulates the function of aminophospholipid flippases. Proc Natl Acad Sci U S A. 2010;107:34–39. doi: 10.1073/pnas.0912497106. [DOI] [PMC free article] [PubMed] [Google Scholar]
- Roelants FM, Breslow DK, Muir A, Weissman JS, Thorner J. Protein kinase Ypk1 phosphorylates regulatory proteins Orm1 and Orm2 to control sphingolipid homeostasis in Saccharomyces cerevisiae. Proc Natl Acad Sci U S A. 2011;108:19222–19227. doi: 10.1073/pnas.1116948108. [DOI] [PMC free article] [PubMed] [Google Scholar]
- Sarbassov DD, Ali SM, Sabatini DM. Growing roles for the mTOR pathway. Curr Opin Cell Biol. 2005;17:596–603. doi: 10.1016/j.ceb.2005.09.009. [DOI] [PubMed] [Google Scholar]
- Sherman F. Getting started with yeast. Methods In Enzymology. 1991;194:3–21. doi: 10.1016/0076-6879(91)94004-v. [DOI] [PubMed] [Google Scholar]
- Szatrowski TP, Nathan CF. Production of large amounts of hydrogen peroxide by human tumor cells. Cancer Res. 1991;51:794–798. [PubMed] [Google Scholar]
- Thorpe GW, Fong CS, Alic N, Higgins VJ, Dawes IW. Cells have distinct mechanisms to maintain protection against different reactive oxygen species: oxidative-stress-response genes. Proc Natl Acad Sci U S A. 2004;101:6564–6569. doi: 10.1073/pnas.0305888101. [DOI] [PMC free article] [PubMed] [Google Scholar]
- Urban J, Soulard A, Huber A, Lippman S, Mukhopadhyay D, Deloche O, Wanke V, Anrather D, Ammerer G, Riezman H, et al. Sch9 is a major target of TORC1 in Saccharomyces cerevisiae. Mol Cell. 2007;26:663–674. doi: 10.1016/j.molcel.2007.04.020. [DOI] [PubMed] [Google Scholar]
- Walther TC, Brickner JH, Aguilar PS, Bernales S, Pantoja C, Walter P. Eisosomes mark static sites of endocytosis. Nature. 2006;439:998–1003. doi: 10.1038/nature04472. [DOI] [PubMed] [Google Scholar]