

Abstract
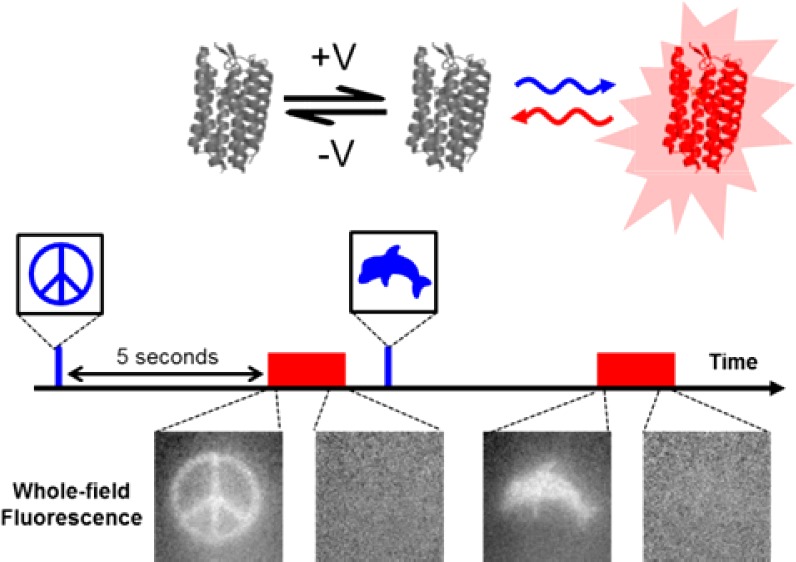
We developed a technique, “flash memory”, to record a photochemical imprint of the activity state—firing or not firing—of a neuron at a user-selected moment in time. The key element is an engineered microbial rhodopsin protein with three states. Two nonfluorescent states, D1 and D2, exist in a voltage-dependent equilibrium. A stable fluorescent state, F, is reached by a photochemical conversion from D2. When exposed to light of a wavelength λwrite, population transfers from D2 to F, at a rate determined by the D1 ⇌ D2 equilibrium. The population of F maintains a record of membrane voltage which persists in the dark. Illumination at a later time at a wavelength λread excites fluorescence of F, probing this record. An optional third flash at a wavelength λreset converts F back to D2, for a subsequent write–read cycle. The flash memory method offers the promise to decouple the recording of neural activity from its readout. In principle, the technique may enable one to generate snapshots of neural activity in a large volume of neural tissue, e.g., a complete mouse brain, by circumventing the challenge of imaging a large volume with simultaneous high spatial and high temporal resolution. The proof-of-principle flash memory sensors presented here will need improvements in sensitivity, speed, brightness, and membrane trafficking before this goal can be realized.
Introduction
To create detailed maps of brain function, one would like to observe the simultaneous activity of thousands or millions of neurons in the intact brain of a behaving animal. Large-scale maps of activity at single-neuron and single-spike resolution could give insights into fundamental mechanisms of neural processing. One could map the patterns of activation associated with simple sensory processing tasks or with complex activities such as feeding, locomotion, or social interactions. By correlating the activity of large numbers of single cells, one might deduce rules of neuronal information processing.
Recent efforts in “connectomics” have focused on mapping large-scale neural structures using optical1,2 and electron3,4 microscopies. Clever GFP labeling schemes facilitate tracing of neuronal connections in genetically specified cell types.5 However, connectomic mapping is typically implemented in fixed tissues and thus is incompatible with functional recording.
Genetically encoded voltage and calcium reporters are now widely used for optical recording of neural activity in vitro and in vivo.6−8 These tools are typically used to record from a relatively modest number of cells (<1000) in a single field of view. A recent technical tour de force demonstrated whole-brain calcium imaging in a live zebrafish,9 but the imaging bandwidth of 0.8 Hz was ∼1000-fold slower than the duration of a single action potential.
One might like to combine large-scale 3D imaging with functional reporters to achieve “functional connectomics”, i.e., brain activity mapping. Two challenges have stood in the way. First, optical scattering limits imaging in live brain tissue to a depth of ∼1 mm. To image at greater depth, the brain must be fixed and either chemically clarified2 or sliced into thin sections.1 Second, existing microscopes cannot image large volumes fast enough to resolve simultaneous action potentials (∼1 ms) or calcium transients (∼200 ms) in large numbers of cells. For a fast voltage indicator, the signal from a neuronal spike lasts only as long as the spike itself. To image a cubic millimeter of brain with millisecond temporal resolution and micrometer spatial resolution would require a data rate >1013 bits/s, well beyond the bandwidth of existing or conceived microscopes.
An alternate strategy is to convert neural activity in a user-defined epoch into a long-lasting (bio)chemical signal to be read at a later time. In the technique of targeted recombination in active populations (TRAP), the simultaneous presence of neural activity and a drug (tamoxifen) leads to activation of a Cre recombinase and subsequent expression of GFP.10 This technique captured average levels of neural activity over a ∼12 h window. Several proposals have been offered for activity integrators with higher time resolution,11,12 but to our knowledge none has been implemented.
Optical gating of an activity recorder is particularly attractive because (a) the optical control signal can be gated with nearly arbitrary temporal precision and (b) photons used to regulate a photochemical process need not follow a straight-line path from the source to the molecular target. While optical scattering lengths in brain are typically ∼60 μm,13 diffusive transport of photons can easily fill an entire rodent brain with light. Thus delivery of an optical control signal is relatively straightforward and does not require sophisticated optics. Naturally occurring and engineered rhodopsin proteins have previously been demonstrated to show optical bistability14−16 and also to show voltage-dependent switching,17−20 but the combination of these two attributes has not, to our knowledge, been demonstrated.
Here we demonstrate two proof-of-principle approaches to light-gated photochemical recording of membrane voltage. Both are based on transmembrane proteins which undergo both voltage- and light-induced conformational changes. Figure 1 compares the operation of a standard real-time voltage indicator (Figure 1a) to the light-gated reporters (Figure 1b,c). Conventional real-time voltage reporters interconvert between nonfluorescent and fluorescent states in a voltage-dependent manner; illumination probes the population in the fluorescent state but does not affect the conformation. Light-gated voltage reporters have separate voltage- and light-driven transitions. Formation of a fluorescent product requires simultaneous presence of a depolarizing voltage and illumination. The three-state models shown in Figure 1b,c illustrate plausible reaction topologies which could lead to this behavior.
Figure 1.

Classes of voltage indicators. (a) In a real-time voltage reporter, the population in a fluorescent state, F, is a function of membrane voltage, regardless of illumination. (b) In a sample and hold voltage sensor, voltage establishes a D1 ⇌ D2 equilibrium and a write pulse establishes a rapid D2 ⇌ F equilibrium. Thus the population of F tracks the membrane voltage. The population of F is frozen at the end of the write pulse. (c) In a light-gated voltage integrator, voltage establishes a D1 ⇌ D2 equilibrium, and a write pulse drives the unidirectional D2 → F transition. Thus the population of F accumulates in a voltage-dependent manner. The population of F is frozen at the end of the write pulse. In both types of flash memory sensor, the population of F persists in the dark and is later probed via a read pulse that elicits fluorescence.
In a sample and hold sensor (Figure 1b), the population in the fluorescent state tracks the membrane voltage during illumination at a wavelength λwrite; interconversion ceases the moment the write pulse ends. Illumination at a wavelength λread at a later time probes the quantity of fluorescent product that existed at the end of the write pulse. These sensors could be used to record snapshots of neural activity at a moment in time.
In a light-gated voltage integrator (Figure 1c), the population in the fluorescent state accumulates in a voltage-dependent manner during a write pulse. Production of the fluorescent state ceases at the end of the write pulse. A read pulse probes the fluorescence at a later time. Integrators could be used to determine the cumulative level of neuronal activity during a period of illumination. The “sample and hold” and “light-gated integrator” mechanisms are limiting cases of a continuous distribution of light-gated voltage reporters, distinguished by light-dependent kinetics into and out of the fluorescent state during the write pulse. We call the techniques of Figure 1b,c “flash memory” for their ability to store a record of neural activity upon a flash of light.
The three-state reaction scheme of Figures 1b,c occurs as a motif within the voltage- and illumination-dependent photocycle of Archaerhodopsin-based voltage indicators (Figure S1).21 While flash memory behavior was not observed in the wild-type protein, we hypothesized that mutants of Arch might show kinetics favoring flash memory behavior. We introduce the three-state model here as a conceptual framework for interpreting the data that follows. Simulations of this model are given at the end of the paper.
We give a detailed photophysical characterization of two flash memory sensors, engineered by mutating the real-time voltage reporter Archaerhodopsin-3 (Arch). The mutant Arch(D95H) approximates a sample and hold sensor, albeit with a slow (48 ms) response to changes in voltage. We used Arch(D95H) to make a photochemical recording of action potentials in a cultured neuron. The mutant Arch(D95Q) approximates a light-gated voltage integrator, albeit with poor sensitivity to single spikes. We used Arch(D95Q) to count exogenously delivered voltage spikes in a HEK cell (it did not traffic well enough for use in neurons).
Applications in tissue and in vivo will require further technical developments in the protein reporter and in the optical instrumentation and imaging protocols. Screens of Arch mutants and other microbial rhodopsins may yield reporters with improved sensitivity, kinetics, brightness, and membrane trafficking. Raman or 2-photon readout modalities may prevent spurious resetting of proteins by scattered imaging light. For applications where the tissue is fixed and sliced prior to imaging, the robustness of the signal to these procedures must be tested. While whole-brain activity mapping is the ultimate goal, imaging of increasingly large brain subregions will provide useful waypoints.
Results
We hypothesized that mutants of Arch could function as flash memory sensors. Aspartic acid 95 (analogous to D85 in bacteriorhodopsin) is the proton acceptor from the Schiff base. Our lab21 and others22 have shown that mutation of this residue can eliminate proton pumping and can modulate photophysical properties of the protein. We generated a library of 20 Arch(D95X) mutants and screened for the three attributes of a flash memory sensor: bistability, voltage-sensitivity in the light, and absence of voltage sensitivity in the dark. Figure 2a shows the rich colors observed in pellets of E. coli expressing some of these mutants.
Figure 2.
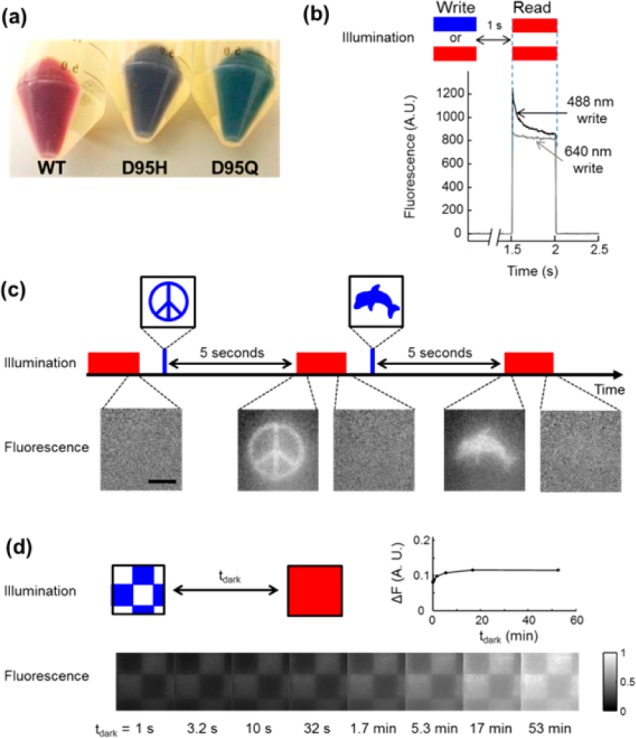
Fluorescence bistability in mutants of Arch. (a) Image of three pellets of E. coli expressing different mutants of Arch. (b) Bistability in Arch(D95H) expressed in HEK cells. Initial fluorescence under red excitation (λread = 640 nm) was different for λwrite = 640 nm than for λwrite = 488 nm. The write pulse was 500 ms, 200 W/cm2 and the dark interval was tdark = 1 s. (c) Imprinting of photochemical images in a lawn of E. coli expressing Arch(D95H). Illumination with a pattern of blue light converted Arch(D95H) into a long-lived fluorescent state. After a 5 s delay, the pattern was probed with red excitation and near-infrared fluorescence. The red illumination eventually erased the pattern. The process was repeated on the same cells with a different pattern. Scale bar 50 μm. (d) Monitoring lifetime of bistability. A checkerboard pattern was imprinted via blue light and probed via red-induced fluorescence after a variable delay tdark. Inset graph shows the difference in fluorescence of the bright and dark squares as a function of tdark.
Arch(D95H) and Arch(D95Q) Are Bistable
We tested all Arch(D95X) mutants for bistability, using fluorescence of the retinal chromophore as a readout. We expressed each mutant in E. coli (Materials and Methods), added carbonyl cyanide m-chlorophenyl hydrazine (CCCP) to neutralize the membrane potential, and formed a small bacterial pellet for initial spectroscopic characterization. We illuminated each mutant with 16 illumination sequences of the form: (λwrite, tdark, λread), with λwrite and λread (1 s each, 10 W/cm2) selected from all pairwise combinations of: 500, 545, 590, and 635 nm (Materials and Methods). We fixed tdark = 5 s. We asked whether the initial fluorescence elicited by λread depended on λwrite. Such a dependence indicates the presence of at least two states that were stable for at least 5 s in the dark. In all cases emission was collected from 660–760 nm.
All mutants showed some degree of bistability (Figure S2). The mutant D95H showed the largest effect. Its brightness and fluorescence excitation and emission spectra are characterized in Figure S3. Fluorescence excited at λread = 635 nm was 24% brighter with λwrite = 500 nm than with λwrite = 635 nm. To test whether Arch(D95H) was bistable in mammalian cells, we expressed the protein in HEK cells and illuminated the sample with λwrite = 488 or 640 nm, tdark = 1 s, and λread = 640 nm (I = 200 W/cm2), while using whole-cell voltage clamp to maintain a membrane voltage of 0 mV. Illumination at λwrite = 488 nm caused greater initial fluorescence during the read interval than did illumination at λwrite = 640 nm (Figure 2b).
To illustrate the bistability of Arch(D95H), we imprinted a photochemical image into a lawn of E. coli expressing Arch(D95H). A digital micromirror array was used to project an image at λwrite = 488 nm (0.7 W/cm2) into the microscope and onto the cells. After tdark = 5 s, the cells were illuminated with homogeneous full-field illumination at λread = 640 nm (40 W/cm2), revealing the latent image in the near-infrared fluorescence (Figure 2c). After several seconds of illumination at 640 nm the image faded. This process could be repeated in the same field of view with subsequent patterns written by blue light and read by red light.
We varied tdark to measure the lifetime of bistability in Arch(D95H) (Figure 2d). A grid pattern of blue light was projected onto the lawn of E. coli. After variable delay, the pattern was probed via wide-field red illumination and near-infrared fluorescence. The contrast remained stable at ∼10% out to the longest time measured, tdark = 53 min (Figure 2d, inset). There was also a slow (tens of minutes) increase in the overall brightness of the image, occurring equally in the regions that had and had not been exposed to blue light. The source of this gradual increase in fluorescence is not known, though we speculate that it may have been caused by stray light inducing a gradual buildup of the fluorescent state.
Several other mutants, including Arch(D95Q), showed significant bistability in our screen of the Arch(D95X) library. For D95Q, fluorescence excited at λread = 635 nm was 8% brighter with λwrite = 500 nm than with λwrite = 635 nm (Figure S2). Arch(D95Q) also showed bistability in HEK cells (Figure S3).
Arch(D95H) and Arch(D95Q) Are Voltage Sensitive under Illumination
We then expressed all 20 Arch(D95X) mutants in HEK cells and characterized their fluorescence (λexc = 640 nm, λem = 660–760 nm) as a function of membrane potential (Vm = −150 to +150 mV). Figure 3a shows the experimental setup. All mutants whose fluorescence could be detected showed some degree of voltage sensitivity. At Vm = +150 mV Arch(D95H) was 2-fold brighter than at Vm = −150 mV (Figure 3b). Arch(D95Q) showed the greatest voltage sensitivity, with fluorescence >7-fold higher at +150 mV than at −150 mV (Figure 3c), a consequence of having almost no fluorescence at Vm = −150 mV. Arch(D95H) generated a small hyperpolarizing photocurrent (5 pA) under intense illumination at 640 nm (500 W/cm2). Arch(D95Q) generated no detectable photocurrent. Wild-type Arch typically generated photocurrents >100 pA, so we deem the small photocurrent of Arch(D95H) to be insignificant. Due to the simultaneous presence of optical bistability and voltage-sensitive fluorescence in Arch(D95H) and Arch(D95Q), we further characterized these mutants as prospective flash memory sensors.
Figure 3.
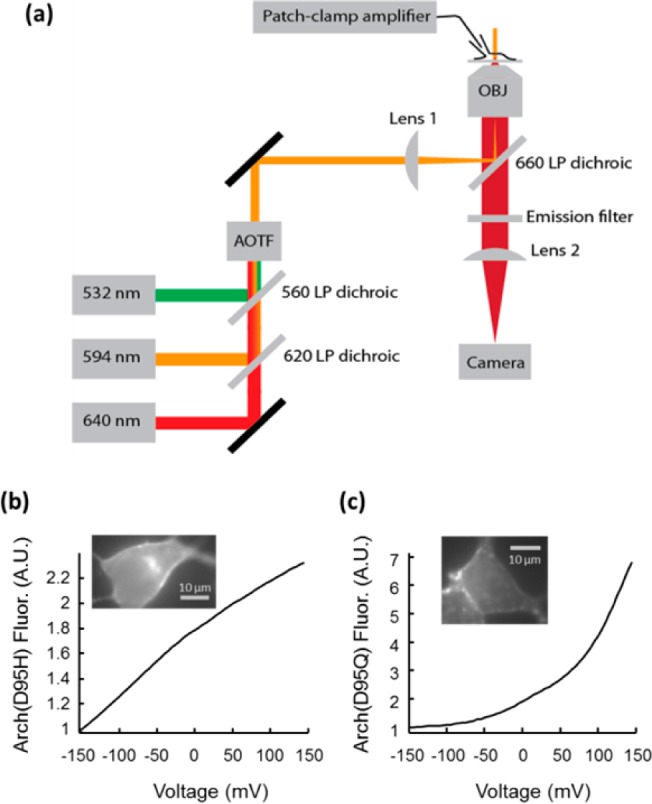
(a) Experimental setup. An acousto-optic tunable filter (AOTF) on the excitation path dynamically controlled the wavelength and intensity of illumination. A patch clamp amplifier provided control over the membrane potential. A camera recorded fluorescence. A shutter (not shown) after the AOTF blocked all light from reaching the sample during dark intervals. The AOTF, patch clamp apparatus, and camera were synchronized via custom software. (b) Voltage-sensitive fluorescence of Arch(D95H) expressed in a HEK cell under constant illumination at 640 nm. The fluorescence more than doubled between Vm = −150 and +150 mV. (c) Fluorescence of Arch(D95Q) increased 7-fold between −150 and +150 mV, though most of the sensitivity was at positive voltages, above the physiological range.
Arch(D95H) and Arch(D95Q) Store a Photochemical Record of Membrane Voltage
To test for flash memory behavior, we illuminated HEK cells expressing Arch(D95H) or Arch(D95Q) with the sequence (λwrite, tdark, λread) while simultaneously varying the membrane voltage under patch clamp control (Figure 4). Each sequence (λwrite, tdark, λread) was repeated twice, once with Vm fixed at −100 mV throughout and once with Vm stepped from −100 to +100 mV during the write interval and then returned to −100 mV for the dark and read intervals. Remarkably, the initial fluorescence during the read interval, Fi, depended on the voltage during the write interval, as required for a flash memory sensor. During the read pulse, the fluorescence gradually relaxed to a steady-state value, Ff, determined only by the voltage and illumination during the read pulse.
Figure 4.

Observation of flash memory in Arch mutants (a–c) Arch(D95H) and (d–f) Arch(D95Q). (a) Photochemical imprinting of a step in membrane voltage. Fluorescence of Arch(D95H) at the start of the read pulse was greater for Vm = +100 mV during the write pulse (purple line) than for Vm = −100 mV during the write pulse (blue line). (b) Robustness of flash memory to voltage dynamics in the dark. A voltage pulse in the dark did not influence the fluorescence dynamics during the read interval. (c) Persistence of memory as a function of dark interval. The flash memory effect remained unchanged for up to tdark = 2 min. In (a–c) λwrite = 640 nm, λread = 594 nm. (d–f) Same as (a–c) for Arch(D95Q). In (d–f) λwrite = 532 nm, λread = 532 nm.
We measured the extent of fluorescence relaxation during the read pulse by the dimensionless quantity
In a flash memory sensor, M should be high when Vwrite = +100 mV and low when Vwrite = −100 mV. We quantified the flash memory effect by
with Vread = −100 mV in both instances.
We tested Arch(D95H) and Arch(D95Q) with all combinations of λwrite and λread selected from 532, 594, and 640 nm, keeping tdark fixed (Figures S4 and S5). In Arch(D95H), the memory effect was maximized with λwrite = 640 nm and λread = 594 nm (Figure 4a). In Arch(D95Q), the memory effect was maximized with λwrite = 532 nm and λread = 532 nm (Figure 4d).
We next asked whether a depolarizing voltage pulse during tdark could overwrite a memory recorded during the write pulse. A 500 ms voltage pulse to +100 mV in the middle of a 2 s dark interval had no effect on ΔM in either mutant (Figure 4b,e). We varied the timing of the voltage pulse in the dark and found no effect on ΔM, except for a small increase in ΔM for Arch(D95H) when the depolarizing voltage pulse ended <20 ms prior to the read pulse (Figure S6).
We then varied tdark to measure the persistence of the memory (Figure 4c,f). In both mutants the magnitude of ΔM remained constant up to tdark = 2 min. Instabilities in the patch clamp connection prevented measurements at larger values of tdark. In Arch(D95H) the memory effect was ΔM = 10%, while in Arch(D95Q) the memory effect was ΔM = 20%.
Arch(D95H) Responds Faster Than Arch(D95Q) to Pulses of Light or Voltage
We varied the duration of the light pulse during the write interval to measure how fast a photochemical imprint of the voltage could be written. The voltage was held at +100 mV throughout the write interval (300 ms for Arch(D95H) and 800 ms for Arch(D95Q)), while the duration of the write illumination (twrite) was varied between 0 and 200 ms (Figure 5a,b). For Arch(D95H), the value of the memory, ΔM, increased with twrite, following a double-exponential curve with write time constants of τfast = 0.14 ms and τslow = 12 ms; the majority of this response (57%) was determined by τfast (Figure 5c). In contrast, for Arch(D95Q) writing took much longer: ΔM also increased with twrite and followed double-exponential kinetics, with time constants τfast = 5 ms and τslow = 180 ms; the majority of this response (92%) was determined by τslow (Figure 5d).
Figure 5.
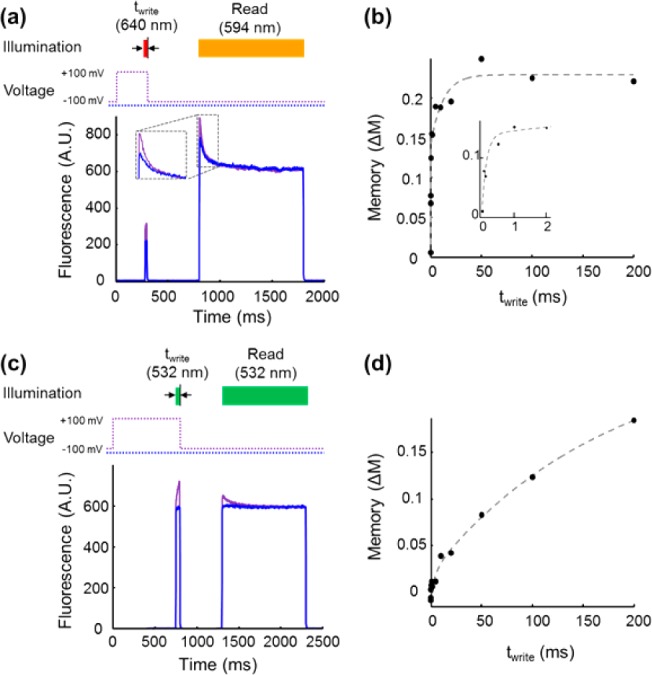
Kinetics of bright-state formation during the write pulse for (a,b) Arch(D95H) and (c,d) Arch(D95Q). Voltage was held at either +100 or −100 mV during the write interval and at −100 mV during the dark and read intervals. The length of the write flash, twrite, was varied, keeping its end coincident with the step in voltage from +100 mV to −100 mV. Representative fluorescence traces are shown for (a) Arch(D95H) and (c) Arch(D95Q). (b,d) Plot of memory effect, ΔM, as a function of twrite. In Arch(D95H) the rise in memory was fit by a double exponential with τfast = 0.14 ms (57%) and τslow = 12 ms (43%); a write flash with twrite = 1 ms was sufficient to elicit more than half of the maximal response. (d) The dependence of ΔM on twrite in Arch(D95Q) was dominated by a slow component. A fit to a double exponential yielded τfast = 5 ms (8%) and τslow = 180 ms (92%).
We also performed the complementary experiment of changing the duration of the voltage pulse during the write interval while keeping the duration of the light pulse fixed at 1000 ms. The memory effect in Arch(D95H) saturated with a time constant for the voltage pulse of 48 ms. For Arch(D95Q) the corresponding time constant was 146 ms (Figure S7).
Arch(D95H) Records a Photochemical Imprint of Action Potentials in a Neuron
We tested whether Arch(D95H) could function as a flash memory sensor for recording neuronal action potentials. The submillisecond response of the protein to a flash of light at constant voltage (Figure 5) indicated that the light-driven transition into the fluorescent state was fast compared to the duration of an action potential. However, the 48 ms response to a step in voltage under constant illumination (Figure S7) implied that the voltage-dependent transition was slow: the rate of conformational change would low-pass filter the underlying voltage dynamics of the neuron. Despite this limitation, we tested whether Arch(D95H) could record an imprint of a single neuronal action potential.
We fused the C-terminus of Arch(D95H) to an endoplasmic reticulum export motif, followed by an eYFP expression marker and a trafficking sequence, as described in ref (23) (Materials and Methods). We cloned this construct into a lentiviral mammalian expression vector under the CaMKII promoter. Hippocampal neurons and glia were dissociated from postnatal day 0 (P0) rats and cultured on poly-d-lysine coated glass-bottomed dishes (Materials and Methods). At 4 days in vitro (div) 2 μM AraC was added to suppress further glial growth. We transfected the cells with Arch(D95H)-eYFP at 7 div using calcium phosphate, and we measured activity at 12–15 div. At the time of measurement, our construct had trafficked to the plasma membranes of the soma and processes, although considerable protein remained internalized in intracellular membranes (Figure 6a).
Figure 6.
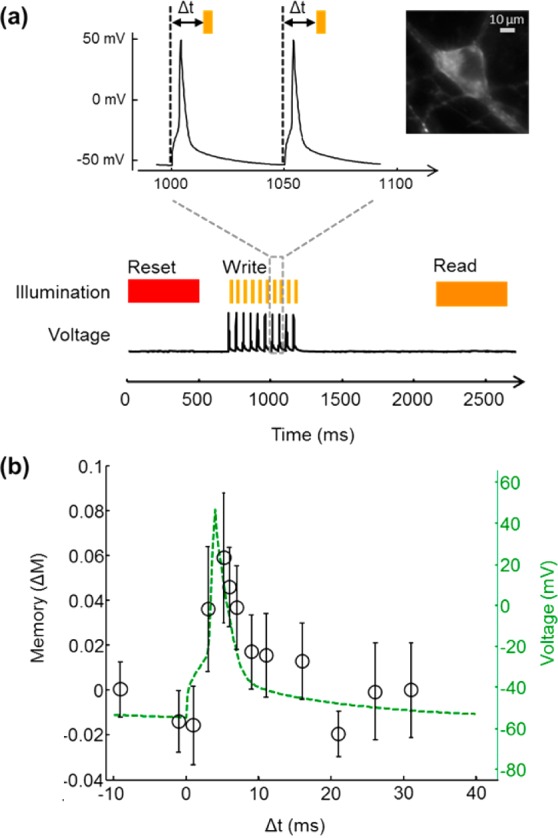
Photochemical imprinting of action potentials in a mammalian neuron expressing Arch(D95H). Paired action potentials and flashes of orange light led to increased formation of a fluorescent product only when the action potentials and orange flashes coincided in time. The fluorescent product was probed at tdark = 1 s after the last action potential. (a) Illumination and voltage traces used in the experiment. (b) Memory effect, ΔM, recorded during the read interval (circles) overlaid on the electrical recording of the action potential acquired during the write interval (green). Each data point is the average of 5 trials of 10 action potentials. Error bars are the sample standard deviation.
Injection of current pulses (500 pA for 4 ms) via whole-cell patch clamp reliably induced single action potentials. We paired single action potentials with a 2 ms flash at λwrite = 594 nm (I = 200 W/cm2). The flash was delivered either before (Δt < 0 ms), during (0 ms < Δt < 10 ms), or after (Δt > 10 ms) the action potential. After a dark interval of tdark = 1 s, fluorescence was imaged with λread = 594 nm. We used λwrite = λread = 594 nm, on the logic that in a neuroscience application it might be most convenient to use light of a single wavelength. Our signal-to-noise ratio in these measurements was not adequate to detect a signature of the action potential in the read fluorescence. We attributed this negative result to the slow response of Arch(D95H) to a step in voltage (τ = 48 ms, Figure S7).
We performed numerical simulations of the three-state model of Figure 1b with different approaches to pairing flashes of light with action potentials (Figure S8). These simulations showed that repeated trains of action potentials paired with brief flashes of light could build up population in the fluorescent state. In the simulations, the fluorescence during the read pulse reflected the temporal overlap of the voltage and light in the write pulses.
We thus modified our illumination protocol to pair a train of 10 action potentials with a train of 10 light flashes. Action potentials were induced at 50 ms intervals, and each was paired with a 2 ms write flash at λwrite = 594 nm (I = 200 W/cm2). For each set of 10 action potentials, the write flashes were delivered either before (Δt < 0 ms), during (0 ms < Δt < 10 ms), or after (Δt > 10 ms) the corresponding action potentials. Figure 6a shows the revised protocol. A plot of the memory effect, ΔM, during the read interval as a function of Δt during the write interval reproduced the underlying waveform of the action potential (Figure 6b). This measurement demonstrates that Arch(D95H) can record a photochemical imprint of action potentials in a neuron, though an improved signal-to-noise ratio will be needed for application in neuroscience.
Arch(D95Q) Functions As a Light-Gated Voltage Integrator
Finally, we explored whether Arch(D95Q) could function as a light-gated voltage integrator. For a true integrator, the memory signal due to a voltage pulse should not depend on when in the write interval the pulse occurs. That is, population transferred to the bright state during an action potential must not revert to the dark state during a subsequent hyperpolarization. Thus there must be a negligible rate from bright state to the dark state during the write pulse (Figure 1c). After a search of wavelengths and intensities for the write pulse, we found that Iwrite = 1 W/cm2 and λwrite = 532 nm caused Arch(D95Q) to function as a light-gated voltage integrator (Figure S9).
Arch(D95Q) did not traffic efficiently to the plasma membrane of neurons, so we tested its ability to count imposed voltage spikes in HEK cells instead, using the protocol shown in Figure 7a. A cell expressing Arch(D95Q) was held under voltage clamp conditions via a patch pipet, initially at a resting voltage of −100 mV. A reset pulse (λreset = 635 nm, treset = 0.5 s, Ireset = 300 W/cm2) drove the population into the nonfluorescent state. During the write period, a dim green pulse (λwrite = 532 nm, twrite = 0.4 s, Iwrite = 1 W/cm2) was paired with a variable number of voltage spikes (−100 mV to +100 mV, 1 ms in duration). After a dark interval tdark = 0.5 s, the fluorescence was probed by a green pulse (λread = 532 nm, tread = 0.5 s, Iread = 200 W/cm2). We compared the value of the memory effect, M, in the presence of n voltage spikes to its value in the absence of voltage spikes.
Figure 7.
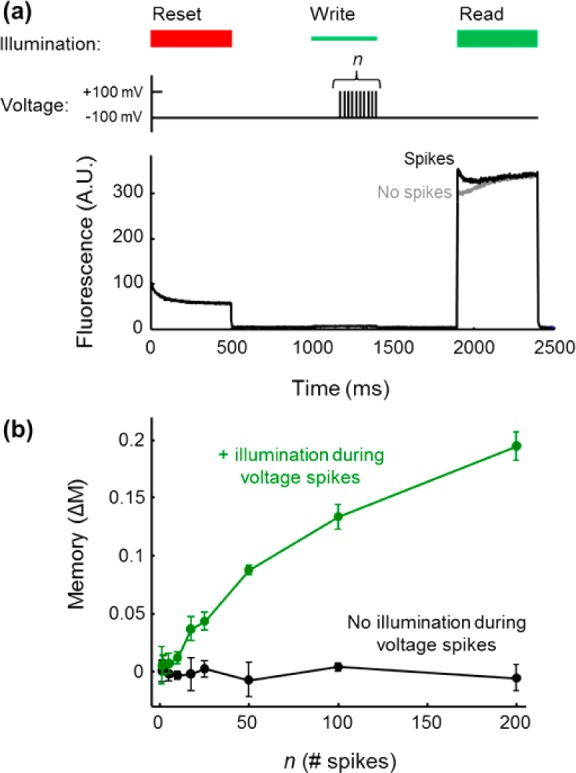
Photochemical counting of electrical spikes in a HEK cell expressing Arch(D95Q). (a) Top: sequence of illumination and voltage pulses to test the function of Arch(D95Q) as a light-gated voltage integrator. A red reset pulse initialized the protein in the nonfluorescent state. A series of n voltage pulses (−100 to +100 mV, 1 ms) was paired with dim green illumination (1 W/cm2) to produce fluorescent product at a voltage- and light-dependent rate. After a delay of tdark = 0.5 s, the fluorescence was probed by a green read pulse (200 W/cm2). Bottom: representative fluorescence traces for n = 100 spikes. (b) Memory effect, ΔM, probed in the read interval as a function of number of spikes in the write interval. In the presence of the write pulse, the memory reported the number of spikes (green). When the write pulse was omitted, spikes did not induce a memory effect (black). Error bars are the sample standard deviation calculated from six repetitions of the experimental pulse sequence.
Figure 7a shows representative raw fluorescence traces with and without n = 100 voltage spikes. Figure 7b shows that the memory effect (ΔM) increased with the number of voltage spikes during the write interval. Although the voltage spikes in this experiment were not action potentials, this preliminary result shows the feasibility of using an Arch-based sensor to count voltage spikes in a light-gated manner.
Mechanistic Analysis of Flash Memory Sensors
What is the molecular basis of flash memory in Archaerhodopsin mutants? While a complete characterization of the photocycles of Arch(D95H) and D95Q is beyond the scope of this paper, here we show that a simple three-state model reproduces the main qualitative features of the data. Varying the illumination parameters can tune the behavior of the model continuously between sample and hold and light-gated integrator behavior.
Figure 8a shows the model and Figure 8b,c shows numerical simulation results. A voltage-dependent equilibrium exists between two nonfluorescent states, D1 and D2. The fluorescent state, F, is connected to D2 by a light-driven process (presumably retinal isomerization). The action spectra of the transitions into and out of state F are different; blue light drives the transition into the fluorescent state (D2 → F), red light drives the reverse reaction (F → D2), and orange light drives both reactions. Red light also excites fluorescence of F.
Figure 8.
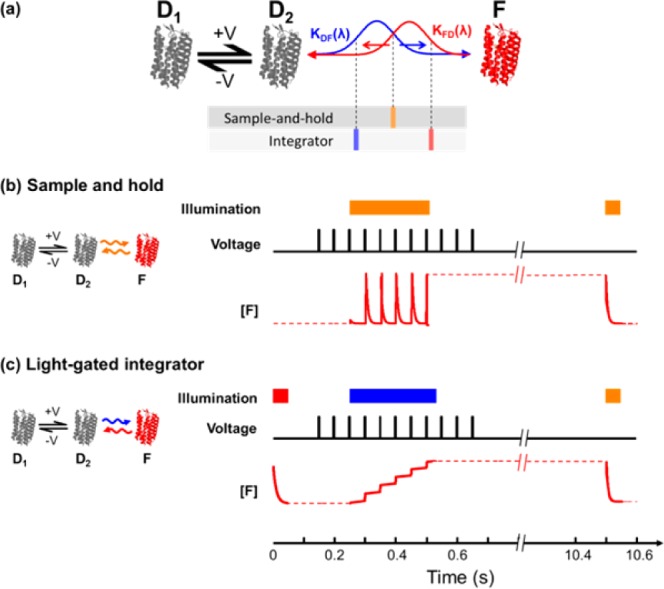
Numerical simulation of three-state kinetic model of flash memory effect in Arch mutants. (a) Reaction scheme in which illumination wavelength tunes the D2 ⇌ F equilibrium. (b) In a sample-and-hold sensor, the population of F follows the voltage-dependent D1 ⇌ D2 equilibrium until the end of the write pulse. The solid red trace on the right is a numerical simulation of the population in F. (c) In a light-gated integrator, blue light converts population from D2 to F but does not allow the reverse process. Population in F accumulates in a voltage-dependent manner during the write pulse.
To use the protein as a sample and hold sensor (Figure 8b), one illuminates with a wavelength λwrite that simultaneously drives both the D2 → F and F → D2 transitions. During the write interval the ratio of [F] to [D2] is determined by λwrite and the forward and reverse action spectra. Voltage sets the ratio of [D1] to [D2] and thereby sets the population of F. The moment the light turns off, the population in F is trapped, decoupled from voltage-dependent dynamics in the D manifold. During the read pulse, light at λread excites fluorescence from F but at the same time re-establishes equilibrium between F and the D manifold.
The same model can function as a light-gated integrator. The reset pulse is given at a wavelength λreset sufficiently far red that it drives F → D2 but not D2 → F, thereby initializing the population in the dark D manifold. The write pulse is chosen with λwrite sufficiently blue that it can drive D2 → F but not F → D2. Thus, when the voltage is high enough to populate D2 and the write pulse is on, molecules take a one-way trip from D2 to F. This model predicts that by tuning the intensity and wavelength of the write pulse, one can adjust the dynamic range of the integrator. A large kDF increases sensitivity to single spikes but causes the integrator to saturate at a smaller number of spikes, while a small kDF has the opposite effect. Our simple analysis suggests that additional control over the state of the system could be obtained by illuminating with two wavelengths simultaneously during the write interval. By choosing a blue and a red wavelength, one could independently control the rates into and out of the fluorescent state.
While this model is sufficient to explain the main features we observed in flash memory proteins, these molecules likely have more than three significant states. If one were to map the simple model of Figure 8a onto a canonical proton pump photocycle, the dark manifold would likely correspond to the set of states that interconvert in a voltage-dependent way in the main photocycle (M and N intermediates), and the state F would correspond to the off-pathway photogenerated fluorescent state called Q in ref (21).
Discussion
We have introduced the concept of flash memory as a technique to record light-gated photochemical imprints of membrane voltage. Two mutants of the fluorescent voltage indicator Arch can be used as flash memory sensors, albeit with small signal amplitudes that limit immediate practical utility. Arch(D95H) functioned as a light-gated sample and hold. This protein could store a photochemical record of action potentials in a rat neuron. Arch(D95Q) functioned as a light-gated voltage integrator. This protein could report the number of electrical spikes that had occurred in a HEK cell during a user-selected recording epoch.
Many aspects of flash memory sensors need further improvement. These include: plasma membrane trafficking in neurons, overall brightness, and contrast between the “high-voltage” and “low-voltage” states. Ideally, the protein would switch fully within the physiological range of −70 to +30 mV. For readouts that involve fixing and slicing the tissue, one must also test whether the memory effect is robust to fixation procedures and whether it lasts for days, not just minutes.
In view of the very limited search for flash memory proteins undertaken here, we are optimistic that superior performance may be found among other rhodopsin-like proteins. One should not restrict the search to mutants of Arch. Among the vast number of natively bistable rhodopsin-like proteins,15 there may be some that are fluorescent and voltage sensitive. A more detailed structural analysis of Arch(D95H) and D95Q would help guide this search. In particular, it may be helpful to identify the isomerization state of the retinal in the fluorescent state as well as the voltage-induced shifts in structure and protonation.
Improved flash memory proteins could be used in vivo in two modalities. If one is content to image the optically accessible region of the brain, then the readout could be performed in the live animal. This approach has the advantage that the protein can be reset and the measurement repeated multiple times, thereby averaging out uncorrelated baseline activity. If one wishes to image a larger or deeper region of the brain than is optically accessible, then one could fix the brain and either clarify or slice the tissue. This procedure is obviously terminal.
While we have focused on fluorescence as a readout, other modalities may also be feasible. Particularly attractive are multiphoton techniques such as two-photon fluorescence and stimulated Raman scattering, as these techniques have greater depth penetration than the visible light used in one-photon imaging. Two-photon fluorescence provides a very localized excitation volume, avoiding the problem of unintentional resetting of proteins from scattered imaging illumination. Nonresonant Raman or infrared absorption techniques may be able to determine the isomerization state of the retinal without inducing changes in this state. These techniques could integrate signal for longer times than fluorescent readouts, thereby increasing sensitivity.
There are several ways in which one might use flash memory proteins in neuroscience experiments. Sample and hold proteins are probably most useful when the neural activity is linked to a repeatable stimulus, e.g., in a sensory processing experiment. One could then repeat the stimulus multiple times, interleaved with trials without the stimulus. By varying the interval between stimulus and “write” flash, one may determine the precise sequence in which the stimulus activates neurons. Light-gated integrators may be more useful in identifying brain regions that show enhanced activity during spontaneously generated behaviors. One could deliver a flash of light to the brain upon observing the desired behavior and then fix and image the brain region of interest.
Materials and Methods
See the Supporting Information for detailed materials and methods, summarized below.
Molecular Biology
A library of Arch(D95X) mutants was generated by performing saturation mutagenesis of residue Asp95 in Arch in the pET-28b vector. To allow for expression in HEK-293T cells, the Arch(D95X) library was cloned into a lentiviral mammalian expression vector (Addgene plasmid 22051 cut with the restriction enzymes BamHI and AgeI).24 The final library consisted of Arch(D95X) fused to C-terminal eGFP, under a ubiquitin promoter. For neuronal expression, the (D95H) point mutation was made on Addgene plasmid 35514 (pLenti-CaMKIIa-eArch 3.0-eYFP).25
Fluorescence Imaging of Arch(D95X) in E. coli
Arch(D95X) mutants were expressed in E. coli (strain BL21) as previously described.21 Carbonyl cyanide m-chlorophenyl hydrazine (CCCP, 50 μg/mL) was added to neutralize membrane potential, and the cells were spread on a glass coverslip for imaging. White light emission from a supercontinuum laser (Fianium SC-450-6) was spectrally selected using an acousto-optic tunable filter. A digital micromirror device (Texas Instruments Lightcrafter) was used to project patterned illumination into the microscope.
Combined Fluorescence and Patch-Clamp Apparatus
Fluorescence imaging of Arch mutants in mammalian cells (HEK-293T and neurons) was performed on a home-built, inverted wide-field microscope. Patch-clamp experiments were performed at room temperature (25 °C) using an Axopatch 200B amplifier (Molecular Devices). All patch-clamp data in HEK cells were acquired in voltage-clamp mode; all patch-clamp data in neurons were acquired in current-clamp mode. In each combined fluorescence and patch-clamp experiment, we illuminated the sample with a series of laser pulses (I = 250 W/cm2 unless otherwise specified) while varying the voltage or current across the cell membrane. The experimental sequence was repeated multiple times to ensure that observed effects were not due to photobleaching.
Numerical Simulation of Three-State Model
Numerical simulation of a three-state model of light-gated voltage integration was implemented in MATLAB. A system of ordinary differential equations was defined with states D1, D2, and F, and rates kD1→D2, kD2→D1, kD2→F, and kF→D2. Rates kD1→D2 and kD2→D1 were assumed to depend on membrane voltage, while rates kD2→F and kF→D2 were assumed to depend on illumination wavelength and intensity.
Acknowledgments
We thank Peng Zou, Jennifer Hou, Samouil Farhi, Niklas Smedemark-Margulies, Vedhavali Nathan, Christopher Werley, and Tony Shen for discussions and for assistance with tissue culture and cloning. Noam Elkies suggested the name “flash memory”. This work was supported by PECASE award N00014-11-1-0549, the Harvard Center for Brain Science, NIH grants 1-R01-EB012498-01 and New Innovator grant 1-DP2-OD007428, the Harvard/MIT Joint Research Grants Program in Basic Neuroscience, a Herchel Smith Graduate Fellowship (VV), NIH MSTP grant T32GM07753-33 (VV), and an NSF Graduate Fellowship (DRH). D.B. acknowledges support by a Rubicon Grant of The Netherlands Organization for Scientific Research (NWO). All experiments with animals were approved by the Harvard institutional animal care and use committee (IACUC).
Supporting Information Available
Text and figures describing experimental procedures, data analysis, and computational modeling. Characterization of bistability in the library of Arch(D95X) mutants. Characterization of Arch(D95H) and Arch(D95Q) by patch-clamp electrophysiology and fluorescence imaging. This material is available free of charge via the Internet at http://pubs.acs.org.
The authors declare the following competing financial interest(s): A.E.C. is a founder of Q-State Biosciences.
Funding Statement
National Institutes of Health, United States
Supplementary Material
References
- Ragan T.; Kadiri L. R.; Venkataraju K. U.; Bahlmann K.; Sutin J.; Taranda J.; Arganda-Carreras I.; Kim Y.; Seung H. S.; Osten P. Nat. Methods 2012, 9, 255–258. [DOI] [PMC free article] [PubMed] [Google Scholar]
- Chung K.; Wallace J.; Kim S.; Kalyanasundaram S.; Andalman A. S.; Davidson T. J.; Mirzabekov J. J.; Zalocusky K. A.; Mattis J.; Denisin A. K. Nature 2013, 497, 332–337. [DOI] [PMC free article] [PubMed] [Google Scholar]
- Takemura S.; Bharioke A.; Lu Z.; Nern A.; Vitaladevuni S.; Rivlin P. K.; Katz W. T.; Olbris D. J.; Plaza S. M.; Winston P. Nature 2013, 500, 175–181. [DOI] [PMC free article] [PubMed] [Google Scholar]
- Helmstaedter M.; Briggman K. L.; Turaga S. C.; Jain V.; Seung H. S.; Denk W. Nature 2013, 500, 168–174. [DOI] [PubMed] [Google Scholar]
- Cai D.; Cohen K. B.; Luo T.; Lichtman J. W.; Sanes J. R. Nat. Methods 2013, 10, 540–547. [PubMed] [Google Scholar]
- Kralj J. M.; Douglass A. D.; Hochbaum D. R.; Maclaurin D.; Cohen A. E. Nat. Methods 2012, 9, 90–95. [DOI] [PMC free article] [PubMed] [Google Scholar]
- Chen T.; Wardill T. J.; Sun Y.; Pulver S. R.; Renninger S. L.; Baohan A.; Schreiter E. R.; Kerr R. A.; Orger M. B.; Jayaraman V. Nature 2013, 499, 295–300. [DOI] [PMC free article] [PubMed] [Google Scholar]
- Cao G.; Platisa J.; Pieribone V. A.; Raccuglia D.; Kunst M.; Nitabach M. N. Cell 2013, 154, 904–913. [DOI] [PMC free article] [PubMed] [Google Scholar]
- Ahrens M. B.; Orger M. B.; Robson D. N.; Li J. M.; Keller P. J. Nat. Methods 2013, 10, 413–420. [DOI] [PubMed] [Google Scholar]
- Guenthner C. J.; Miyamichi K.; Yang H. H.; Heller H. C.; Luo L. Neuron 2013, 78, 773–784. [DOI] [PMC free article] [PubMed] [Google Scholar]
- Zamft B. M.; Marblestone A. H.; Kording K.; Schmidt D.; Martin-Alarcon D.; Tyo K.; Boyden E. S.; Church G. PLoS One 2012, 7, e43876. [DOI] [PMC free article] [PubMed] [Google Scholar]
- Peron S.; Svoboda K. Nat. Methods 2010, 8, 30–34. [DOI] [PubMed] [Google Scholar]
- Ntziachristos V. Nat. Methods 2010, 7, 603–614. [DOI] [PubMed] [Google Scholar]
- Hillebrecht J. R.; Koscielecki J. F.; Wise K. J.; Marcy D. L.; Tetley W.; Rangarajan R.; Sullivan J.; Brideau M.; Krebs M. P.; Stuart J. A.; Birge R. R. NanoBiotechnology 2005, 1, 141–151. [Google Scholar]
- Tsukamoto H.; Terakita A. Photochem. Photobiol. Sci. 2010, 9, 1435–1443. [DOI] [PubMed] [Google Scholar]
- Wagner N. L.; Greco J. A.; Ranaghan M. J.; Birge R. R. J. R. Soc. Interface 2013, 10, 20130197. [DOI] [PMC free article] [PubMed] [Google Scholar]
- Manor D.; Hasselbacher C.; Spudich J. L. Biochemistry (N. Y.) 1988, 27, 5843–5848. [DOI] [PubMed] [Google Scholar]
- Kolodner P.; Lukashev E. P.; Ching Y.; Rousseau D. L. Proc. Natl. Acad. Sci. U. S. A. 1996, 93, 11618–11621. [DOI] [PMC free article] [PubMed] [Google Scholar]
- Geibel S.; Friedrich T.; Ormos P.; Wood P. G.; Nagel G.; Bamberg E. Biophys. J. 2001, 81, 2059–2068. [DOI] [PMC free article] [PubMed] [Google Scholar]
- Kralj J. M.; Hochbaum D. R.; Douglass A. D.; Cohen A. E. Science 2011, 333, 345–348. [DOI] [PubMed] [Google Scholar]
- Maclaurin D.; Venkatachalam V.; Lee H.; Cohen A. E. Proc. Natl. Acad. Sci. U.S.A. 2013, 110, 5939–5944. [DOI] [PMC free article] [PubMed] [Google Scholar]
- Gong Y.; Li J. Z.; Schnitzer M. J. PLoS One 2013, 8, e66959. [DOI] [PMC free article] [PubMed] [Google Scholar]
- Gradinaru V.; Zhang F.; Ramakrishnan C.; Mattis J.; Prakash R.; Diester I.; Goshen I.; Thompson K. R.; Deisseroth K. Cell 2010, 141, 154–165. [DOI] [PMC free article] [PubMed] [Google Scholar]
- Boyden E. S.; Zhang F.; Bamberg E.; Nagel G.; Deisseroth K. Nat. Neurosci. 2005, 8, 1263–1268. [DOI] [PubMed] [Google Scholar]
- Mattis J.; Tye K. M.; Ferenczi E. A.; Ramakrishnan C.; O’Shea D. J.; Prakash R.; Gunaydin L. A.; Hyun M.; Fenno L. E.; Gradinaru V. Nat. Methods 2011, 9, 159–172. [DOI] [PMC free article] [PubMed] [Google Scholar]
Associated Data
This section collects any data citations, data availability statements, or supplementary materials included in this article.