Abstract
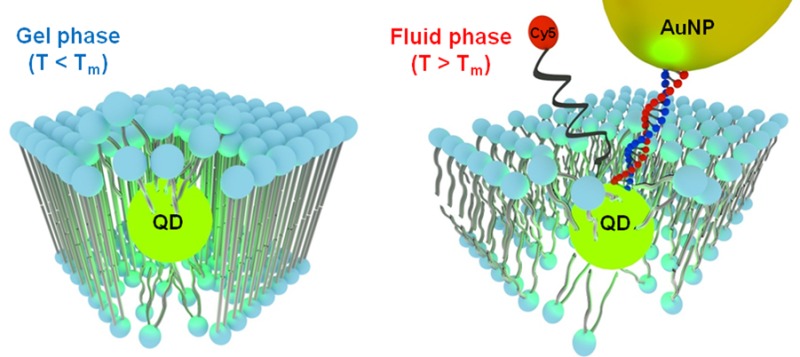
Lipid vesicle encapsulation is an efficient approach to transfer quantum dots (QDs) into aqueous solutions, which is important for renewable energy applications and biological imaging. However, little is known about the molecular organization at the interface between a QD and lipid membrane. To address this issue, we investigated the properties of 3.0 nm CdSe QDs encapsulated within phospholipid membranes displaying a range of phase transition temperatures (Tm). Theoretical and experimental results indicate that the QD locally alters membrane structure, and in turn, the physical state (phase) of the membrane controls the optical and chemical properties of the QDs. Using photoluminescence, ICP-MS, optical microscopy, and ligand exchange studies, we found that the Tm of the membrane controls optical and chemical properties of lipid vesicle-embedded QDs. Importantly, QDs encapsulated within gel-phase membranes were ultrastable, providing the most photostable non-core/shell QDs in aqueous solution reported to date. Atomistic molecular dynamics simulations support these observations and indicate that membranes are locally disordered displaying greater disordered organization near the particle–solution interface. Using this asymmetry in membrane organization near the particle, we identify a new approach for site-selective modification of QDs by specifically functionalizing the QD surface facing the outer lipid leaflet to generate gold nanoparticle–QD assemblies programmed by Watson–Crick base-pairing.
Introduction
Luminescent semiconductor nanocrystals, or quantum dots (QDs), have attracted increasing interest due to their tunable photoluminescence (PL), high quantum yield, photostability, and wideband excitation in comparison with organic dyes.1−5 To realize the potential of QDs as photosensitizers in green energy applications and as probes for in vivo imaging, particles should ideally be suspended in aqueous environments. However, high-quality QDs are typically prepared in organic solvents and capped with hydrophobic ligands.6 To suspend QDs in aqueous media, two main strategies are widely employed: (a) encapsulation within polymeric amphiphiles7 and (b) hydrophilic ligand exchange.8−11 A relatively unexplored strategy is the incorporation of as-synthesized QDs into the hydrophobic leaflets of phospholipid membranes. This is an attractive approach because it provides for a viable strategy to interface living cells with inorganic nanomaterials possessing unique optical and electronic properties.12−15 Accordingly, several reports show that QD encapsulation within membranes is useful in biological imaging and in directing QD uptake within the plasma membrane of living cells.16,17
To take full advantage of Lipid-QD (L-QD) assemblies, it is important to understand the molecular interface between these two materials, which poses a significant challenge for conventional spectroscopic analysis.18 For example, the interaction of nanoparticles with lipid membranes remains difficult to predict, and can be dependent on a number of factors, such as nanoparticle size, hydrophobicity, and surface charge density.19,20 Consequently, nanoparticles have been observed to adsorb onto the outer leaflet of membranes, incorporate within a membrane, or cause the deformation of membranes to generate nanoscale holes.21−24 In the case of hydrophobic 2.0–5.0 nm QDs, electron and optical microscopy indicates that the nanoparticles partition into the hydrophobic region of the lipid membrane.17 Given that the typical diameter of QDs is commiserate with the typical thickness of phospholipid membranes, it is not clear how the QD distorts the organization of the lipid bilayer, and correspondingly, how the organization of the lipid membrane influences the physical and chemical properties of the semiconductor nanocrystal. Importantly, current reports do not distinguish between QDs embedded within lipid membranes that are in the gel phase and those that are in the fluid phase, leaving it unclear as to how the phase of the lipid membrane would impact the QD. Understanding the supramolecular organization of this organic–inorganic interface is important in realizing the potential of QDs as probes to manipulate and study living cells.
Herein, we show that the properties of lipid encapsulated QDs are highly dependent on the phase of the membrane; QDs within fluid-phase membranes rapidly photo-oxidize and undergo photocorrosion, in contrast to gel-phase lipids that protect QDs, rendering them photostable at ambient conditions for at least 60 days. Thus, the ordered gel-phase membrane provides a simple and useful means of preparing the most photostable and water-soluble non-core/shell luminescent QDs reported to date. ICP-MS, PL, and ligand exchange studies further confirm the role of the lipid membrane in controlling surface accessibility of QDs. Dynamic light scattering (DLS) and FT-IR measurements indicate that QDs do not significantly alter the ensemble properties of the lipid vesicles. However, atomistic molecular dynamics (MD) simulations show that QD encapsulation leads to local distortion of membrane organization, as well as rearrangement of the QD surface ligands. Interestingly, membrane distortion for fully saturated gel-phase lipids is more limited than that for lipid membranes in the fluid phase. On the basis of these results, we site-selectively functionalize the encapsulated QDs at the side facing the outer leaflet of the membrane with water-soluble ligands such as polyethylene glycol (PEG) and oligonucleotides. By taking advantage of the asymmetric distribution of DNA ligands, we generate hybrid gold nanoparticle-QD assemblies tethered to the lipid membrane. Therefore, membrane-encapsulation offers a promising approach for the next-generation of QDs (as proposed by Smith and Nie)25 with site-selective ligand placement.
Results and Discussion
Lipid-QD (L-QD) Assemblies
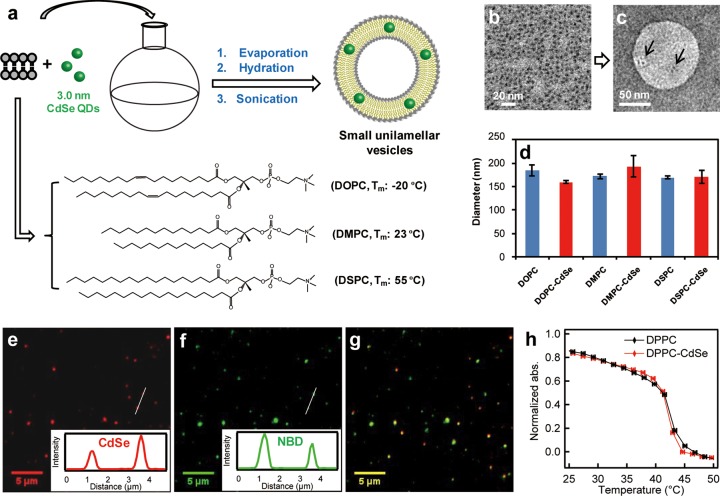
Non-core/shell CdSe QDs were used in this study because the optical properties of these particles are extraordinarily sensitive to their surface environment, thus providing a probe to monitor accessibility to the QD surface. 3.0 nm CdSe QDs were synthesized via modified literature methods using oleic acid (OA) as a coordinating surfactant (Supporting Information 1).26,27 The size of CdSe nanoparticles was verified by TEM (Supporting Information Figure S1). Three representative phospholipids with a range of melting temperatures (Tm) were used in this study, 1,2-dioleoyl-sn-glycero-3-phosphocholine (DOPC, Tm = −20 °C), 1,2-dimyristoyl-sn-glycero-3-phosphocholine (DMPC, Tm = 23 °C), and 1,2-distearoyl-sn-glycero-3-phosphocholine (DSPC, Tm = 55 °C). Therefore, at ambient laboratory conditions, DOPC is in a fluid phase (liquid disordered phase), while DSPC is in a gel phase (solid ordered phase), and DMPC lipids are near the gel to fluid transition temperature. To generate L-QD assemblies, we mixed the phospholipids and QDs at a 5000:1 molar ratio in chloroform, evaporated the solvent, then rehydrated the film in DI water, and sonicated the solution (Figure 1a and Supporting Information 2). Negative stain TEM of DSPC-QD vesicles showed the incorporation of QDs within the lipid membrane, in agreement with literature precedent (Figure 1b,c). This is further supported by fluorescence microscopy of QDs and fluorescently doped lipid vesicles that showed a high degree of colocalization (Figure 1e–g, Supporting Information 3 and Figure S3). DLS of L-QD vesicles showed that QD incorporation does not significantly alter the average hydrodynamic diameter of the lipid vesicles (∼170 nm) (Figure 1d and Supporting Information Table S1). In principle, each 170 nm vesicle should contain ∼20 QDs when doped with a 5000:1 lipid:QD molar ratio. On the basis of absorbance and TEM, however, the average number of QDs per vesicle is ∼11. This is reasonable and likely due to nonspecific adsorption of QDs to the glassware and possible QD aggregation during the transfer into the lipid vesicle and subsequent sonication. Temperature-dependent FT-IR spectroscopy of the L-QD vesicles indicated that the ensemble Tm of the representative lipid, DPPC (1,2-dipalmitoyl-sn-glycero-3-phosphocholine), is not affected by QD incorporation under these conditions (Figure 1h and Supporting Information Figure S4). Taken together, the TEM, FT-IR, DLS, and PL imaging studies confirmed that QDs incorporated within the membrane of vesicles but did not alter their ensemble properties.
Figure 1.
Formation and characterization of L-QD hybrid vesicles. (a) Formation of L-QD vesicles via solvent evaporation, hydration and probe sonication. (b and c) TEM image of CdSe QDs and negative stain TEM image of DSPC-CdSe vesicles. Arrows indicate the location of QDs. (d) Size of DOPC, DOPC-CdSe, DMPC, DMPC-CdSe, DSPC, and DSPC-CdSe vesicles obtained by DLS measurement. (e) and (f) are representative fluorescence images of CdSe QDs, and NBD-PC doped in DSPC vesicles. (g) is the merged image of (e) and (f), which shows colocalization of CdSe QDs and DSPC vesicles indicating the incorporation of QDs in the lipid membrane. Colocalization of CdSe QDs and DOPC vesicles is shown in Supporting Information Figure S3. (h) Thermal phase transition of DPPC and DPPC-CdSe vesicles obtained by plotting the intensity of the CH2 stretch (2851 cm–1) versus temperature from temperature-dependent FT-IR spectra.28
Photostability of CdSe QDs in Phospholipid Membranes
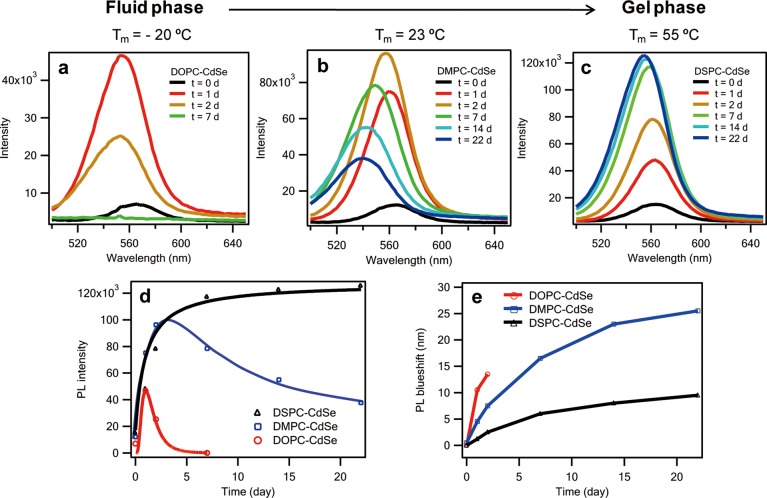
To better understand the role of membrane encapsulation in modulating the properties of QDs, we studied their photostability by PL spectroscopy. Initially, the PL spectra of CdSe QDs in DOPC, DMPC, and DSPC displayed identical peak positions and similar intensities, thus indicating that the transfer efficiency into the different types of lipid vesicles was similar (Figure 2a–c, black lines). Interestingly, we found that the PL of QDs in DOPC, DMPC, and DSPC drastically increased, and, in some cases, this was followed by rapid decrease in a phospholipid-dependent manner when stored under ambient laboratory conditions. Initially, all three samples showed a large PL intensity increase and blue shift upon one day of exposure to ambient light (Figure 2a–c, red curve). After two days, the PL of DOPC-QD vesicles dropped by ∼40%, blue-shifted by ∼13 nm, and the fwhm increased from 36 to 50 nm (Figure 2 and Supporting Information Figure S5a). This trend continued as a function of time, and the PL intensity was fully quenched after 1 week (Figure 2a, green curve). Surprisingly, the PL of QDs in the gel phase DSPC progressively became brighter (up to 9-fold) and slightly blue-shifted (<10 nm), reaching a near steady state after 1 week that was maintained for up to 2 months (Figure 2c–e, Supporting Information Figure S6). Importantly, the fwhm of the DSPC-QD vesicles remained virtually unchanged while aging in aqueous conditions under light (Supporting Information Figure S5c). DMPC-QD vesicles, whose Tm = 23 °C, displayed a change of PL that was intermediate between that of fluid DOPC vesicles and gel-phase DSPC vesicles, first becoming bright (8-fold), then slowly quenching and blue shifting over a period of 3 weeks. Note that the PL spectra of DOPC-QD, DSPC-QD, and DMPC-QD vesicles were nearly identical and did not display significant changes in peak position, line width, and intensity over a period of 1 week when stored in the dark (Supporting Information Figure S7). This confirms that PL spectral changes are light-driven processes. To verify the role of oxygen in driving PL shifts, DOPC-encapsulated QDs were stored under a N2 atmosphere, and the PL spectra were recorded over a period of 1 month (Supporting Information Figure S8). In this case, QDs displayed a 3-fold enhancement in PL intensity at t = 9 day. This is in stark contrast to the DOPC-QD samples that are fully quenched at t = 7 day. Nonetheless, the DOPC-QD samples stored under N2 eventually displayed quenching and blue-shifting in PL by the t = 30 day time point, which may be due to the presence of residual oxygen over this long experimental duration. Taken together, these results indicate that the PL intensity changes are due to light-induced and oxygen-mediated photo-oxidation and photocorrosion processes that are controlled by the organization (phase) of the lipid membrane.
Figure 2.
Membrane-dependent photostability of CdSe within L-QD assemblies. Time-dependent PL spectra of CdSe QDs in (a) DOPC, (b) DMPC, and (c) DSPC vesicles stored under ambient laboratory conditions. (d) Maxima PL intensity of L-QD vesicles as a function of time. (e) PL blue-shifts of L-QD vesicles as a function of time.
Lipid Membrane Controlled QD PL Shift
The observed PL blue shift and photobrightening followed by quenching of QDs in DOPC is consistent with photo-oxidation of QDs.29 In contrast, the 9-fold enhancement in PL quantum yield and extraordinary photostability (up to 2 months) of DSPC encapsulated QDs is highly unusual, and to the best of our knowledge, has never been reported for simple QDs in aqueous solvents. Therefore, we propose that the divergent PL properties of L-QD assemblies in DOPC and DSPC are likely due to two main processes. First, the partition coefficient of oxygen in fluid lipids is approximately 1 order of magnitude larger than that in gel-phase lipids,30 thus increasing the rate of photo-oxidation in DOPC. Moreover, this observation is in agreement with literature precedent showing the physical state of the lipid bilayer significantly affects its water and small molecule permeability.31,32 For example, the water permeability of most fluid bilayers (∼10–4 cm/s) is more than 2 orders of magnitude greater than that of phospholipids in the gel state (∼10–6 cm/s).31 To confirm this, we tested the phase-dependent accessibility of reactive species to the surface of the QDs by treating the samples with H2O2, which can chemically oxidize and quench QDs33,34 (Supporting Information Figure S9). We found that QDs in DOPC vesicles were quenched when treated with 1–10 μM H2O2, in contrast to QDs in DSPC that maintained their emission after identical treatment to the chemical oxidant. Therefore, gel-phase lipids act as a more effective barrier than fluid-phase lipids to protect QDs from reactive species. This suggests an explanation for the differential rates of PL blue-shift (Figure 2e), but does not account for the ultrastability and brightness of CdSe-DSPC assemblies.
Second, to explain the observed time-dependent difference of QD PL and ultrastability in gel-phase vesicles, we hypothesize that QD surface oxide species have different dissolution rates as a function of the phase of the lipid membrane (Figure 3a,b). Specifically, we propose that oxide species (SeO2 and CdO)35,36 remain bound to QDs within the DSPC membrane, offering a protective shell,37,38 in contrast to QDs in DOPC membranes (and other water-stabilized QDs39) where oxides are continually released possibly due to the lateral motion and free volume in the fluid lipid membrane.40 To test the model of lipid-dependent oxide dissolution, ICP-MS was used to measure the concentration of Se species in the supernatant of the L-QD samples (Figure 3c). No significant change in Se content was observed in the supernatant of samples containing DSPC-QD stored at ambient conditions for seven days. In contrast, identically treated DOPC-QD samples showed a 1 order of magnitude increase in dissolved [Se] (from 2.8 to 25.9 μM), thus indicating that these QDs are undergoing sustained photocorrosion and dissolution.41 Therefore, fluid-phase DOPC-QD vesicles may form transient core/shell QDs that are continuously whittled due to dissolution of the oxides. This is supported by PL data that show broadening and blue-shifting of spectra for DOPC and DMPC incorporated QDs, which is significantly less pronounced for DSPC-QD vesicles (Supporting Information Figure S5). Moreover, the diffusion rate of oxide species across the lipid membrane may parallel other small molecule permeability data (vide supra), which shows phase-dependent behavior.31 Taken together, the ICP-MS results and the magnitude of the PL shift suggest that approximately one monolayer of oxide forms on the surface of the nanocrystal in DSPC, thus increasing the PL quantum yield, and rendering these particles as the most photostable simple QD reported, to the best of our knowledge.
Figure 3.
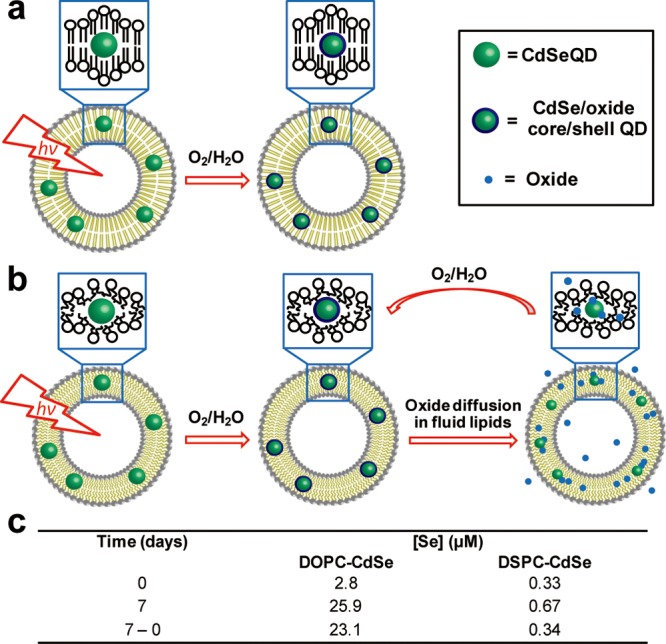
The mechanism of phase-dependent photo-oxidation for QDs. Proposed model of lipid phase-dependent photo-oxidation behavior for CdSe QDs in (a) gel phase lipid vesicles and (b) fluid phase lipid vesicles. Note: Surface ligands are not shown for clarity. (c) Table summarizing [Se] in the supernatant of the L-QD vesicle solutions as a function of time. Data were obtained by ICP-MS.
Given that DOPC is chemically distinct from DSPC and DMPC, and is more prone to oxidation, we designed an experiment to ensure that these differential PL shifts are due to the phase (organization) of the lipid membrane rather than chemical differences in phospholipid structure. We generated DMPC-QD assemblies and divided the sample into two identical aliquots, one stored at 40 °C (fluid phase) and the second at 4 °C (gel phase) (Supporting Information 7). Both samples were illuminated under the same light source, and the PL spectra were collected as a function of time (Supporting Information Figure S10). In agreement with the trends observed for DOPC-QD and DSPC-QD assemblies (Figure 2a and c), we found that the PL intensity of gel-phase DMPC QDs increased by ∼10-fold over a period of 7 days, whereas fluid-phase DMPC-QDs displayed an initial increase in PL followed by a blue-shift and rapid ∼5-fold quenching of emission between day one and day seven. These data further confirm the remarkable role of the lipid membrane organization (phase) in controlling photo-oxidation and photostability of QDs as proposed in Figure 3.
Atomistic Molecular Dynamics (MD) Simulation of L-QD Assemblies
Given that the QD likely changes the local microenvironment of the lipid membrane, we next set out to use atomistic MD simulations to better understand how lipid structure and dynamics are perturbed by the QD. To accommodate for the ∼10% polydispersity of particle diameters, 2.6 and 3.4 nm QDs were modeled and analyzed (Supporting Information 8 and Table S2). Atomistic simulations of 2.6 nm CdSe QD passivated with 121 OA ligands in DOPC, DMPC, and DSPC vesicles were performed for up to 150 ns. Snapshots are shown in Figure 4a–c (see Supporting Information Figure S11 for 3.4 nm CdSe). Simulations show that in all cases, QDs incorporate within the lipid membrane, and lead to distortion of the lipid membrane organization as well as rearrangement of the OA aliphatic tails. Importantly, the OA aliphatic chains rearranged to achieve a greater density within the plane of the membrane, while avoiding the aqueous bilayer interface. As evident from the snapshots, DSPC lipid tails near the QD were disrupted from their ordered gel-phase structures. To quantify the fluidity of lipid tails, we plotted the time autocorrelation function associated with tail orientation in Figure 4d; a steeper decay indicates faster reorientation, and a lower final value indicates a wider range of motion (see Supporting Information 8). QD-perturbed DSPC tails are more available to reorient than those that remain in a gel-phase conformation (far from QD surface); however, even for the perturbed DSPC tails, reorientation is slower and more limited than for DMPC or DOPC. As evident from Supporting Information video 1, the OA ligands also exhibit a narrower range of motion in DSPC than in DOPC. DOPC tail dynamics are essentially unaffected by the QD, while DMPC tails experience some slowing near the QD, but retain more fluid character than DSPC tails. It is reasonable to infer from the simulated tail dynamics that the rates of any events involving lipid tail rearrangement near the QD (e.g., ligand exchange) will be slower for DSPC than that for DOPC lipids, with DMPC intermediate. The same trends were observed for both 2.6 and 3.4 QD sizes with different numbers of OA ligands passivating the QDs (Supporting Information Figure S12). Therefore, the atomistic MD simulations are in support of experimental results (Figure 2), and the proposed lipid-dependent photo-oxidation model is shown in Figure 3.
Figure 4.
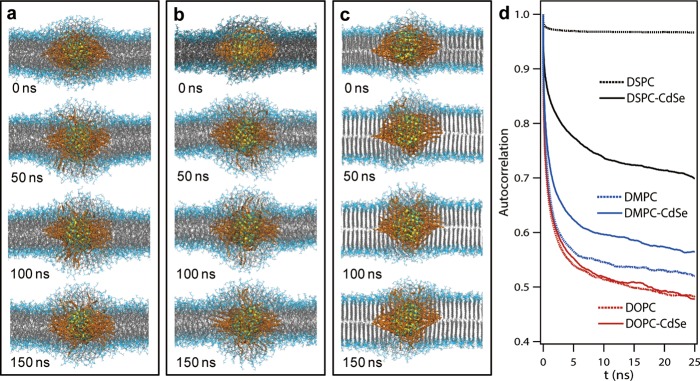
Atomistic MD simulation of L-QD assemblies. Representative snapshots of atomistic MD simulation of 2.6 nm CdSe nanocrystal (0–150 ns) in fluid phase DOPC (a), DMPC (b), and gel phase DSPC vesicles (c). Lipid tails and OA ligands are shown in gray and orange, respectively. Solvent is omitted for clarity. (d) Time correlation function of tail orientations for lipids perturbed by an embedded 2.6 nm CdSe QD (solid line) and lipids far from the QD (dotted line), averaged over the final 50 ns of simulation trajectories.
Site-Specific Ligand Exchange for QDs Using Lipid Membrane Templates
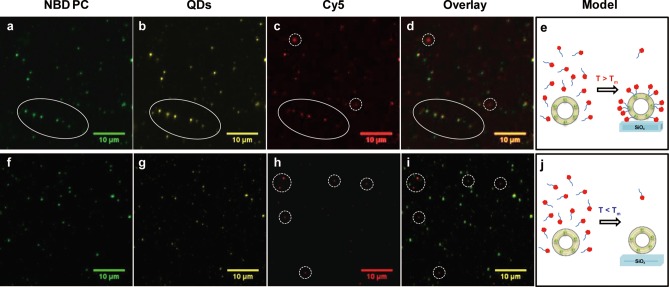
On the basis of the MD simulations, the surface of QDs near the water–lipid interface likely presents regions of reduced density of capping ligands and increased surface accessibility, thus offering sites for selective ligand exchange. This is highly desirable, given the lack of methods to direct the location of ligand binding on the surface of nanoparticles in general.42 To test this idea, we first determined whether water-soluble ligands, such as SH-PEG (SH-(CH2CH2O)8CH3), would displace OA on QDs encapsulated in DOPC and DSPC. We observed ligand exchange in both types of lipids at 100 μM SH-PEG, as evidenced by PL quenching (Supporting Information Figure S13). In support of the MD simulations, DSPC membranes were more organized near the QD and blocked ligand exchange for SH-PEG concentrations up to 10 μM, in contrast to DOPC, which showed quenching at these conditions. To further verify ligand exchange, we performed PL microscopy colocalization using fluorescent ligand (10 μM, SH-(CH2CH2O)82-Cy5) and fluorescently doped lipid vesicles (NBD-PC) (Supporting Information 9). The colocalization of NBD-PC (Figure 5a), CdSe QDs (Figure 5b), and SH-(CH2CH2O)82-Cy5 (Figure 5c), as highlighted in the overlay (Figure 5d), confirms partial ligand exchange in fluid DOPC vesicles. In contrast, no colocalization of the DSPC-CdSe QD vesicles was observed with the Cy5 emission as indicated by the overlay image (Figure 5i). Control DOPC vesicles that lacked QDs also did not show colocalization between the NBD-PC emission and Cy5 (Supporting Information Figure S14), confirming that ligand binding to the vesicle is mediated by the QD. We next aimed to determine the average number of exchanged ligands per DOPC membrane-encapsulated QD. This is important, because extensive exchange would likely result in the translocation of QDs into the aqueous phase and complete quenching of PL. UV–vis absorption indicated that the stoichiometry between Cy5 and QDs was approximately two to three ligands per particle, suggesting that only a few sites are available for ligand exchange under these conditions (Supporting Information Figure S15).
Figure 5.
Ligand exchange in lipid membrane embedded CdSe QDs. Ligand exchange for CdSe QDs encapsulated within DOPC (a–e) and DSPC (f–j) vesicles. Colocalization of fluorescence emission from NBD-PC (a), QDs (b), and Cy5 (c) in individual DOPC vesicles indicates ligand exchange of QDs within fluid lipid vesicles (d and e). (f–j) Shows representative fluorescence microscopy images of QDs embedded within DSPC vesicles. (f) and (g) display colocalization, but (h) shows no localization with the QD embedded within the DSPC vesicles, indicating the lack of ligand exchange (i and j). The Cy5 signal in (h) (dotted circle) is due to the nonspecific adsorption of the ligand on the surface of glass, which is also shown in the DOPC-CdSe sample in (c) (dotted circles).
Hybrid Au-DNA-QD Assembly
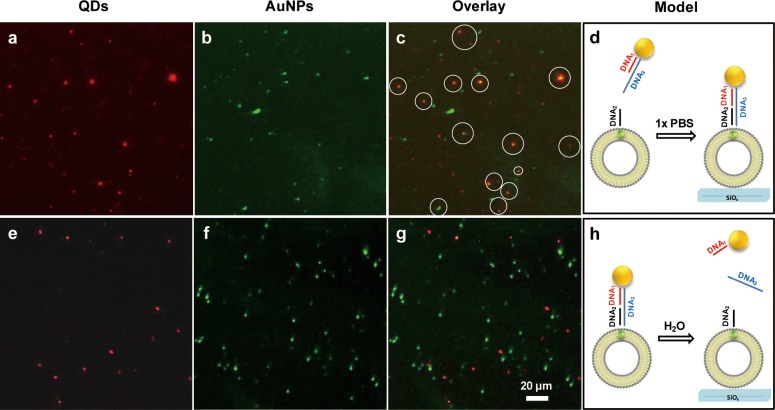
Having established that 2–3 ligands will bind to QDs within fluid-phase DOPC vesicles (10 μM, t ≈ 10 h), we next asked whether these ligands are available for directional binding to other materials. Incorporating ligands site-selectively with specific binding directionalities is a first step toward building next generation QDs.25 To achieve this goal, we performed ligand exchange with single-stranded thiolated DNA (10 μM, 5′-SH-GCC TAT GAA TGA GCT TCA GTG-3′, t ≈ 10 h). After washing, DNA-modified gold nanoparticles (AuNPs) that presented a complementary sequence were added and allowed to hybridize for 1 h (Supporting Information 10).43 The vesicles were subsequently adsorbed to a glass slide and imaged (Figure 6). The fluorescence emission of QDs identified the position of DOPC-CdSe vesicles (Figure 6a), while dark field scattering microscopy indicated the position of AuNPs (Figure 6b). The overlay image shows that more than 60% of L-QD vesicles were colocalized with AuNPs after hybridization (Figure 6c, solid circles). To verify that DNA-modified AuNPs were bound to QDs through specific Watson–Crick base pairing, we incubated the sample with DI water for 1 h as a stringency to dehybridize DNA duplexes. Subsequent PL and darkfield microscopy imaging confirms complete disassembly of AuNPs from QDs as indicated by the lack of colocalization between the two channels (Figure 6e–h). Ensemble PL measurements of these DNA-programmed AuNP-QD structures (Supporting Information Figure S16) show significant quenching of the QD emission, confirming the proximity (∼1–20 nm) of AuNP to the QD surface.44 Taken together, these data confirm that membrane-encapsulated QDs are site-specifically functionalized with DNA ligands that direct the assembly of DNA-AuNP structures (Figure 6d and h).
Figure 6.
Membrane-encapsulated QDs functionalized with DNA-AuNP. QD-DOPC vesicles were incubated with SH-DNA and hybridized with complementary DNA-AuNP, and then imaged using PL microscopy (a, QD), darkfield scattering microscopy (b, AuNP), and then overlaid to show colocalization (c). When this sample was treated with DI water, the QD emission was no longer localized with AuNP darkfield scattering (e–g), indicating dehybridization of double-stranded DNA and disassembly of QD-DNA-AuNP structures. (d) and (h) show the models for assembly and disassembly of QD-DNA-AuNP hybrid structures.
In summary, lipid vesicles offer a dynamic molecular template that places QDs within a two-dimensional and confined environment. We found that the molecular organization (phase) of the lipid controls access to the QD surface, and drastically controls photostability of QD. We showed that QDs in fluid DOPC vesicles are susceptible to photocorrosion and oxide diffusion, which would likely increase toxicity in biological settings. In contrast, the QDs in crystalline gel phase lipids are ultrastable, remaining bright over a period of at least 2 months in aqueous solution exposed to ambient light and oxygen. MD simulations showed that the QD incorporation led to distortion of the lipid membrane organization as well as rearrangement of the surface ligand tails in all cases, which support experimental findings and indicate higher ligand accessibility (lipid disorder and ligand reorganization) at QD sites near the lipid–water interface. We tested QD accessibility and showed (thiolated PEG and DNA) ligand binding to the QD surface, driving the assembly of hybrid semiconductor–noble metal structures associated with the lipid membrane. Therefore, membrane encapsulated QDs offer a promising template to generate the next generation of QDs with site-selective control of ligand organization.25 As a corollary, hybrid inorganic nanoparticles (e.g., CdSe–Au, Fe3O4–Au, CoPt–Au) generated using this strategy may also be useful for fluorescence-based imaging, magnetic-based targeting, delivery, cell separation, and MRI applications.45−101
Methods
Preparation of L-QD Vesicles
Small unilamellar vesicles were prepared by hydration of dried lipid-CdSe films followed by probe sonication. Typically, chloroform solutions of lipid (2.54 μmol) and CdSe QDs (0.5 nmol) were mixed in a 10 mL glass vial and dried under a slight vacuum using a R-210 rotavapor. The dried film was then hydrated in 1 mL of DI H2O. The obtained multilamellar vesicles (MLV) were further sonicated for 1 min (amplitude: 30%) using a probe sonicator to make small unilamellar vesicles (SUV).
Sample Characterization
TEM measurements were acquired on a Hitachi H-7500 transmission electron microscope at an accelerating voltage of 75 kV. The L-QD vesicles were visualized by negative staining TEM with 1% methylamine tungstate (Supporting Information 1). Dynamic light scattering (DLS) was used to estimate the hydrodynamic diameters of lipid vesicle samples as well as L-QD samples (Supporting Information 2). UV–visible absorption spectra were recorded using a nanodrop spectrophotometer. The fluorescence of the samples was monitored using a Horiba FluoroMax-3 fluorometer. L-QD vesicles were imaged in aqueous solution at room temperature using a Nikon Eclipse Ti microscope driven by the Elements software package (Supporting Information 3). Equilibrium temperature-dependent FTIR spectra were recorded on a Varian 3100 FTIR spectrometer equipped with liquid nitrogen cooled mercury cadmium telluride (MCT) detector (Supporting Information 4). The concentration of Se species in the supernatant of the L-QD samples was measured by a VG Plasma Quad III simultaneous inductively coupled plasma-mass spectrometer (ICP-MS).
Light-Induced Photo-oxidation of QDs in Vesicles
L-QD vesicle samples were stored under ambient laboratory conditions under room light, while control samples were wrapped in aluminum foil and placed in the dark (Supporting Information 5).
Atomistic Molecular Dynamics (MD) Simulation
CdSe nanocrystals of diameter 2.6 or 3.4 nm (compositions Cd257Se205 and Cd505Se413) were generated from a wurtzite lattice.46 OA ligands were covalently attached to surface Cd sites, and ligand-covered structures were equilibrated in a vacuum over 1 ns MD trajectories. QDs were then inserted into a vacant space between the leaflets of solvated, pre-equilibrated lipid bilayers that had been separated by 7 nm. The leaflets closed around the QD within 150 ps of MD simulation to produce bilayer-embedded QD structures, which were then simulated for 150 ns at 300 K and 1 bar pressure. Details of simulation parameters using Gromacs 4.5.447 followed the methods of West et al.48 Numbers of lipids, ligands, and solvent used for each simulation are listed in Supporting Information Table S2. Interaction parameters from the literature were used for lipids,49 CdSe,46 and for the oleic acid ligands;50 however, negative charges on each OA oxygen site were increased to compensate for the excess Cd charge, making each QD neutral.
Lipid tail orientational relaxation functions were obtained by first finding the unit vector μi directed from carbon 4 to carbon 9 on the sn-2 lipid tail of each lipid i, then calculating the average autocorrelation function Ci(t) = ⟨μi(τ)·μi(τ + t)⟩ over the final 50 ns of the trajectory. The averages of Ci(t) were taken over lipids i classified as either bulk-like (far from the QD) or perturbed (near the QD) based on their distance in the XY plane from the QD center. The cutoff radius was defined as the distance at which the lipid bilayer recovered its unperturbed thickness. In the case of DSPC, a subset of lipids inside the cutoff radius had gel-like properties; in these, the orientational relaxation function persisted above 0.92. These 20–30% of lipids were excluded from the average plotted in Figure 4.
Site-Specific Ligand Exchange for QDs Using the Disordered Lipid Membrane Template
In the ligand exchange experiment with thiolated PEG ligand (SH-(CH2CH2O)8CH3), 1, 10, and 100 μM thiolated PEG ligand was incubated with a 500 nM QD suspension encapsulated in DOPC and DSPC vesicles overnight in the dark (∼10 h) (Supporting Information Figure S13). In the ligand exchange experiment with fluorescently tagged ligand, 10 μM SH-(CH2CH2O)82-Cy5 was added to L-QD vesicles overnight in the dark (∼10 h), and then excess ligand was removed via rinsing with DI water five times before imaging.
Acknowledgments
K.S. would like to acknowledge support from the National Institutes of Health (NIH) through R01-GM097399-01, the Alfred P. Sloan Research Fellowship, and NHLBI Program Excellence in Nanotechnology (HHSN268201000043C). J.T.K. acknowledges support from NSF grant CHE-1213904 and the computational resources of the Extreme Science and Engineering Discovery Environment (XSEDE) supported by NSF grant OCI-1053575. DLS measurements were performed with the help of Dr. B. A. Kairdolf and Prof. S. Nie at Emory. We thank Daniel Stabley for the TOC graphic design. The TEM was performed with the support of Dr. E. R. Wright, Ms. H. Yi, and C. Xu at the Robert P. Apkarian Integrated Electron Microscopy Core of Emory University.
Supporting Information Available
Experimental details and movies. This material is available free of charge via the Internet at http://pubs.acs.org.
The authors declare no competing financial interest.
Figure 6 contained errors in the version published ASAP January 24, 2014; the correct version reposted January 27, 2014.
Funding Statement
National Institutes of Health, United States
Supplementary Material
References
- Michalet X.; Pinaud F. F.; Bentolila L. A.; Tsay J. M.; Doose S.; Li J. J.; Sundaresan G.; Wu A. M.; Gambhir S. S.; Weiss S. Science 2005, 307, 538–544. [DOI] [PMC free article] [PubMed] [Google Scholar]
- Bruchez M.; Moronne M.; Gin P.; Weiss S.; Alivisatos A. P. Science 1998, 281, 2013–2016. [DOI] [PubMed] [Google Scholar]
- Chan W. C. W.; Nie S. M. Science 1998, 281, 2016–2018. [DOI] [PubMed] [Google Scholar]
- Resch-Genger U.; Grabolle M.; Cavaliere-Jaricot S.; Nitschke R.; Nann T. Nat. Methods 2008, 5, 763–775. [DOI] [PubMed] [Google Scholar]
- Medintz I. L.; Uyeda H. T.; Goldman E. R.; Mattoussi H. Nat. Mater. 2005, 4, 435–446. [DOI] [PubMed] [Google Scholar]
- Murray C. B.; Norris D. J.; Bawendi M. G. J. Am. Chem. Soc. 1993, 115, 8706–8715. [Google Scholar]
- Gao X. H.; Cui Y. Y.; Levenson R. M.; Chung L. W. K.; Nie S. M. Nat. Biotechnol. 2004, 22, 969–976. [DOI] [PubMed] [Google Scholar]
- Aldana J.; Lavelle N.; Wang Y.; Peng X. J. Am. Chem. Soc. 2005, 127, 2496–2504. [DOI] [PubMed] [Google Scholar]
- Yang J.; Lee J. Y.; Ying J. Y. Chem. Soc. Rev. 2011, 40, 1672–1696. [DOI] [PubMed] [Google Scholar]
- Han Z.; Qiu F.; Eisenberg R.; Holland P. L.; Krauss T. D. Science 2012, 338, 1321–1324. [DOI] [PubMed] [Google Scholar]
- Wu H.; Zhu H.; Zhuang J.; Yang S.; Liu C.; Cao Y. C. Angew. Chem., Int. Ed. 2008, 47, 3730–3734. [DOI] [PubMed] [Google Scholar]
- Schulz M.; Olubummo A.; Binder W. H. Soft Matter 2012, 8, 4849–4864. [Google Scholar]
- Marshall J. D.; Schnitzer M. J. ACS Nano 2013, 7, 4601–4609. [DOI] [PMC free article] [PubMed] [Google Scholar]
- Damiano M. G.; Mutharasan R. K.; Tripathy S.; McMahon K. M.; Thaxton C. S. Adv. Drug Delivery Rev. 2013, 65, 649–662. [DOI] [PubMed] [Google Scholar]
- Rosi N. L.; Mirkin C. A. Chem. Rev. 2005, 105, 1547–1562. [DOI] [PubMed] [Google Scholar]
- Gopalakrishnan G.; Danelon C.; Izewska P.; Prummer M.; Bolinger P. Y.; Geissbuhler I.; Demurtas D.; Dubochet J.; Vogel H. Angew. Chem., Int. Ed. 2006, 45, 5478–5483. [DOI] [PubMed] [Google Scholar]
- Al-Jamal W. T.; Al-Jamal K. T.; Tian B.; Lacerda L.; Bomans P. H.; Frederik P. M.; Kostarelos K. ACS Nano 2008, 2, 408–418. [DOI] [PubMed] [Google Scholar]
- Carney R. P.; Astier Y.; Carney T. M.; Voïtchovsky K.; Jacob Silva P. H.; Stellacci F. ACS Nano 2012, 7, 932–942. [DOI] [PubMed] [Google Scholar]
- Ginzburg V. V.; Balijepalli S. Nano Lett. 2007, 7, 3716–3722. [DOI] [PubMed] [Google Scholar]
- Dasgupta S.; Auth T.; Gompper G. Soft Matter 2013, 9, 5473–5482. [Google Scholar]
- Hamada T.; Morita M.; Miyakawa M.; Sugimoto R.; Hatanaka A.; Vestergaard M. C.; Takagi M. J. Am. Chem. Soc. 2012, 134, 13990–13996. [DOI] [PubMed] [Google Scholar]
- Roiter Y.; Ornatska M.; Rammohan A. R.; Balakrishnan J.; Heine D. R.; Minko S. Nano Lett. 2008, 8, 941–944. [DOI] [PubMed] [Google Scholar]
- Zhang S.; Nelson A.; Beales P. A. Langmuir 2012, 28, 12831–12837. [DOI] [PubMed] [Google Scholar]
- Lenz P.; Johnson J. M.; Chan Y. H. M.; Boxer S. G. Europhys. Lett. 2006, 75, 659–665. [Google Scholar]
- Smith A. M.; Nie S. M. Nat. Biotechnol. 2009, 27, 732–733. [DOI] [PMC free article] [PubMed] [Google Scholar]
- Li J. J.; Wang Y. A.; Guo W.; Keay J. C.; Mishima T. D.; Johnson M. B.; Peng X. J. Am. Chem. Soc. 2003, 125, 12567–12575. [DOI] [PubMed] [Google Scholar]
- Peng Z. A.; Peng X. J. Am. Chem. Soc. 2001, 123, 183–184. [DOI] [PubMed] [Google Scholar]
- Forstner M. B.; Yee C. K.; Parikh A. N.; Groves J. T. J. Am. Chem. Soc. 2006, 128, 15221–15227. [DOI] [PubMed] [Google Scholar]
- Carrillo-Carrion C.; Cardenas S.; Simonet B. M.; Valcarcel M. Chem. Commun. 2009, 5214–5226. [DOI] [PubMed] [Google Scholar]
- Subczynski W. K.; Hyde J. S. Biophys. J. 1983, 41, 283–286. [DOI] [PMC free article] [PubMed] [Google Scholar]
- Carruthers A.; Melchior D. L. Biochemistry 1983, 22, 5797–5807. [Google Scholar]
- Carruthers A.; Melchior D. L. Biochemistry 1984, 23, 6901–6911. [DOI] [PubMed] [Google Scholar]
- Mancini M. C.; Kairdolf B. A.; Smith A. M.; Nie S. J. Am. Chem. Soc. 2008, 130, 10836–10837. [DOI] [PMC free article] [PubMed] [Google Scholar]
- Hay K. X.; Waisundara V. Y.; Zong Y.; Han M. Y.; Huang D. Small 2007, 3, 290–293. [DOI] [PubMed] [Google Scholar]
- Katari J. E. B.; Colvin V. L.; Alivisatos A. P. J. Phys. Chem. 1994, 98, 4109–4117. [Google Scholar]
- Hines D. A.; Becker M. A.; Kamat P. V. J. Phys. Chem. C 2012, 116, 13452–13457. [Google Scholar]
- Liu L.; Peng Q.; Li Y. Inorg. Chem. 2008, 47, 3182–3187. [DOI] [PubMed] [Google Scholar]
- Cordero S. R.; Carson P. J.; Estabrook R. A.; Strouse G. F.; Buratto S. K. J. Phys. Chem. B 2000, 104, 12137–12142. [Google Scholar]
- Ma J.; Chen J.-Y.; Zhang Y.; Wang P.-N.; Guo J.; Yang W.-L.; Wang C.-C. J. Phys. Chem. B 2007, 111, 12012–12016. [DOI] [PubMed] [Google Scholar]
- Olbrich K.; Rawicz W.; Needham D.; Evans E. Biophys. J. 2000, 79, 321–327. [DOI] [PMC free article] [PubMed] [Google Scholar]
- Derfus A. M.; Chan W. C. W.; Bhatia S. N. Nano Lett. 2003, 4, 11–18. [DOI] [PMC free article] [PubMed] [Google Scholar]
- Rosenthal S. J.; Chang J. C.; Kovtun O.; McBride J. R.; Tomlinson I. D. Chem. Biol. 2011, 18, 10–24. [DOI] [PMC free article] [PubMed] [Google Scholar]
- Yehl K.; Joshi J. P.; Greene B. L.; Dyer R. B.; Nahta R.; Salaita K. ACS Nano 2012, 6, 9150–9157. [DOI] [PMC free article] [PubMed] [Google Scholar]
- Pons T.; Medintz I. L.; Sapsford K. E.; Higashiya S.; Grimes A. F.; English D. S.; Mattoussi H. Nano Lett. 2007, 7, 3157–3164. [DOI] [PubMed] [Google Scholar]
- Shi W.; Sahoo Y.; Zeng H.; Ding Y.; Swihart M. T.; Prasad P. N. Adv. Mater. 2006, 18, 1889–1894. [Google Scholar]
- Liu Y.; Yehl K.; Narui Y.; Salaita K. J. Am Chem. Soc. 2013, 135, 5320–5323. [DOI] [PMC free article] [PubMed] [Google Scholar]
- Stabley D.; Schumacher C.; Marshall S.; Salaita K. Nat. Methods 2012, 9, 64–67. [DOI] [PubMed] [Google Scholar]
- Rabani E. J. Chem. Phys. 2001, 115, 1493–1497. [Google Scholar]
- Berendsen H. J. C.; Postma J. P. M.; DiNola A.; Haak J. R. J. Chem. Phys. 1984, 81, 3684–3690. [Google Scholar]
- West A.; Ma K.; Chung J. L.; Kindt J. T. J. Phys. Chem. A 2013, 117, 7114–7123. [DOI] [PubMed] [Google Scholar]
- Berger O.; Edholm O.; Jähnig F. Biophys. J. 1997, 72, 2002–2013. [DOI] [PMC free article] [PubMed] [Google Scholar]
- Hoopes M. I.; Noro M. G.; Longo M. L.; Faller R. J. Phys. Chem. B 2011, 115, 3164–3171. [DOI] [PubMed] [Google Scholar]
Associated Data
This section collects any data citations, data availability statements, or supplementary materials included in this article.


