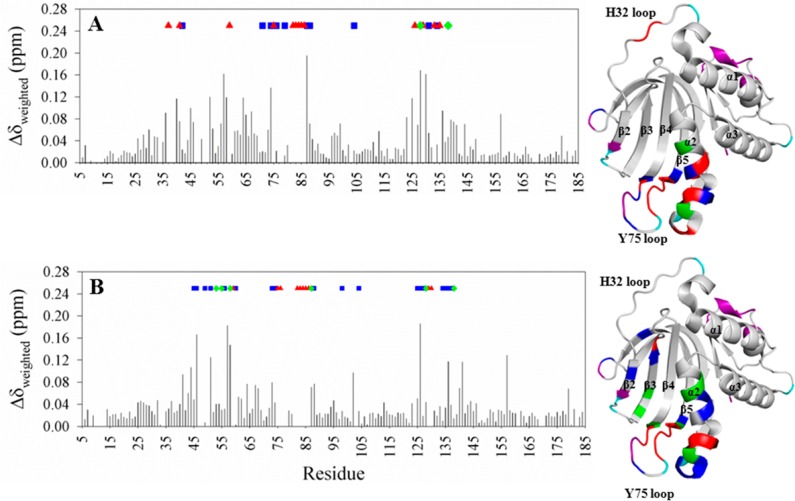
Figure 7.
Per-residue differences obtained from comparing cross-peaks in the HSQC spectrum of wt apo-HasAp with cross-peaks in the HSQC spectra of (A) Y75A apo-HasAp and (B) H83A apo-HasAp. Residues in the mutants whose cross-peaks disappear are denoted with red triangles; residues whose cross-peaks split are denoted with green diamonds, and residues whose cross-peaks are broadened and have decreased intensity are denoted with blue squares. These residues have been mapped on the wt apo-HasAp structure (PDB entry 3MOK) using the same color code; purple denotes residues with no assignment, and cyan identifies prolines. Δδweighed = {[(ΔδN/5)2 + (ΔδH)2]/2}1/2.

