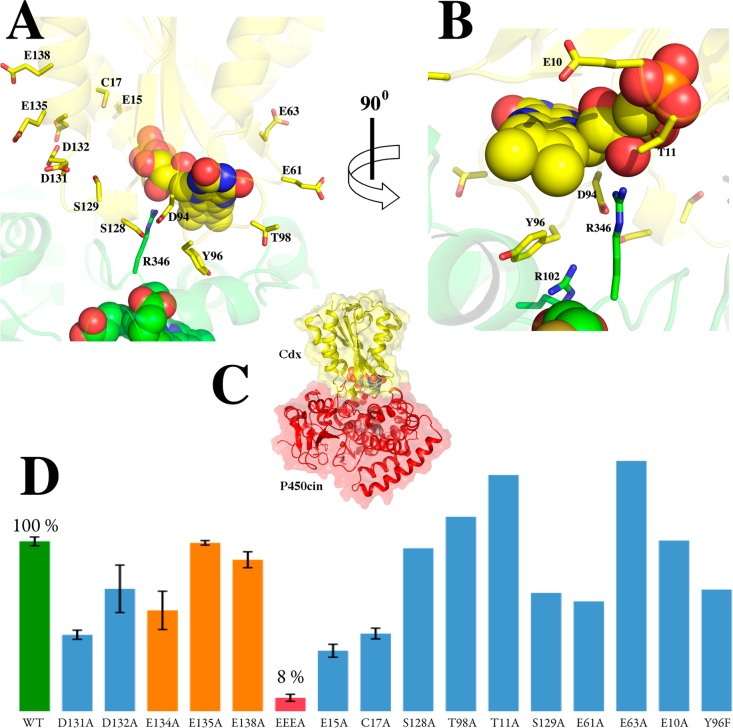
Figure 3.
Brownian dynamics- and molecular dynamics-generated model of the P450cin (green)–Cdx (yellow) complex. The structure depicted is the final configuration from the 300 ps MD simulation. Panels A and B show the interface in two different orientations, while panel C shows the overall structure. (D) Enzyme activity of various mutants.

