Abstract
Staphylococcus aureus FemA mutant grown in the presence of an alanine-racemase inhibitor was labeled with d-[1-13C]alanine, l-[3-13C]alanine, [2-13C]glycine, and l-[5-19F]lysine to characterize some details of the peptidoglycan tertiary structure. Rotational-echo double-resonance (REDOR) NMR of isolated cell walls was used to measure internuclear distances between 13C-labeled alanines and 19F-labeled lysine incorporated in the peptidoglycan. The alanyl 13C labels were preselected for REDOR measurement by their proximity to the glycine label using 13C–13C spin diffusion. The observed 13C–13C and 13C–19F distances are consistent with a tightly packed, hybrid architecture containing both parallel and perpendicular stems in a repeating structural motif within the peptidoglycan.
Peptidoglycan is the major component of cell walls in bacteria. The chemical structure of peptidoglycan varies from one bacterium to another, but all peptidoglycan repeat units consist of a disaccharide of N-acetylglucosamine (NAG) and N-acetylmuramic acid (NAM), a peptide stem, and a cross-linking bridge connecting adjacent stems. In Staphylococcus aureus, the stem is a pentapeptide with the amino acid sequence, l-alanine-d-iso-glutamine-l-lysine-d-alanine-d-alanine, and the bridge is a pentaglycyl peptide.1 In the FemA mutant (UK17) of methicillin-resistant S. aureus (MRSA), the bridge is a single glycyl peptide.2 We have shown recently by rotational-echo double-resonance (REDOR) NMR spectroscopy that the peptidoglycan lattice of S. aureus with pentaglycyl bridges has a repeating structural motif with a local, tightly packed parallel-stem architecture.3 This sort of lattice is unlikely for FemA because the short bridge would result in parallel stems that were only 5 Å apart, less than half the separation of stems in wild-type S. aureus.3 Moreover, all the glycyl bridge methylene carbons would be less than about 5 Å from l-alanyl methyl carbons, which is inconsistent with measured distances (cf. below).
In this report, we describe the REDOR NMR analysis of FemA cell walls into which four specific labels were incorporated: d-[1-13C]alanine, l-[3-13C]alanine, [2-13C]glycine, and l-[5-19F]lysine. The three carbon labels have chemical-shift resolution. Distances from the 19F label to 13C labels preselected by carbon–carbon spin diffusion reveal that the peptidoglycan structural motif in the FemA cell wall is a hybrid of tightly packed parallel and perpendicular stems. In addition, we establish orientation of this structural motif relative to the membrane bilayer by stable-isotope pulse labeling of FemA whole cells, followed by liquid chromatography–mass spectrometric (LC–MS) detection of peptidoglycan digestion fragments. We connect the origin of the FemA peptidoglycan architecture to a template model of peptidoglycan lattice assembly4 which is consistent with high levels of cross-linking. We believe the mixed geometry of the FemA peptidoglycan lattice may be applicable to the cell-wall architecture of other short-bridged Gram-positive bacteria.
Materials and Methods
Growth and Labeling of FemA Whole Cells
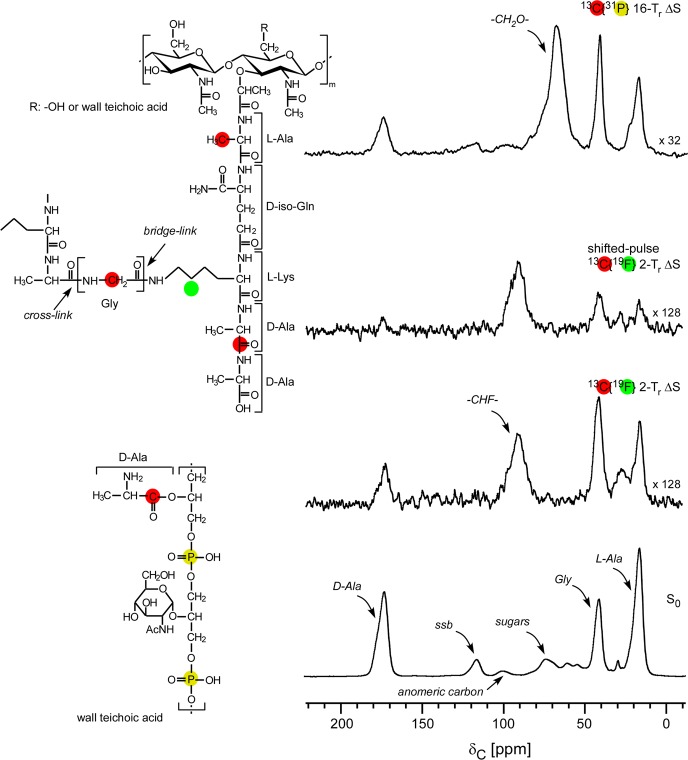
Starter culture of the FemA mutant of S. aureus (UK17), grown overnight in 5 mL of trypticase soy broth at 37 °C with shaking at 250 rpm in an Environ-Shaker (Lab-Lines Instruments, Inc., Melrose Park, IL) was added (1% final volume) to two 1-L flasks each containing 250 mL of sterile defined media.4 The medium was modified by replacement of the natural abundance amino acid l-alanine by a combination of l-[3-13C]alanine and d-[1-13C]alanine (each, 0.1 g/L), the natural abundance glycine by [2-13C]glycine, and the natural-abundance lysine by l-[5-19F]lysine. (The latter was prepared in a custom synthesis by Okeanos Technical Company, 103 Beiqing Road, Beijing, China, with labeled lysine purity confirmed by thin-layer chromatography and structure by mass spectrometry. Incorporation into cell walls was established directly by 13C{19F} REDOR NMR, as described below.) This combination resulted in specific 13C and 19F labels in the pentapeptide stems of the peptidoglycan of S. aureus (Figure 1). To prevent the scrambling of l-[3-13C]alanine and d-[1-13C]alanine through alanine racemase, alaphosphin (l-alanyl-l-1-aminoethylphosphonic acid), an alanine-racemase inhibitor, was added to a final concentration of 10 μg/mL in two steps.2
Figure 1.
C{F} and C{P} REDOR spectra of intact cell walls of the FemA mutant of S. aureus grown on media containing d-[1-13C]alanine, l-[3-13C]alanine, [2-13C]glycine, and l-[5-19F]lysine with the alanine racemase inhibitor, alaphosphin. The full-echo spectrum is at the bottom of the figure, and various REDOR differences are above. The shifted-pulse evolution time (second from top) was much less than two rotor periods. In this experiment, the separation of the two 19F π pulses was changed from the normal 140 μs (one rotor period) to 220 μs so that the effective recoupling time was only 30 μs per rotor period over the two rotor periods of REDOR dephasing. The inset shows the location of the labels (red, 13C; green, 19F) of peptidoglycan and (red, 13C; yellow, 31P) wall teichoic acid. All other carbons are at natural abundance. Spinning sidebands are designated by “ssb”.
The FemA whole cells were harvested after 6 h of growth by centrifugation at 8000g for 10 min at 4 °C in a Sorvall GS-3 rotor. The cells were washed twice in 50 mL of ice-cold 40 mM triethanolamine buffer, pH 7.0 and then resuspended in 10 mL of 40 mM triethanolamine buffer and lyophilized. Cell walls were isolated as described in detail previously.2
Dipolar Recoupling
REDOR is a solid-state NMR method that recouples heteronuclear dipolar interactions under magic-angle spinning5 and so can be used to determine internuclear distances. REDOR is a difference experiment in which two spectra are collected, one in the absence of heteronuclear dipolar coupling (full echo, S0 spectrum), and the other in the presence of the coupling (dephased echo, S spectrum). In the S0 spectrum, dipolar dephasing is refocused due to spatial averaging resulting from motion of the rotor in magic-angle spinning. In the S spectrum, the spin part of the dipolar interaction is manipulated by the application of rotor-synchronized dephasing π-pulses to prevent full refocusing. The extent of the dephasing is related to the spin-pair dipolar coupling and hence the internuclear separation.5
Solid-State NMR Spectrometer and REDOR Pulse Sequence
Experiments were performed at 12 T with a six-frequency transmission-line probe having a 12-mm long, 6-mm inner diameter analytical coil and a Chemagnetics/Varian ceramic spinning module. Samples were spun using a thin-wall Chemagnetics/Varian (Fort Collins, CO/Palo Alto, CA) 5-mm outer diameter-zirconia rotor at 7143 Hz, with the speed under active control and maintained to within ±2 Hz. A Tecmag Libra pulse programmer (Houston, TX) controlled the spectrometer. A 2-kW American Microwave Technology (AMT) power amplifier was used to produce radio frequency pulses for 13C (125 MHz) and a 1-kW AMT amplifier for 31P (202 MHz). The 1H (500 MHz) and 19F (470 MHz) radio frequency pulses were generated by a 2-kW Creative Electronics tube amplifiers driven by 50-W AMT amplifiers. All final-stage amplifiers were under active control.6 The π-pulse lengths were 9 μs for 13C and 1H, 6 μs for 31P, and 5 μs for 19F. Proton-carbon-matched cross-polarization transfers were made in 2 ms at 56 kHz. Proton dipolar decoupling was 100 kHz during data acquisition. The S and S0 alternate-scan strategy compensated for short-term drifts in REDOR experiments. Standard XY-8 phase cycling7 was used for all refocusing observe-channel π pulses (inserted at the end of each rotor period during dipolar evolution) and dephasing π pulses (inserted in the middle of each rotor period) to compensate for pulse imperfections. Frequency-specific 13C chemical shifts were selected prior to 13C{19F} REDOR experiments using rotor-asynchronous Dante irradiation, z-axis storage, and mixing times between 200 and 1200 ms with no 1H decoupling.8,9 Typically, spectra from 100-mg cell-wall samples were the result of the accumulation of 16 384 scans at room temperature.
Calculated REDOR Dephasing
REDOR dephasing was calculated using the modified Bessel function expressions given by Mueller et al.10 and de la Caillerie and Fretigny11 for a spin-1/2 pair. A plot of ΔS/S0 with respect to time (t = NTr), yields the dipolar coupling constant and hence the internuclear distance (rIS). The distance and spin-pair concentration (asymptotic dephasing maximum) were allowed to vary to minimize the root-mean-square deviation between the experimental and calculated dephasing.12
LC–MS
Cells grown in unlabeled SASM were digested into muropeptides with lysozyme and mutanolysin as previously described.13−15 Briefly, cells were incubated for 4 h at 37 °C with mutanolysin (1 μg/μL, from Streptomyces globisporus ATCC 21553, lyophilized powder, 5 KU, Sigma-Aldrich) and lysozyme (1 μg/μL, from chicken egg white, Sigma-Aldrich). The suspension was boiled for 5 min, and the supernatant was collected by centrifugation at 10000g for 5 min.
LC–MS and MS–MS were performed by using a PicoView PV-500 (New Objective, Woburn, MA) nanospray stage attached to either an LTQ-FT mass spectrometer or an LTQ-Orbitrap mass spectrometer (ThermoFisher, San Jose, CA).
Muropeptide samples were loaded into an uncoated 75-μm inner diameter fused-silica capillary column with a 15-μm picofrit tip (New Objectives, Woburn, MA), packed with C18 reverse-phase material (3 μm, 100 Å; Phenomenex, Torrance, CA) for 15 cm. The column was eluted at a flow rate of 250 nL/min for 10 min with 0.1% (v/v) formic acid in water and subsequently with a 60-min linear acetonitrile gradient (0–40%) with 0.1% formic acid. The samples, as they emerged from the column, were sprayed into a 209 LTQ-FT mass spectrometer. Full mass spectra were recorded in the FT component of the instrument at 100 000 resolving power (at m/z = 400).
Accurate mass product-ion spectra of muropeptides were acquired by introducing the samples by nanospray as they eluted from the LC to an LTQ-Orbitrap mass spectrometer. To obtain major-component product-ion spectra, cycles consisting of one full FT-scan mass spectrum and five ensuing data-dependent MS-MS scans acquired by the Orbitrap (with a normalized collision energy setting of 35%) were repeated continuously throughout the elution with the following dynamic exclusion settings: repeat count, 3; repeat duration, 15 s; exclusion duration, 30 s.
Results
Incorporation of l-[19F]Lysine in the Cell-Wall Peptidoglycan
The full-echo C{F} spectrum of isolated cell walls of FemA allows an unambiguous assignment of peaks arising from the three 13C labels (Figure 1, bottom, and insets). The 2-rotor-period REDOR difference shows qualitatively the proximity of the fluorine label to the three 13C labels (Figure 1, second from bottom). In addition, a major difference peak appears around 95 ppm, the chemical-shift range for fluorine-substituted sp3 carbons.16 This assignment is confirmed by the results of a shifted-pulse C{F} REDOR experiment,5 which shows diminution of the dephasing of the peaks due to the 13C labels but no diminution of the 95-ppm difference peak (Figure 1, second from top). The one-bond 12-kHz 13C–19F dipolar coupling is sufficient to produce full dephasing for dipolar evolution equal to only a fraction of a rotor period (see caption to Figure 1) with magic-angle spinning at 7143 Hz.17 The strong C–F coupling verifies that large-amplitude motions (and motional averaging of dipolar couplings) are absent for lyophilized peptidoglycan.
We estimated the extent of the incorporation of the 19F-labeled lysine by comparison of the integrated intensity of the −CHF– peak at 95 ppm (Figure 1, second from bottom) to that of the 13C-labeled glycyl peak at 42 ppm (Figure 1, bottom), a ratio of 2:1. These two peaks both arise from methylene carbons with similar echo-refocusing lifetimes. The glycyl carbon is 73% enriched,2 and the isotopic enrichment of the glycine in the media was 99%. This means that the 19F incorporation is {(2)(99)(0.73)}/{(128)(1.1)} = 1.0, taking into account the vertical scale factors of the two spectra (1:128) and the 1.1% natural abundance of 13C in the −CHF– unit. The full use by FemA of the fluoro-lysine during growth establishes that fluorine substitution at the 5-carbon position has no significant effect on −NH2 chemistry at the 6-carbon position.
Dante Frequency Selection
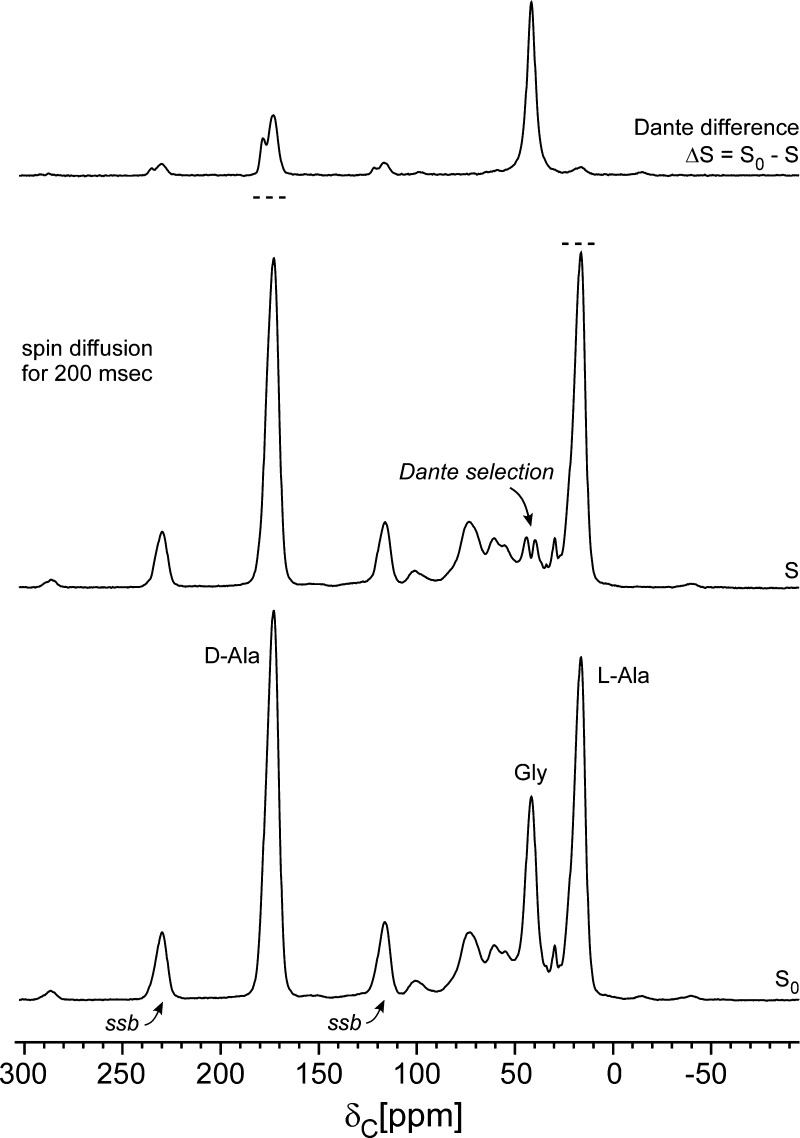
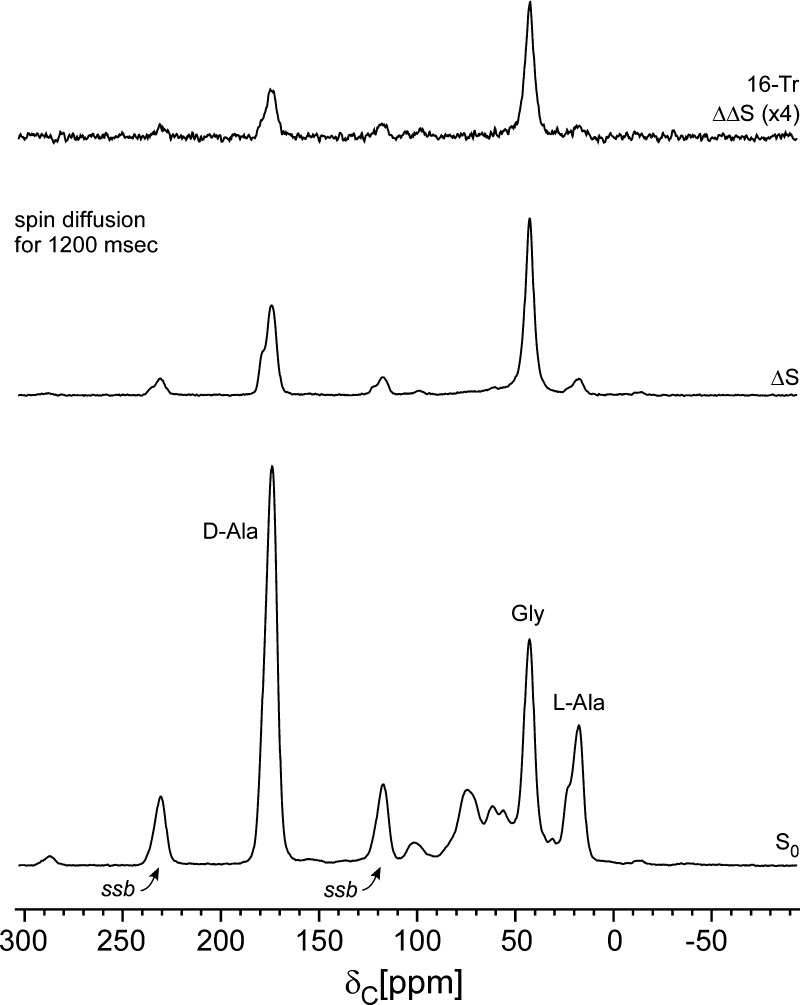
Significant improvement in resolution of the one-dimensional cell-wall spectrum is possible by utilization of one of 13C-labels as a filter. For example, Dante irradiation8,9 at the center of the 42-ppm glycyl peak, followed by magnetization storage along the z-axis static-field direction for 200 ms, results in the selectively inverted S-spectrum shown in Figure 2 (middle). About half of the glycyl-peak intensity has been inverted resulting in close to zero integrated intensity at 42 ppm. The Dante difference spectrum (Figure 2, top) is obtained by subtracting the S-spectrum from a full-echo S0 spectrum (Figure 2, bottom). For the latter, only the Dante irradiating radio frequency pulse amplitudes have been reduced to zero; both the Dante evolution period and the 200-ms mixing time are maintained.8,9
Figure 2.
Dante frequency selection for the cell-wall sample of Figure 1. A train of 1-μs 13C radio frequency pulses separated by 5 μs, with the carrier frequency centered at the glycyl-carbon resonance, and followed by z-axis storage for 200 ms, partially inverted the peak at 42 ppm (middle). The Dante difference spectrum (top) shows 13C–13C spin diffusion from the glycyl label to the d-alanyl label (175 and 178 ppm) and the l-alanyl label (15 ppm). The dotted lines above the peaks of the middle spectrum show their heights in the bottom spectrum. Spinning sidebands are designated by “ssb”.
The Dante frequency selection results in a carbonyl-carbon region (170–180 ppm) arising only from 13C’s that are strongly dipolar coupled to the glycyl 13C label. This selection removes contributions from the natural-abundance background and from 13C label in wall teichoic acid (see Figure 1, bottom inset). Two peaks are resolved in the carbonyl-carbon region, one arising from the peptide cross-link between the glycyl bridge nitrogen and the d-Ala-4 carbonyl label (see Figure 1, top inset) at 175 ppm,18 and the other arising from the terminal carboxyl carbon of d-Ala-5 of uncross-linked stems at 178 ppm.18 The total carbonyl-carbon region has an intensity that is about one-fourth that of the glycyl-carbon peak. Ignoring relaxation effects, this suggests equilibration of spin populations within the spin-up-spin-down half of all glycyl-d-alanyl 13C–13C pairs (1/2 times 1/2 = 1/4), the only pairs for which flip-flop transitions are energy conserving and therefore likely to occur. The observed ratio of intensities associated with cross-linked sites to un-cross-linked sites is about 2:1, which suggests 67% cross-linking, consistent with the previously measured level of cross-linking for FemA peptidoglycan of 62%.2
A minor Dante difference peak is observed at 15 ppm (Figure 2, top), indicating that a few methyl-carbon 13C labels of l-alanine are not far removed from the glycyl-carbon label.
Dante-Selected REDOR
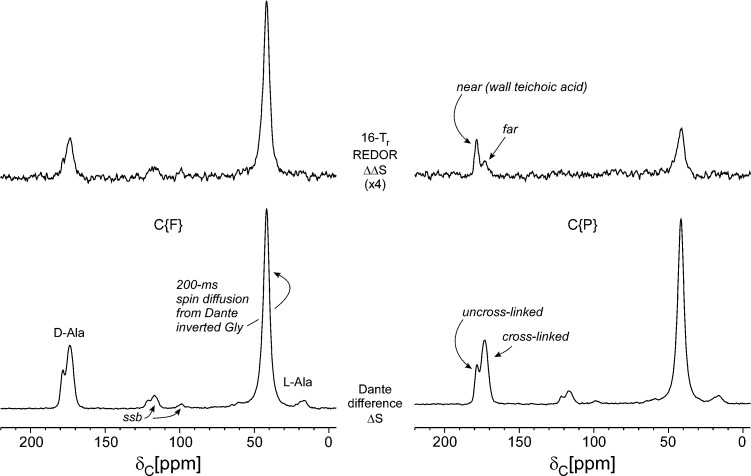
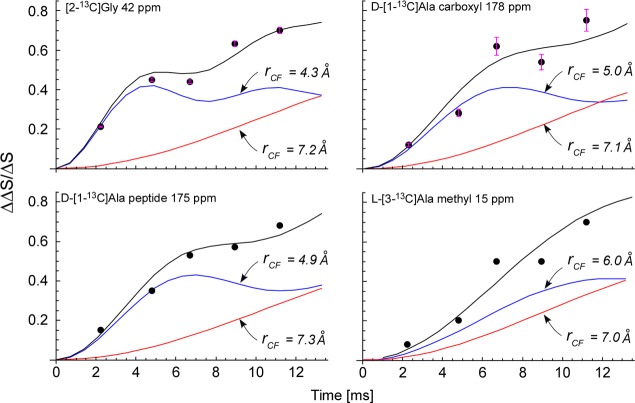
Dante selection was used as the front end of C{F} and C{P} REDOR experiments resulting in the spectra shown in Figure 3. The REDOR difference is now a ΔΔS double difference. REDOR C{F} dephasing (ΔΔS/ΔS) for the four carbon-label peaks (178, 175, 42, and 15 ppm) are plotted as a function of dipolar evolution in Figure 4. Distributions of CF distances between about 5 and 7 Å result in agreement between calculated and observed dephasing. Typical error bars (based on signal-to-noise ratios) are shown for two of the panels (Figure 4, top left and right). In general, the scatter of the observed dephasing about the calculated dephasing can be taken as an indication of the quality of the data.
Figure 3.
Dante-selected C{F} (left) and C{P} (right) REDOR of the cell-wall sample of Figure 1. The Dante differencing of Figure 2 preceded REDOR dephasing. Four data blocks were collected resulting in spectra with and without Dante irradiation, each with and without 19F (or 31P) dephasing. The Dante differences (ΔS) are shown at the bottom of the figure and are the reference spectra for REDOR dephasing (ΔΔS) shown above. The terminal carboxyl of the d-alanyl label (178 ppm) has a much larger C{P} REDOR difference than does the peptide d-alanyl label (175 ppm), indicating preferred proximity of un-cross-linked d-alanyl units to wall teichoic acid.
Figure 4.
Dante-selected C{F} REDOR dephasing (ΔΔS/ΔS) as a function of dipolar evolution time for the four resolved peaks of Figure 2 (top). The Dante selection was the glycyl 13C label at 42 ppm (Figure 2). The experimental dephasing (solid circles) is matched by the calculated dephasing (black line) which is a sum of two single-distance components (blue and red lines).
The high degree of dephasing (70% in about 10 ms) confirms the spin-count result of Figure 1 that all of the lysines in the stems are fluorine labeled.
The C{F} dephasing behavior does not change substantively when the Dante mixing time is increased from 200 to 1200 ms (Figure 5), although the Dante difference (ΔS) for the methyl-carbon peak at 15 ppm is increased. The latter indicates some glycyl label to l-alanyl label 13C–13C distances greater than 6 Å.19 This result rules out the all-parallel stem model for FemA (as mentioned in the introduction) in which all glycyl-bridge labels are within 5 Å of an l-alanyl methyl-carbon label.
Figure 5.
Dante-selected C{F} REDOR of the cell-wall sample of Figure 1. The Dante differencing of Figure 2 preceded REDOR dephasing but with a mixing time of 1200 ms. Even though the l-alanyl methyl-label peak at 15 ppm has a reduced S0 intensity relative to that in Figure 2 (bottom) because of a short T1(C), the ΔS/S0 for that peak has increased to approximately 15%.
The un-cross-linked d-alanine carboxyl carbons are relatively closer to the 31P of wall teichoic acid than are the cross-linked d-alanine peptide carbonyl carbons (Figure 3, right). However, none of the three peptidoglycan 13C labels is less than 5 Å to phosphorus, based on the standard C{P} REDOR results shown in Figure 1 (ΔS, top; S0, bottom), where the dominant dephasing belongs to the natural-abundance sugar carbons.
Pulse-Chase Labeling with LC–MS Detection
Time-dependent isotopic labeling of bacterial cells (Figure 6) quantified by LC-accurate-mass-MS13 was used to decide for FemA between the two major proposed models for peptidoglycan biosynthesis by either (i) strands20 or (ii) layers.21 In the strand model, growth is perpendicular to the surface of the membrane, while in the layer model each glycan backbone is extended parallel to the surface of the membrane. In growth by strands, cross-linking is made to neighboring growing strands (Figure 7, left); that is, new units are cross-linked only to new units. Thus, dimers and trimers of muramidase-digested peptidoglycan fragments with a mix of heavy and light lysine are only possible to the extent that the isotopic composition of the free lysine pool is mixed. However, for the dimers and trimers of Figure 8, mixtures of heavy and light lysines are observed after 2 h, when the isotopic composition of the free lysine pool has long been saturated. This timing is consistent with growth by layers (Figure 7, right) where newly synthesized (nascent) layers are cross-linked to previously synthesized (template) layers; that is, new units cross-link to old units. The generation of dimers and trimers with a mixture of heavy and light lysine is extensive in the peptidoglycan of FemA, and such layers persist until they migrate to the surface of the cell and are degraded by normal turnover.
Figure 6.
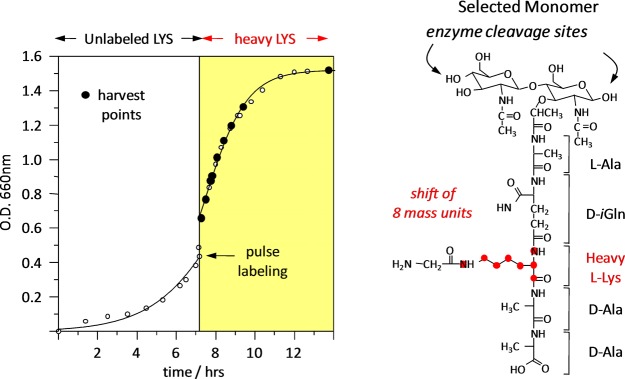
(Left) Time course of the pulse labeling of FemA whole cells with uniformly 13C,15N-lysine. After the switch to labeled lysine in the media, the cells doubled in about 2 h. (Right) Peptidoglycan digest fragment containing a single labeled lysine.
Figure 7.
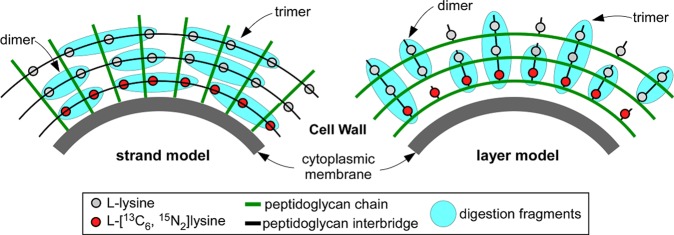
Muramidase digestion fragments (blue) of pulse labeling of FemA whole cells with l-[13C6,15N2]-lysine (red circles) for the strand model (left), and layer model (right) of peptidoglycan biosynthesis. The fragments with a mixture of heavy and light lysines are only observed in the layer model.
Figure 8.
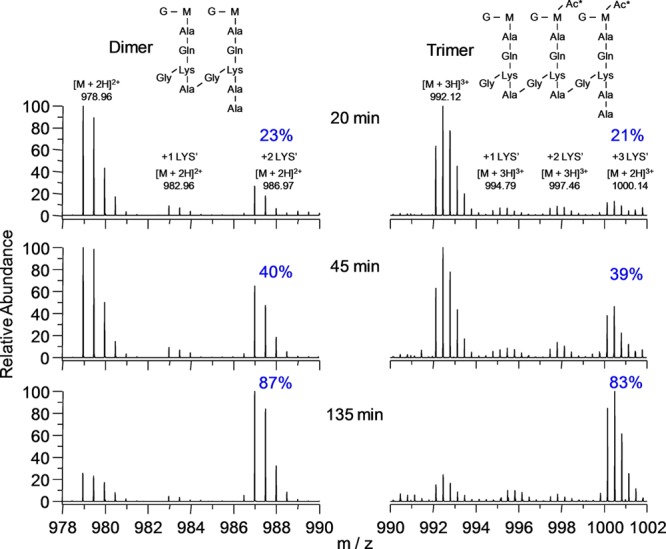
Accurate-mass spectra of dimers and trimers from digestion of the peptidoglycan of FemA cells grown in the pulse-labeling experiment of Figure 6. The dimers contain 0, 1, or 2 labeled lysines (increasing m/z, left to right), and the trimers, 0, 1, 2, or 3 labeled lysines (left to right), respectively. Each labeled lysine results in a m/z mass shift of 8/2 = 4 units for dimers, and 8/3 = 2.67 units for trimers.
Discussion
Homogeneous Lattice Models
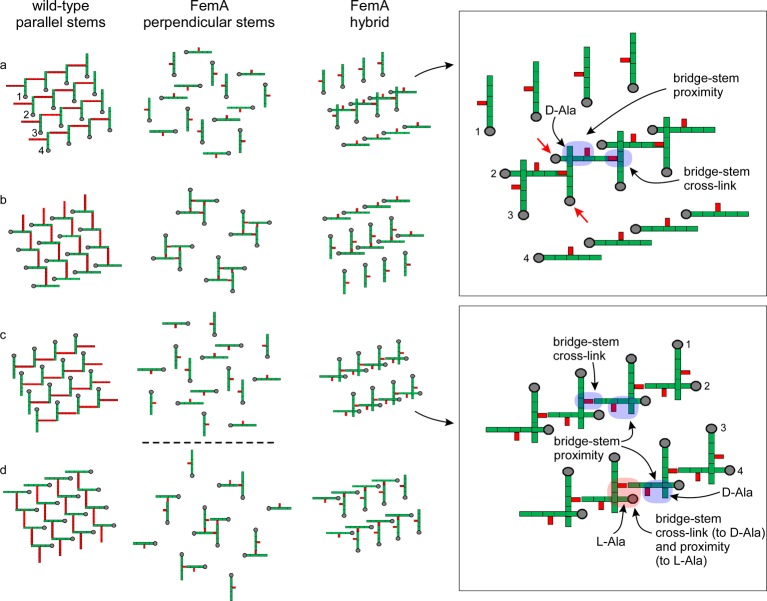
The lattice architecture proposed for wild-type S. aureus(3) is shown in Figure 9 (left). A 4 × 4 array of glycan chains perpendicular to the plane of the paper is in gray, with the peptide stems in green and the pentaglycyl bridges in red. All peptide stems are parallel. Panels 9a through 9d are slices transverse to the glycan chain direction and separated from one another by a single NAG-NAM repeat unit. This corresponds to a 90° clockwise rotation about each 4-fold-symmetric helical glycan-chain axis.22 Cross-linking of 100% is theoretically possible with each stem acting as both a bridge donor and acceptor.3 Cross-linking as high as 85% has been reported for the peptidoglycan of wild-type S. aureus.23
Figure 9.
Lattice models for the peptidoglycan of long-bridged wild-type S. aureus (left) and its short-bridged FemA mutant (middle and right). A 4 × 4 array of glycan chains perpendicular to the plane of the paper is in gray, with the peptide stems in green and the pentaglycyl bridges in red. Panels a through d for each model are slices transverse to the glycan chain direction and separated from one another by a single glycan repeat unit. The model on the left has all nearest-neighbor stems parallel; that in the middle, perpendicular; and that on the right, a mixed geometry. The expanded insets on the far right identify structural components (arrows and color highlights) for the mixed geometry of the FemA hybrid model. The two red arrows (inset, upper right) identify strands that are color highlighted in Figure 10. Alternate rows of the mixed-geometry model have stems that are perpendicular to one another. Thus, the stems of rows 1 and 3 are parallel, and those of rows 2 and 4 are parallel. Counts for the central four strands of the unit cells indicate that ideal cross-linking is 100% for the wild-type lattice (each stem is a cross-link donor and acceptor) and 50% for each of the two FemA models.
An all-parallel-stem lattice is impossible for FemA because the monoglycyl bridge is too short (see above). An alternative all-perpendicular-stem arrangement is shown in Figure 9 (middle). However, this scheme can also be excluded because (i) there are no bridge-to-l-alanyl proximities to account for the Dante differences of Figures 2, 3, and 5, and (ii) the cross-links would result exclusively in stem-bridge monomers and tetramers (Figure 9) after digestion, whereas dimers and trimers are abundant (Figure 8).
Hybrid Lattice Model
A possible mixed-geometry lattice for FemA which accounts for experimental results is shown in Figure 9 (right). Nearest-neighbor stems in adjacent rows are perpendicular differing by a 90° clockwise rotation, while all stems in the same row, and next-nearest-neighbor stems in alternate rows, are parallel. We anticipate that the differences in chemical shifts due to this mixed geometry are minor. Implementation of this geometry fits into the template model for peptidoglycan assembly.4 The chains of row 2 (Figure 9, top inset), for example, can be imagined as the template layer parallel to the S. aureus membrane surface (Figure 7, right). The chains of row 3 would then be nascent chains which are undergoing extension by transglycosylation synchronized with transpeptidase bridge-stem cross-linking. The entering glycan repeat unit would necessarily have its stem perpendicular to the template stem to form a cross-link. Other schemes for generating hybrid lattices are possible, but their prescriptions for covalent bond formation are more involved and so are not easily adapted to the uniformity of a simple template.14
The hybrid lattice has 50% cross-linking which can be increased (with minor conformational distortions, Figure 10) because of the numerous bridge-stem proximities. These additional cross-links account for the observed digestion trimers (Figure 8). In fact, every bridge has a d-alanyl near neighbor, consistent with the spin-diffusion proximities of Figure 2 (top). In addition, the bridge-l-alanyl proximities (Figure 9, blue highlight; Figure 10, left foreground) within 6 Å account for the observed spin diffusion from the glycyl label to the l-alanyl methyl-carbon label (Figure 5, ΔS).
Figure 10.
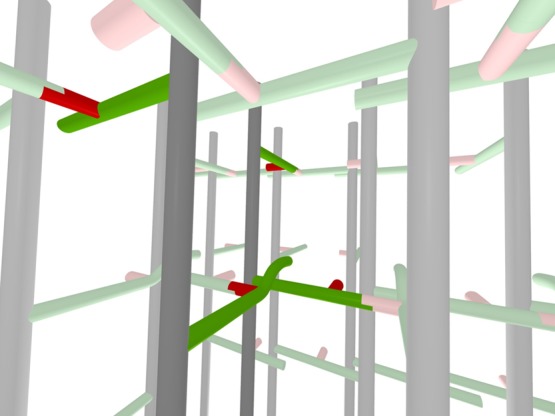
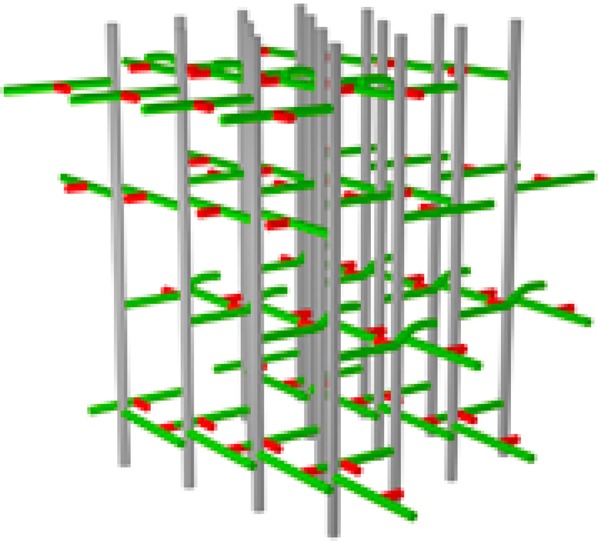
Three-dimensional representation of the hybrid model for the peptidoglycan lattice of FemA. Two of the glycan chains, peptide stems and glycyl side chains of the central units of the expanded inset (top) of Figure 9 (see red arrows) are highlighted by darker colors. The view is looking from row 3 to row 2 (see Figure 9 for numbering scheme). A cross-linked red glycyl unit is in the foreground (just left of and below the center) as well as an un-cross-linked red glycyl unit (to the right). The steric conflict of the two highlighted green stems in the foreground is represented by an upward curvature of one of the stems.
Peptidoglycan within the Cell Wall
A 3D representation of the hybrid architecture proposed for FemA peptidoglycan is shown in Figure 10. Two of the glycan chains of Figure 9 (top inset), along with their stems and bridges, have been highlighted. The view is looking from row 3 to row 2 (see Figure 9, top inset, red arrows). A cross-linked red glycyl unit is in the foreground as well as an uncross-linked red glycyl unit (to the right). The steric conflict of the two highlighted green stems in the foreground is represented by an upward curvature of one of the stems. Interunit proximities of glycyl (and lysyl) labels (red) with both l-alanyl (green, glycan junction) and d-alanyl (green, end of stem) labels are evident in the highlighted foreground of this view.
Because S. aureus glycan chain lengths are relatively short,24 there are frequent breaks. We interpret the compact lattice of Figure 10 as a structural motif that can be adapted to a variety of layers, turns, and vaults (3) thereby creating both hydrophobic and hydrophilic domains in the cell wall (Figure 11). This partitioning accounts for (i) the preferred contact of the 31P of hydrophilic wall teichoic acid with the uncross-linked surface stems of the FemA peptidoglycan structural motifs (Figure 3, right), and (ii) the location of the hydrophobic tails of cell-wall bound glycopeptide antibiotics near the interior bridges of the structural motifs.25
Figure 11.
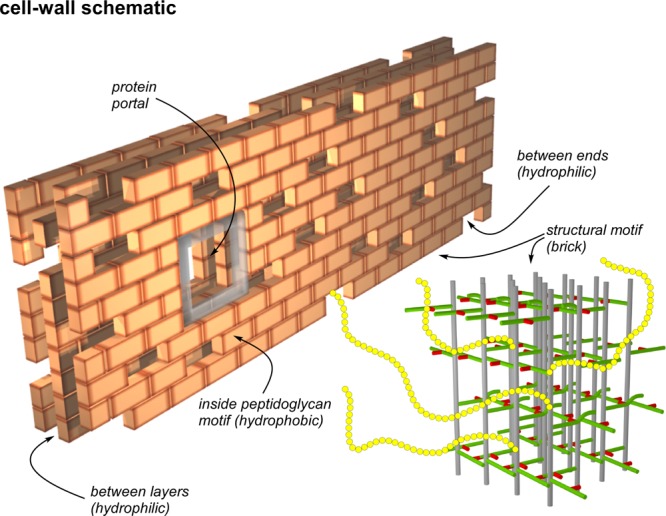
Schematic representation of the cell wall of the FemA mutant of S. aureus as a multilayered brick wall. Each brick is the peptidoglycan structural motif (bottom right) shown in expanded view in Figure 10. The interior of the structural motif is hydrophobic and the potential binding site of glycopeptide drugs with hydrophobic tails. Spaces and gaps are hydrophilic and accommodate wall teichoic acid (yellow chains). This arrangement brings the 31P of phosphate groups close to the surfaces of bricks, which are necessarily rich in un-cross-linked d-alanyl carboxyl groups, consistent with the results of Figure 3 (right). Bricks are placed around membrane-bound proteins creating portals to the cell surface. The membrane bilayer is envisioned parallel to the back surface of the wall which is built one layer at a time with the glycan chains of the structural motif parallel to the bilayer surface, consistent with the results of Figures 6–8.
We conclude that the incorporation of specific 13C and 19F labels within intact peptidoglycan followed by frequency-selected, one-dimensional, solid-state NMR detection has led to unambiguous insights into the complex structure of the short-bridged Gram-positive bacterial cell wall. Future experiments and molecular modeling can build on these quantitative results.
Glossary
Abbreviations
- 13C{19F} or C{F}
carbon-channel observation with fluorine dephasing
- 13C{31P} or C{P}
carbon-channel observation with phosphorus dephasing
- NAG
N-acetylglucosamine
- NAM
N-acetylmuramic acid
- REDOR
rotational-echo double resonance
The authors declare no competing financial interest.
This paper is based on work supported by the National Institutes of Health under Grant Number EB002058. The mass spectrometry was performed in the National Center for Research Resources (Grant Number 5P41RR000954, M. L. Gross, PI) at Washington University.
Funding Statement
National Institutes of Health, United States
References
- Rogers H. J., Ward J. B., and Perkins H. R. (1980) Microbial Cell Walls and Membranes, Chapman and Hall, New York. [Google Scholar]
- Sharif S.; Kim S. J.; Labischinski H.; Schaefer J. (2009) Characterization of peptidoglycan in fem-deletion mutants of methicillin-resistant Staphylococcus aureus by solid-state NMR. Biochemistry 48, 3100–3108. [DOI] [PMC free article] [PubMed] [Google Scholar]
- Kim S. J.; Singh M.; Preobrazhenskaya M.; Schaefer J. (2013) Staphylococcus aureus peptidoglycan stem packing by rotational-echo double resonance NMR spectroscopy. Biochemistry 52, 3651–3659. [DOI] [PMC free article] [PubMed] [Google Scholar]
- Kim S. J.; Matsuoka S.; Patti G. J.; Schaefer J. (2008) Vancomycin derivative with damaged d-Ala-d-Ala binding cleft binds to cross-linked peptidoglycan in the cell wall of Staphylococcus aureus. Biochemistry 47, 3822–3831. [DOI] [PMC free article] [PubMed] [Google Scholar]
- Gullion T.; Schaefer J. (1989) Rotational-echo double-resonance NMR. J. Magn. Reson. 81, 196–200. [DOI] [PubMed] [Google Scholar]
- Stueber D.; Mehta A. K.; Chen Z.; Wooley K. L.; Schaefer J. (2006) Local order in polycarbonate glasses by 13C{19F} Rotational-Echo Double-Resonance NMR. J. Polym. Sci., Part B: Polym. Phys. 44, 2760–2775. [Google Scholar]
- Gullion T.; Baker D. B.; Conradi M. S. (1990) New, compensated Carr-Purcell sequences. J. Magn. Reson. 89, 479–484. [Google Scholar]
- Bork V.; Schaefer J. (1988) Measuring 13C-13C connectivity in spinning solids by selective excitation. J. Magn. Reson. 78, 348–354. [Google Scholar]
- Cegelski L.; Schaefer J. (2005) Glycine metabolism in intact leaves by in vivo13C and 15N labeling. J. Biol. Chem. 280, 39238–39245. [DOI] [PubMed] [Google Scholar]
- Mueller K. T.; Jarvie T. P.; Aurentz D. J.; Roberts B. W. (1995) The REDOR transform: direct calculation of internuclear couplings from dipolar-dephasing NMR data. Chem. Phys. Lett. 242, 535–542. [Google Scholar]
- de la Caillerie J.-B. d. E.; Fretigny C. (1998) Analysis of the REDOR signal and inversion. J. Magn. Reson. 133, 273–280. [DOI] [PubMed] [Google Scholar]
- O’Connor R. D.; Schaefer J. (2002) Relative CSA-dipolar orientation from REDOR sidebands. J. Magn. Reson. 154, 46–52. [DOI] [PubMed] [Google Scholar]
- Patti G. J.; Chen J.; Gross M. L. (2009) Method revealing bacterial cell-wall architecture by time-dependent isotope labeling and quantitative liquid chromatography/mass spectrometry. Anal. Chem. 81, 2437–2445. [DOI] [PMC free article] [PubMed] [Google Scholar]
- Sharif S.; Kim S. J.; Labischinski H.; Chen J.; Schaefer J. (2013) Uniformity of glycyl bridge lengths in the mature cell walls of Fem mutants of methicillin-resistant Staphylococcus aureus. J. Bacteriol. 195, 1421–1427. [DOI] [PMC free article] [PubMed] [Google Scholar]
- Patti G. J.; Chen J.; Schaefer J.; Gross M. L. (2008) Characterization of structural variation in the peptidoglycan of vancomycin-susceptible Enterococcus faecium: understanding glycopeptide-antibiotic binding sites using mass spectrometry. J. Am. Soc. Mass Spectrom. 19, 1467–1475. [DOI] [PMC free article] [PubMed] [Google Scholar]
- Abraham R. J.; Edgar M.; Griffiths L.; Powell R. L. (1995) Substituent chemical shifts (SCS) in NMR. Part 5. Mono and di-fluoro SCS in rigid molecules. J. Chem. Perkin. Trans. 2, 561–567. [Google Scholar]
- Goetz J. M.; Wu J. H.; Yee A. F.; Schaefer J. (1998) Two-dimensional transferred-echo double resonance study of molecular motion in a fluorinated polycarbonate. Solid State Nucl. Magn. Reson. 12, 87–95. [DOI] [PubMed] [Google Scholar]
- Patti G. J.; Kim S. J.; Schaefer J. (2008) Characterization of the peptidoglycan of vancomycin-susceptible Enterococcus faecium. Biochemistry 47, 8378–8385. [DOI] [PMC free article] [PubMed] [Google Scholar]
- VanderHart D. L. (1987) Natural-abundance 13C-13C spin exchange in rigid crystalline organic solids. J. Magn. Reson. 72, 13–47. [Google Scholar]
- Dmitriev B. A.; Toukach F. V.; Schaper K. J.; Holst O.; Rietschel E. T.; Ehlers S. (2003) Tertiary structure of bacterial murein: the scaffold model. J. Bacteriol. 185, 3458–3468. [DOI] [PMC free article] [PubMed] [Google Scholar]
- Holtje J. V. (1998) Growth of the stress-bearing and shape-maintaining murein sacculus of Escherichia coli. Microbiol. Mol. Biol. Rev. 62, 181–203. [DOI] [PMC free article] [PubMed] [Google Scholar]
- Labischinski H.; Barnickel G.; Bradaczek H.; Giesbrecht P. (1979) On the secondary and tertiary structure of murein. Low and medium-angle X-ray evidence against chitin-based conformations of bacterial peptidoglycan. Eur. J. Biochem. 95, 147–155. [DOI] [PubMed] [Google Scholar]
- Cegelski L.; Kim S. J.; Hing A. W.; Studelska D. R.; O’Connor R. D.; Mehta A. K.; Schaefer J. (2002) Rotational-echo double resonance characterization of the effects of vancomycin on cell wall synthesis in Staphylococcus aureus. Biochemistry 41, 13053–13058. [DOI] [PubMed] [Google Scholar]
- Boneca I. G.; Huang Z. H.; Gage D. A.; Tomasz A. (2000) Characterization of Staphylococcus aureus cell wall glycan strands, evidence for a new beta-N-acetylglucosaminidase activity. J. Biol. Chem. 275, 9910–9918. [DOI] [PubMed] [Google Scholar]
- Kim S. J.; Tanaka K. S. E.; Dietrich E.; Far A. R.; Schaefer J. (2013) Locations of the hydrophobic side chains of lipoglycopeptides bound to the peptidoglycan of Staphylococcus aureus. Biochemistry 52, 3405–3414. [DOI] [PMC free article] [PubMed] [Google Scholar]


