

Abstract
The doubly labeled water (DLW) method is considered the reference method for the measurement of energy expenditure under free-living conditions. However, the reproducibility of the DLW method in longitudinal studies is not well documented. This study was designed to evaluate the longitudinal reproducibility of the DLW method using 2 protocols developed and implemented in a multicenter clinical trial—the Comprehensive Assessment of Long-term Effects of Reducing Intake of Energy (CALERIE). To document the longitudinal reproducibility of the DLW method, 2 protocols, 1 based on repeated analysis of dose dilutions over the course of the clinical trial (dose-dilution protocol) and 1 based on repeated but blinded analysis of randomly selected DLW studies (test-retest protocol), were carried out. The dose-dilution protocol showed that the theoretical fractional turnover rates for 2H and 18O and the difference between the 2 fractional turnover rates were reproducible to within 1% and 5%, respectively, over 4.5 y. The Bland-Altman pair-wise comparisons of the results generated from 50 test-retest DLW studies showed that the fractional turnover rates and isotope dilution spaces for 2H and 18O, and total energy expenditure, were highly reproducible over 2.4 y. Our results show that the DLW method is reproducible in longitudinal studies and confirm the validity of this method to measure energy expenditure, define energy intake prescriptions, and monitor adherence and body composition changes over the period of 2.5–4.4 y. The 2 protocols can be adopted by other laboratories to document the longitudinal reproducibility of their measurements to ensure the long-term outcomes of interest are meaningful biologically. This trial was registered at clinicaltrials.gov as NCT00427193.
Introduction
The doubly labeled water (DLW)8 method was originally developed and validated for measuring energy utilization in small mammals (1–9). Following the validation of the DLW method for measuring energy expenditure (EE) against indirect calorimetry in humans (10–16), the method quickly became the reference method for measuring habitual EE in humans, including premature infants (17, 18), newborns (19, 20), children (21), adolescents (22, 23), pregnant women (24, 25), lactating women (26, 27), and adults (28, 29), as well as individuals with various diseases (30–33). The DLW method is noninvasive and does not require blood sampling. The method also has minimal participant burden and can be used anywhere. Briefly, the DLW method is based on the principle that the disappearance rate of the heavier stable isotope of hydrogen (2H) reflects water turnover rate, whereas the disappearance rate of the heavier stable isotope of oxygen (18O) reflects both water and CO2 turnover rates. Therefore, with time, the difference between the disappearance rates of 2H and 18O represent the rate of CO2 production. Based on the energy equivalent of 1 L of CO2, the rate of CO2 production can be converted to EE (16, 34). The accuracy and precision of the DLW method rely on the accuracy and precision of the analytical instrumentation used to measure 2H and 18O. Currently, isotope ratio MS is considered the best analytical instrumentation for accurate and precise measurements of 2H and 18O content in physiologic samples collected for the DLW method (35–38). However, the long-term reproducibility of the DLW method, which is critical for longitudinal studies to monitor changes in EE, energy intake, and body composition, has not been documented.
The objective of this study was to evaluate the longitudinal reproducibility of the DLW method based on 2 protocols: 1 for the study dose dilutions and 1 for the test-retest reliability, which were developed and implemented in the National Institute on Aging’s multicenter clinical trial, the Comprehensive Assessment of Long-term Effects of Reducing Intake of Energy (CALERIE).
Participants and Methods
Study design
CALERIE was a multicenter, parallel-group, randomized controlled clinical trial conducted between 2005 and 2012 at the Jean Mayer USDA Human Nutrition Research Center on Aging at Tufts University, Washington University School of Medicine, and Pennington Biomedical Research Center. Duke Clinical Research Institute served as the coordinating center and the gas-isotope-ratio MS laboratory at Baylor College of Medicine’s USDA/Agricultural Research Service Children’s Nutrition Research Center served as the central DLW laboratory. The design and conduct of the clinical trial were published elsewhere (39). Study participants provided written informed consent. The institutional review board for human studies at each participating institution approved the study’s protocol.
Healthy adults were recruited for the 2-y clinical trial. Eligible participants were between 20 and 50 y of age (men) or between 20 and 47 y of age (women), either of normal body weight or slightly overweight (BMI of ≥22.0 and <28.0 kg·m−2), nonsmoking, nondiabetic, and not on any medications. Female participants had to use an acceptable form of contraception during the clinical trial. A total of 238 participants began the baseline evaluations, of which 218 were randomly assigned, with a 2:1 allocation to the caloric restriction (CR) and control groups, respectively, and were provided at least 1 follow-up evaluation (40). A total of 191 participants provided complete follow-up data.
DLW method
The DLW method was used to determine the habitual energy intake of each study participant. Two consecutive 14-d DLW protocols were conducted with each participant at baseline. The mean EE values from the 2 DLW studies were used to calculate the weight maintenance energy intake requirement at baseline and the 25% CR prescription for participants assigned to the CR intervention. For each subsequent time point in the study, which included 6, 12, 18, and 24 mo for CR participants, and 12 and 24 mo for control participants, a single 14-d DLW protocol was used.
For each DLW period, 2 baseline urine samples were collected. The participant was then administered by mouth a mixed cocktail containing 0.1 g of 2H2O at 99.98 atom percent 2H and 0.16 g of 100% 18O per kg of body weight. The DLW dose was designed to minimize potential errors introduced by the anticipated fluctuation in natural abundances of the 2 isotopes during the CR intervention, to reduce the effect of analytical errors on the precision of the DLW method, and to ensure there were sufficient isotopes at the end of each 14-d DLW study period for accurate and precise isotope ratio measurements (41–43). Six postdose urine samples were collected: 2 at 5–6 h postdose, 2 on day 7, and 2 on day 14. Study participants were instructed to void at home in the morning on days 7 and 14 before the postdose urine samples were collected in the clinic. The exact time of dosing and sample collection times were recorded.
Urine samples were transferred to 3 sets of o-ring cryovials. Encrypted ID labels, created and printed by the coordinating center, were affixed by site personnel to the cryovials in all follow-up DLW studies to ensure the DLW Laboratory was unaware of the treatment assignment and participant ID. One set of cryovials was shipped on dry ice to the DLW Laboratory for isotope ratio measurements.
For 2H assays, 10 μL of urine without further treatment was converted to H2 using the zinc reduction method (36, 37). The H2 was introduced via the automated sample inlet system directly into a Finnigan instrument for hydrogen isotope ratio measurement. For 18O assays, ISOPREP-18 H2O-CO2 equilibration chambers were used, in which 100 μL of urine was equilibrated with 300 mbar of CO2 of known 18O content for 10 h prior to admission to the ion source of a VG instrument for oxygen isotope ratio measurement (36). The isotope ratio measurements were expressed in delta (δ) per mil (parts per 1,000 or ‰) as follows:
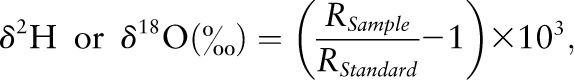 |
where RSample and RStandard were the 2H/1H or 18O/16O isotope ratios of the sample or the laboratory working standard, respectively. The isotopic ratios were then normalized against 2 international water standards: Vienna-Standard Mean Ocean Water and Standard Light Antarctic Precipitation (44). The precision (SD) for the 2H assay was 1.0‰ for samples with natural abundance of 2H and 1.8‰ for samples with enriched amounts of 2H (37). For 18O assays, the precision was 0.21‰ for samples with natural abundance of 18O and 0.97‰ for samples with enriched amounts of 18O (36).
The isotope dilution space of 2H (NH) and 18O (NO) were calculated as follows:
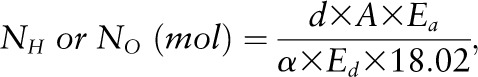 |
where d was the dose of 2H2O or H218O in grams, A was the amount of laboratory water in grams used in the dose dilution, α was the amount of 2H2O or H218O in grams added to the laboratory water in the dose dilution, Eα was the rise in δ2H or δ18O values in the laboratory water after the addition of the isotopic water, and Ed was the rise in δ2H or δ18O values in the urine samples at time zero obtained from the zero-time intercepts of the 2H and 18O decay curves in the urine samples. The use of dose dilution in the calculation of isotope dilution spaces was recommended by the International Dietary Energy Consultancy Groups to ensure accuracy of the isotope dilution calculations (45). Carbon dioxide production rate (VCO2) was calculated from the fractional turnover rate of 2H (kH) and 18O (kO) as follows (46):
 |
where rg was the fractionated water loss, which was calculated as 1.05 × (NO x kO − NH x kH). The VCO2 was converted to EE based on an energy equivalent of 1 L of CO2 to be 3.815/RQ + 1.2321 (16), where RQ was the respiratory quotient provisionally estimated to be 0.86 for all DLW measurements in this study (47).
Longitudinal reproducibility of the DLW method
To assess the longitudinal reproducibility of the DLW method, 2 protocols were developed and implemented in the CALERIE multicenter clinical trial.
Dose-dilution protocol.
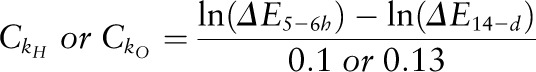
Two dose dilutions that spanned the range of isotopic enrichments anticipated at 5–6 h postdose (at ∼1:400 dilution) and at 14-d postdose (at ∼1:1500 dilution) were prepared from the DLW dose mixture used in the CALERIE clinical trial. Sufficient quantities of the 2 dose dilutions, along with the laboratory water that was used to prepare the dose dilutions, were stored in leak-proof containers at 5°C for the duration of the clinical trial. Initially, the 2 dose dilutions and the laboratory water were analyzed 10 times each for 2H and 18O content each day for 10 d. The mean values were used to generate the conversion constants to convert the monthly 2H and 18O measurements of the dose dilutions and the laboratory water into the theoretical fractional turnover rates of 0.1 for 2H and 0.13 for 18O. The conversion constants were calculated as follows:
 |
where  and
and  were the conversion constants for 2H and 18O, respectively; and ΔE5–6 h and ΔE14-d were the 2H and 18O content of the dose dilution above the isotopic content of the laboratory water anticipated at 5–6 h and at 14-d postdose, respectively. To monitor the reproducibility of the 2H and 18O measurements over the course of the clinical trial, monthly measurements of the 2 dose dilutions and the laboratory water were performed and the values were converted to kH and kO values using the respective conversion constant (
 or
or  The percentage difference of the kH, kO, and kO-kH values generated from the monthly measurements of the 2 dose dilutions and the laboratory water with respect to the theoretical values of 0.10, 0.13, and 0.03, respectively, was plotted against the date of analysis to monitor the long-term reproducibility of these measurements.
Test-retest protocol.
All DLW studies that were performed postrandomization from participants in both study arms were eligible for the test-retest protocol. Baseline studies were excluded because of the requirement to provide baseline total energy expenditure values quickly to the clinical sites so that the correct energy prescription could be determined. Sample size calculations (48) indicated that a sample of at least 46 duplicate DLW studies would be required to demonstrate that the intra-class correlation was >0.8 with a type-I error of α = 0.05 and type-II error of β = 0.2. Thus, 50 DLW studies, or ∼8% of postrandomization DLW studies, were included.
At periodic intervals in calendar time, DLW studies were selected for the study. The goal was to select them when ∼120 new postrandomization DLW studies had been performed since the previous calendar point. However, because of administrative issues, the samples were actually selected at 4 time points when 427, 84, 116, and 10 additional samples had accumulated. The first sampling was delayed to allow the DLW laboratory to focus on the baseline studies. Moreover, because more samples were found to be ineligible than expected, the sample rate was increased toward 15% by the end of the study to meet the required study size. Samples were selected from all new postrandomization DLW studies using simple random sampling by the statistician at the coordinating center. The selection was stratified by site but not by treatment assignment. DLW studies were not performed in the control group at months 6 and 18, so that stratifying by treatment group would have overrepresented studies at months 12 and 24. Because this might provide the DLW laboratory with knowledge of treatment groups, samples that did not conform to the standard 14-d protocol were discarded and replaced (similarly for those lacking sufficient urine volume). Selected retest samples were labeled with encrypted ID labels that looked identical to the regular sample ID labels. They were printed by the coordinating center and provided to the sites, thereby ensuring that the DLW laboratory was unaware of the group assignment, participant ID, and protocol time point so that only the sample collection sequence was identified. The clinical sites retrieved the duplicate urine sample sets from their freezers, affixed the blinded labels, and forwarded them to the DLW laboratory for analysis. When the mass spectrometric measurements were completed, the isotopic data were submitted to the coordinating center, and the study site then forwarded the study information to the DLW laboratory to generate the DLW outcome variables kH, kO, NH, NO, and EE.
Statistical methods
Descriptive statistics were used to calculate the mean, SD, and range of the participants’ physical characteristics, the percentage difference from the theoretic kH, kO and kO-kH values under the dose-dilution protocol, and the mean, mean difference, and the corresponding SD and range of the DLW outcome variables under the test-retest protocol. Independent samples t test and chi-square test were used to compare the continuous variables and categorical variables, respectively, between the retest participants and the nonretest participants. Paired samples t test was used to compare the test-retest outcome variables. The Bland-Altman pair-wise comparison (49, 50) was used to evaluate the reproducibility of the test-retest results. Statistical analyses were performed with SPSS software (SPSS).
Results
Longitudinal reproducibility of the DLW method
Dose-dilution protocol.
The longitudinal reproducibility of the DLW method based on the dose-dilution protocol is summarized in Figure 1. Fig. 1A illustrates the reproducibility of the kH values over a period of 4.4 y and, as shown, the kH values generated from the dose-dilution measurements over 4.4 y were within 1% of the theoretic value of 0.10 for kH, with a mean difference of 0.11 ± 0.25% (mean ± SD; range: −0.47–0.81%). Fig. 1B illustrates the reproducibility of the kO values over 4.4 y and, as shown, the kO values generated from the dose-dilution measurements were within 1% of the theoretic value of 0.13 for kO with a mean difference of 0.06 ± 0.35% (range: −0.76–0.76%). The reproducibility of the difference between kO and kH is summarized in Fig. 1C. As shown in the figure, the kO−kH values were reproducible within 5% of the theoretic value of 0.03 with a mean difference of −0.06 ± 0.19% (range: −3.63–4.12%).
FIGURE 1.

Reproducibility of the DLW method based on the dose-dilution data over 4.4 y (n = 79) in the caloric restriction clinical trial. Shown are the percentage difference of kH with respect to a theoretical value of 0.10 (A); percentage difference of kO with respect to a theoretical value of 0.13 (B); and percentage difference of kO−kH with respect to a theoretical value of 0.03 (C). The symbols within each panel represent the percentage difference for each monthly dose-dilution measurement. The solid line within each panel represents a mean difference of zero. The 2 dotted lines within each panel represent a 1% difference around zero (A and B), and a 5% difference around zero (C). DLW, doubly labeled water; kH, fractional turnover rate of 2H; kO, fractional turnover rate of 18O.
Test-retest protocol.
The demographic and baseline physical characteristics of the participants who were randomly selected under the test-retest protocol and the nonretest participants are summarized in Table 1. The follow-up DLW studies (n = 50) used in the test-retest protocol were obtained from 46 randomly selected participants, because 4 participants had 2 DLW studies that were carried out at different time points of the clinical trial. The demographic and baseline characteristics of the 46 participants selected for the test-retest protocol were not different from the 172 participants who were not selected for the test-retest protocol.
TABLE 1.
Demographic and baseline physical characteristics of participants in the CR clinical trial1
| Test-retest participants (n = 46) | Nonretest participants (n = 172) | P value | |
| Age, y | 39.7 ± 6.6 (22.9–50.6) | 37.5 ± 7.3 (20.7–50.8) | 0.06 |
| Sex, n (%) | 0.14 | ||
| Male | 18 (39.1) | 48 (27.9) | |
| Female | 28 (60.9) | 124 (72.1) | |
| Race, n (%) | 0.73 | ||
| White | 34 (73.9) | 134 (77.9) | |
| Nonwhite | 12 (26.1) | 38 (22.1) | |
| Ethnic group, n (%) | 0.68 | ||
| Hispanic or Latino | 2 (4.3) | 5 (2.9) | |
| Not Hispanic or Latino | 44 (95.7) | 165 (95.9) | |
| Unknown | 0 (0.0) | 2 (1.2) | |
| Weight, kg | 73.5 ± 9.5 (52.8–97.7) | 71.3 ± 9.1 (51.8–97.5) | 0.14 |
| Height, cm | 169.7 ± 9.0 (153.2–191.4) | 168.4 ± 8.4 (147.7–195.5) | 0.38 |
| BMI, kg/m2 | 25.5 ± 1.7 (22.0–28.5) | 25.1 ± 1.7 (21.3–29.0) | 0.14 |
| BMI status, n (%) | 0.70 | ||
| Normal weight | 21 (45.7) | 84 (48.8) | |
| Overweight | 25 (54.3) | 88 (51.2) |
Values are means ± SDs (ranges) or n (%). P values by independent samples t test for continuous variables and chi-square test for categorical variables. CR, caloric restriction.
Table 2 provides the descriptive statistics for the DLW outcome variables obtained from the 50 DLW studies randomly selected for the test-retest protocol. The original fractional turnover rates for 2H and 18O ranged from −0.176 to −0.058 d−1 and from −0.201 to −0.081 d−1, respectively. The original isotope dilution spaces for 2H and 18O also ranged from 27.7 to 49.7 kg and from 26.8 to 47.9 kg, respectively. With respect to EE, the original values ranged from 1561 to 3675 kcal·d−1. Therefore, the 50 DLW studies randomly selected for the test-retest protocol provided a wide range of these measurements to fully evaluate the longitudinal reproducibility of the DLW method. A paired-samples t test showed that the differences between the original tested and retested fractional turnover rates (kH and kO) were significant (P = 0.02). However, none of the differences between the original tested and retested values for NH, NO, and EE was found to be significant (P ≥ 0.3). The small differences observed between the original tested and retested values for kH and kO are considered physiologically irrelevant because no significant difference was observed among the major DLW outcomes (isotope dilution spaces and EE), which were derived from these fractional turnover rates.
TABLE 2.
DLW outcome variables calculated from samples collected from human studies randomly selected from the CR clinical trial under the test-retest protocol1
| Variables | Original | Retest | Difference |
| kH, d−1 | −0.098 ± 0.024 (−0.176 to −0.058) | −0.098 ± 0.024 (−0.178 to −0.058) | 0.000 ± 0.001 (−0.007–0.001) |
| kO, d−1 | −0.122 ± 0.025 (−0.201 to −0.081) | −0.122 ± 0.026 (−0.202 to −0.081) | 0.001 ± 0.002 (−0.011–0.001) |
| NH, kg | 35.7 ± 6.1 (27.7–49.7) | 35.8 ± 6.4 (27.7–51.8) | −0.1 ± 1.0 (−0.9–7.0) |
| NO, kg | 34.4 ± 5.9 (26.8–47.9) | 34.5 ± 6.1 (26.8–49.1) | −0.1 ± 0.9 (−1.2–5.9) |
| EE, kcal·d−1 | 2242 ± 407 (1561–3675) | 2247 ± 397 (1584–3622) | −5 ± 73 (−118–161) |
Values are means ± SDs (ranges), n = 50. CR, caloric restriction; DLW, doubly labeled water; EE, energy expenditure; kH, fractional turnover rate of 2H; kO, fractional turnover rate of 18O; NH, isotope dilution space of 2H; NO, isotope dilution space of 18O.
Figure 2 summarizes the Bland-Altman pair-wise comparisons between the retested DLW outcome variables and the original tested values. Fig. 2A shows that the retested kH values, when compared with the original values, had a bias of 0.0004 d−1 with a lower and upper limit of agreement between −0.002 and 0.003 d−1, respectively. With the exception of 1 data point, the rest of the differences were within the lower and upper limit of agreement. The comparison between the retested kO values and the original values showed a bias of 0.0005 d−1, with a lower and upper limit of agreement between −0.003 and 0.004 d−1, respectively (Fig. 2B). Again, with the exception of 1 data point, the rest of the differences all fall within the limit of agreement. When compared with the original values, the retested NH values (Fig. 2C) had a bias of −0.1 kg with a lower and upper limit of agreement between −2.1 and 2.0 kg, respectively. The individual differences again fall within the limit of agreement, with the exception of 1 data point. Similar results were obtained for the retested NO values (Fig. 2D), with a bias of −0.1 kg and a lower and upper limit of agreement between −1.8 and 1.7 kg, respectively. For the retested EE values (Fig. 2E), a bias of −5 kcal·d−1, with a lower and upper limit of agreement between −148 and 137 kcal·d−1, respectively, was obtained. With the exception of 1 data point, the other differences were all within the limit of agreement. Regression analyses indicated that the differences in kH and kO were inversely related to the mean kH and kO values (r2 ≤ 0.09, P ≤ 0.04). No relation was detected between the differences and the mean values among the comparisons of the NH (P = 0.07), NO (P = 0.17), and EE (P = 0.32) measurements.
FIGURE 2.

Reproducibility of the DLW method based on outcomes collected from 50 human studies randomly selected from the caloric restriction clinical trial for the test-retest protocol over 2.5 y (n = 50). Shown are the Bland-Altman pair-wise comparison between the retested kH values and the originally calculated kH values (A); Bland-Altman pair-wise comparison between the retested kO values and the originally calculated kO values (B); Bland-Altman pair-wise comparison between the retested NH values and the originally calculated NH values (C); Bland-Altman pair-wise comparison between the retested NO values and the originally calculated NO values (D); and Bland-Altman pair-wise comparison between the retested EE values and the originally calculated EE values (E). The solid line within each panel represents zero difference. The dotted line within each panel represents the bias or mean difference between the retest and original values. The 2 dashed lines within each panel represent the 95% CIs of the bias. The symbols within each panel represent the individual difference between the retest and the original values. DLW, doubly labeled water; EE, energy expenditure; kH, fractional turnover rate of 2H; kO, fractional turnover rate of 18O; NH, isotope dilution space of 2H; NO, isotope dilution space of 18O.
Among the 50 DLW studies chosen for the test-retest protocol, 2 studies were found to provide outcomes significantly different from the original values. Repeated MS analyses on the samples yielded the same outcomes. Despite these findings, the results presented in Fig. 2 show that all the biases between the repeated measurements and the original measurements were clustering around zero. Excluding these 2 studies from the comparisons yielded tighter limits of agreement (kH: −0.001–0.001 d−1; kO: −0.001–0.001 d−1; NH: −0.5–0.6 kg; NO: −0.4–0.5 kg; EE: −133–134 kcal·d−1) with biases closer to zero (kH: −0.0003 d−1; kO: 0.0003 d−1; NH: 0.03 kg; NO: 0.04 kg; EE: 0.6 kcal·d−1), as anticipated. The significant relation observed between the differences and the mean values for kH and kO also disappeared (kH: P = 0.64; kO: P = 0.99) after excluding these 2 studies from the comparisons.
Because the DLW studies were randomly selected for the test-retest protocol, the time elapsed since the original measurements varied between 12 d and 2.5 y, with 68% being repeated within 1 y and 32% being repeated between 1 and 2.5 y. An independent samples t test found no differences in the biases among the DLW outcome variables between measurements repeated within 1 y and those repeated after 1 y (P ≥ 0.1).
Applications of the DLW method in the CALERIE clinical trial
CR prescription.
In the CALERIE clinical trial, 2 consecutive 14-d DLW studies were carried out at baseline to determine the EE of each study participant and to establish the CR prescription for those randomly assigned to the CR intervention. Because these participants were healthy and were not taking part in any dietary or physical activity programs to lose weight, the mean EE measurements derived from these 2 consecutive DLW studies were assumed to equal their ad libitum energy intakes. The pre-intervention energy intakes of 10 participants, 5 males and 5 females, who were assigned to the CR intervention in the CALERIE clinical trial with best adherence are summarized in Table 3. The 25% CR prescriptions were calculated as 75% of ad libitum energy intake as determined by the DLW method.
TABLE 3.
Applications of the DLW method in the CALERIE clinical trial among study participants who were randomly assigned to the caloric restriction intervention1
| Nutrition applications | Mean values |
| CR prescription | |
| EIAL, kcal·d−1 | 2467 ± 443 (1883–3225) |
| Prescription, kcal·d−1 | 1803 ± 325 (1400–2346) |
| Adherence monitoring (baseline to 6 mo) | |
| Prescription, kcal·d−1 | 1803 ± 325 (1400–2346) |
| EIP, kcal·d−1 | 1696 ± 341 (1254–2393) |
| ΔES, kcal·d−1 | −363 ± 126 (−614 to −219) |
| EIAL, kcal·d−1 | 2467 ± 443 (1883–3225) |
| %CR, % | 31 ± 5 (25–38) |
| Body compositional changes (baseline to 6 mo) | |
| NO at baseline, kg | 36.2 ± 7.8 (26.1–48.0) |
| TBW at baseline, kg | 35.8 ± 7.7 (25.9–47.6) |
| FFM at baseline, kg | 49.1 ± 10.6 (35.4–65.2) |
| FM at baseline, kg | 26.5 ± 5.9 (19.0–34.4) |
| ΔNO, kg | −0.8 ± 1.1 (−2.5–0.8) |
| ΔFFM, kg | −1.0 ± 1.5 (−3.3–1.0) |
| ΔFM, kg | −8.6 ± 3.4 (−15.2 to −4.6) |
Values are means ± SDs (ranges), n = 10. CALERIE, Comprehensive Assessment of Long-term Effects of Reducing Intake of Energy; CR, caloric restriction; DLW, doubly labeled water; EIAL, ad libitum energy intake; EIp, energy intake over the period of interest; FM, fat mass; FFM, fat-free mass; NO, isotope dilution space of 18O; TBW, total body water; %CR, percentage of CR achieved; ΔES, change in body energy stores; ΔFM, change in FM; ΔFFM, change in FFM; ΔNO, change in the isotope dilution space of 18O.
Adherence monitoring.
Adherence measures were used to determine the degree of CR actually achieved. Adherence was characterized as the percentage of CR achieved and was calculated as follows:
 |
where EIP represents mean daily energy intake over the period of interest and EIAL represents the ad libitum daily energy intake before the start of the intervention. Ad libitum energy intake was characterized by the mean of 2 consecutive measures of EE performed at baseline using the DLW method. Based on the relation, EI = EE + ΔES, where EE was the mean daily energy expenditure during the period of interest and ΔES was the change in body energy stores during the period of interest. For intervals between 2 DLW measures, EE was computed as the mean of the EE estimates across the 2 time points. For intervals spanning more than 2 DLW measures, the mean of the estimates for each interval, weighted by the duration of the interval, was applied. ΔES was estimated by calculating the change in energy stores (measured by dual energy x-ray absorptiometry) from the beginning to the end of the interval. ΔES was calculated using standard coefficients for changes in fat mass (FM) (FM: 9300 kcal·kg−1) and fat-free mass (FFM) (FFM: 1100 kcal·kg−1). The EE, EIP, ΔES, and %CR for 10 participants who were assigned to the CR intervention over a 6-mo period are summarized in Table 3.
Body compositional changes.
Isotope dilution has been long considered one of the reference methods for the measurements of body composition. It has been well documented that FFM in healthy adults has a hydration of 73% (51). Knowing the NO from the DLW protocol, total body water (TBW) can be calculated using the equation TBW = NO/1.01 because the NO is assumed to overestimate TBW by 1% (51). Therefore, FFM can be calculated from TBW using the equation FFM = TBW/0.73. FM is simply the difference between body weight and FFM. The changes in body composition (body weight, FFM, FM) among 10 participants who were assigned to the CR group over a 6-mo period are summarized in Table 3.
Discussion
Our results represent the first study to document the longitudinal reproducibility of the DLW method.
The DLW method is considered the reference method for EE measurements under free-living conditions because it is noninvasive, nonrestrictive with minimal participant burden, and has no known adverse effects. The other advantage of the DLW method is that it can be implemented almost anywhere and the samples can be shipped back to the analytical laboratory. Because both 2H and 18O are nonradioactive stable isotopes, they do not decay or emit harmful radiation and therefore can be kept for a long time under proper conditions to support longitudinal studies. As shown in Fig. 1, the DLW method was highly reproducible over a period of 4.4 y. The results also demonstrated that the isotope ratio measurements by gas-isotope-ratio MS were highly reproducible. The longitudinal reproducibility of the DLW method was further supported by the results obtained from the blinded test-retest protocol (Fig. 2), showing that the results were highly reproducible up to 2.5 y.
One previous study examined the reliability of the DLW method in 5 participants (52). However, that study was not blinded and the DLW protocol was repeated on the same participants after a 3-d break. Therefore, although that study could be used to evaluate the reliability of the DLW method within participants, it could not be used to evaluate the longitudinal reproducibility of the DLW method.
Unfortunately, the DLW method is not widely used in cross-sectional or longitudinal studies because the method is expensive and requires specialized instrumentation such as isotope ratio MS to measure the stable isotopes. Therefore, other dietary assessment methods such as 24-h dietary recalls and FFQs often are employed in surveys and longitudinal studies. However, these less-expensive methods are known to have large measurement errors, particularly among children, different ethnic groups, and overweight or obese participants (53–56).
Because the reproducibility results were obtained using isotope ratio MS, the results might not be applicable to DLW studies carried out using other instrumentation such as cavity ring-down spectroscopy (57–60) or Fourier transform infrared spectroscopy (61, 62). The long-term reproducibility of the DLW method using these other instruments will need to be documented.
Our results demonstrate that the DLW outcome variables are highly reproducible longitudinally. Therefore, other laboratories can use these 2 protocols to document the long-term reproducibility of their measurements to ensure the biologic significance of the long-term outcomes of interest.
Acknowledgments
All authors were involved in the research design to evaluate the longitudinal reproducibility of the DLW method. S.B. Roberts and S.K.D. were the principal investigators at the Jean Mayer USDA Human Nutrition Research Center on Aging, Tufts University. S.B. Racette was the principal co-investigator at Washington University School of Medicine. L.M.R. was the principal coinvestigator at the Pennington Biomedical Research Center. J.R. and W.E.K. were the principal investigators at the Duke Clinical Research Institute, Duke University. M.V.B. was the study database manager at the coordinating center. W.W.W. was the principal investigator of the DLW Laboratory at the USDA/Agricultural Research Service Children’s Nutrition Research Center, Baylor College of Medicine. L.L.C. performed all the MS measurements in the DLW Laboratory. W.W.W. and M.V.B. performed the statistical analysis. W.W.W. wrote the initial draft of the manuscript and had primary responsibility for the final content. All authors read and approved the final manuscript.
Footnotes
Abbreviations used: CALERIE, Comprehensive Assessment of Long-term Effects of Reducing Intake of Energy; CR, caloric restriction; DLW, doubly labeled water; EE, energy expenditure; FM, fat mass; FFM, fat-free mass; kH, fractional turnover rate of 2H; kO, fractional turnover rate of 18O; NH, isotope dilution space of 2H; NO, isotope dilution space of 18O; TBW, total body water; VCO2, carbon dioxide production rate.
Literature Cited
- 1.Lee JS, Lifson N. Measurement of total energy and material balance in rats by means of doubly labeled water. Am J Physiol. 1960;199:238–42. [DOI] [PubMed] [Google Scholar]
- 2.Lifson N, Gordon GB, McClintock R. Measurement of total carbon dioxide production by means of D2O18. J Appl Physiol. 1955;7:704–10. [DOI] [PubMed] [Google Scholar]
- 3.Lifson N, Lee JS. Estimation of material balance of totally fasted rats by doubly labeled water. Am J Physiol. 1961;200:85–8. [DOI] [PubMed] [Google Scholar]
- 4.Lifson N, McClintock R. Theory of use of the turnover rates of body water for measuring energy and material balance. J Theor Biol. 1966;12:46–74. [DOI] [PubMed] [Google Scholar]
- 5.Little WS, Lifson N. Validation study of D218O method for determination of CO2 output of the eastern chipmunk (Tamais striatus). Comp Biochem Physiol Comp Physiol. 1975;50:55–6. [DOI] [PubMed] [Google Scholar]
- 6.McClintock R, Lifson N. CO2 output and energy balance of hereditary obese mice. Am J Physiol. 1957;189:463–9. [DOI] [PubMed] [Google Scholar]
- 7.McClintock R, Lifson N. Applicability of the D2O18 method to the measurement of the total carbon dioxide output of obese mice. J Biol Chem. 1957;226:153–6. [PubMed] [Google Scholar]
- 8.McClintock R, Lifson N. Determination of the total carbon dioxide outputs of rats by the D2O18 method. Am J Physiol. 1958;192:76–8. [DOI] [PubMed] [Google Scholar]
- 9.McClintock R, Lifson N. CO2 output of mice measured by D2O18 under conditions of isotope re-entry into the body. Am J Physiol. 1958;195:721–5. [DOI] [PubMed] [Google Scholar]
- 10.Klein PD, James WP, Wong WW, Irving CS, Murgatroyd PR, Cabrera M, Dallosso HM, Klein ER, Nichols BL. Calorimetric validation of the doubly-labelled water method for determination of energy expenditure in man. Hum Nutr Clin Nutr. 1984;38:95–106. [PubMed] [Google Scholar]
- 11.Schoeller DA, Webb P. Five-day comparison of the doubly labeled water method with respiratory gas exchange. Am J Clin Nutr. 1984;40:153–8. [DOI] [PubMed] [Google Scholar]
- 12.Seale JL, Conway JM, Canary JJ. Seven-day validation of doubly labeled water method using indirect room calorimetry. J Appl Physiol. 1993;74:402–9. [DOI] [PubMed] [Google Scholar]
- 13.Seale JL, Rumpler WV. Comparison of energy expenditure measurements by diet records, energy intake balance, doubly labeled water and room calorimetry. Eur J Clin Nutr. 1997;51:856–63. [DOI] [PubMed] [Google Scholar]
- 14.Seale JL, Rumpler WV, Conway JM, Miles CW. Comparison of doubly labeled water, intake-balance, and direct- and indirect-calorimetry methods for measuring energy expenditure in adult men. Am J Clin Nutr. 1990;52:66–71. [DOI] [PubMed] [Google Scholar]
- 15.Coward WA, Prentice AM, Murgatroyd PR, Davies HL, Cole TJ, Saylor KE, Glodberg GR, Halliday D, Macnamara JP. Measurement of CO2 and water production rates in man using 2H, 18O-labelled H2O: comparisons between calorimeter and isotope values. In: van Es AJ, editor. Clinical nutrition and metabolic research. Munich: Karger; 1984. p. 169–77. [Google Scholar]
- 16.Ravussin E, Harper IT, Rising R, Bogardus C. Energy expenditure by doubly labeled water: validation in lean and obese subjects. Am J Physiol. 1991;261:E402–9. [DOI] [PubMed] [Google Scholar]
- 17.Jensen CL, Butte NF, Wong WW, Moon JK. Determining energy expenditure in preterm infants: comparison of 2H218O method and indirect calorimetry. Am J Physiol. 1992;263:R685–92. [DOI] [PubMed] [Google Scholar]
- 18.Roberts SB, Coward WA, Schlossman SF, Schlingensseipen KH, Nohria V, Lucas A. Comparison of the doubly labeled water (2H2-18O) method with indirect calorimetry and a nutrient-balance study for simultaneous determination of energy expenditure, water intake, and metabolizable energy intake in preterm infants. Am J Clin Nutr. 1986;44:315–22. [DOI] [PubMed] [Google Scholar]
- 19.Roberts SB, Coward WA, Ewing G, Savage J, Cole TJ, Lucas A. Effect of weaning on accuracy of doubly labeled water method in infants. Am J Physiol. 1988;254:R622–7. [DOI] [PubMed] [Google Scholar]
- 20.Butte NF, Wong WW, Ferlic L, Smith EO, Klein PD, Garza C. Energy expenditure and deposition of breast-fed and formula-fed infants during early infancy. Pediatr Res. 1990;28:631–40. [DOI] [PubMed] [Google Scholar]
- 21.Treuth MS, Butte NF, Wong WW. Effects of familial predisposition to obesity on energy expenditure in multiethnic prepubertal girls. Am J Clin Nutr. 2000;71:893–900. [DOI] [PubMed] [Google Scholar]
- 22.Wong WW, Butte NF, Ellis KJ, Hergenroeder AC, Hill RB, Stuff JE, Smith EO. Pubertal African-American girls expended less energy at rest and during physical activity than Caucasian girls. J Clin Endocrinol Metab. 1999;84:906–11. [DOI] [PubMed] [Google Scholar]
- 23.Bandini LG, Schoeller DA, Dietz WH. Energy expenditure in obese and nonobese adolescents. Pediatr Res. 1990;27:198–203. [DOI] [PubMed] [Google Scholar]
- 24.Butte NF, Wong WW, Treuth MS, Ellis KJ, O'Brian SE. Energy requirements during pregnancy based on total energy expenditure and energy deposition. Am J Clin Nutr. 2004;79:1078–87. [DOI] [PubMed] [Google Scholar]
- 25.Kopp-Hoolihan LE, Van LMD, Wong WW, King JC. Longitudinal assessment of energy balance in well-nourished, pregnant women. Am J Clin Nutr. 1999;69:697–704. [DOI] [PubMed] [Google Scholar]
- 26.Villalpando SF, Butte NF, Wong WW, Flores-Huerta S, Hernandez-Beltran MJ, Smith EO, Garza C. Lactation performance of rural Mesoamerindians. Eur J Clin Nutr. 1992;46:337–48. [PubMed] [Google Scholar]
- 27.Barbosa L, Butte NF, Villalpando S, Wong WW, Smith EO. Maternal energy balance and lactation performance of Mesoamerindians as a function of body mass index. Am J Clin Nutr. 1997;66:575–83. [DOI] [PubMed] [Google Scholar]
- 28.Mâsse LC, Fulton JE, Watson KL, Mahar MT, Meyers MC, Wong WW. Influence of body composition on physical activity validation studies using doubly labeled water. J Appl Physiol. 2004;96:1357–64. [DOI] [PubMed] [Google Scholar]
- 29.Schulz LO, Schoeller DA. A compilation of total daily energy expenditures and body weights in healthy adults. Am J Clin Nutr. 1994;60:676–81. [DOI] [PubMed] [Google Scholar]
- 30.Schoeller DA, Levitsky LL, Bandini LG, Dietz WW, Walezak A. Energy expenditure and body composition in Prader-Willi syndrome. Metabolism. 1988;37:115–20. [DOI] [PubMed] [Google Scholar]
- 31.Casper RC, Schoeller DA, Kushner R, Hnilicka J, Gold ST. Total daily energy expenditure and activity level in anorexia nervosa. Am J Clin Nutr. 1991;53:1143–50. [DOI] [PubMed] [Google Scholar]
- 32.Motil KJ, Schultz RJ, Wong WW, Glaze DG. Increased energy expenditure associated with repetitive involuntary movement does not contribute to growth failure in girls with Rett syndrome. J Pediatr. 1998;132:228–33. [DOI] [PubMed] [Google Scholar]
- 33.Delikanaki-Skaribas E, Trail M, Wong WW, Lai EC. Daily energy expenditure, physical activity, and weight loss in Parkinson's disease patients. Mov Disord. 2009;24:667–71. [DOI] [PubMed] [Google Scholar]
- 34.Weir JB. New methods for calculating metabolic rate with special reference to protein metabolism. J Physiol. 1949;109:1–9. [DOI] [PMC free article] [PubMed] [Google Scholar]
- 35.Wong WW, Klein PD. A review of techniques for the preparation of biological samples for mass-spectrometric measurements of hydrogen-2/hydrogen-1 and oxygen-18/oxygen-16 isotope ratios. Mass Spectrom Rev. 1986;5:313–42. [Google Scholar]
- 36.Wong WW, Lee LS, Klein PD. Deuterium and oxygen-18 measurements on microliter samples of urine, plasma, saliva, and human milk. Am J Clin Nutr. 1987;45:905–13. [DOI] [PubMed] [Google Scholar]
- 37.Wong WW, Clarke LL, Llaurador M, Klein PD. A new zinc product for the reduction of water in physiological fluids to hydrogen gas for 2H/1H isotope ratio measurements. Eur J Clin Nutr. 1992;46:69–71. [PubMed] [Google Scholar]
- 38.Wong WW, Clarke LL. A hydrogen gas-water equilibration method produces accurate and precise stable hydrogen isotope ratio measurements in nutrition studies. J Nutr. 2012;142:2057–62. [DOI] [PMC free article] [PubMed] [Google Scholar]
- 39.Rochon J, Bales CW, Ravussin E, Redman LM, Holloszy JO, Racette SB, Roberts SB, Das SK, Romashkan S, Galan KM, et al. Design and conduct of the CALERIE study: comprehensive assessment of the long-term effects of reducing intake of energy. J Gerontol A Biol Sci Med Sci. 2011;66:97–108. [DOI] [PMC free article] [PubMed] [Google Scholar]
- 40.Stewart TM, Bhapkar M, Das S, Galan K, Martin CK, McAdams L, Piepeer C, Redman L, Roberts S, Stein RI, et al. Comprehensive Assessment of Long-term Effects of Reducing Intake of Energy Phase 2 (CALERIE Phase 2) screening and recruitment: methods and results. Contemp Clin Trials. 2013;34:10–20. [DOI] [PMC free article] [PubMed] [Google Scholar]
- 41.Schoeller DA. Energy expenditure from doubly labeled water: some fundamental considerations in humans. Am J Clin Nutr. 1983;38:999–1005. [DOI] [PubMed] [Google Scholar]
- 42.Horvitz MA, Schoeller DA. Natural abundance deuterium and 18-oxygen effects on the precision of the doubly labeled water method. Am J Physiol Endocrinol Metab. 2001;280:E965–72. [DOI] [PubMed] [Google Scholar]
- 43.Trabulsi J, Troiano RP, Subar AF, Sharbaugh C, Kipnis V, Schatzkin A, Schoeller DA. Precision of the doubly labeled water method in a large-scale application: evaluation of a streamlined-dosing protocol in the Observing Protein and Energy Nutrition (OPEN) study. Eur J Clin Nutr. 2003;57:1370–7. [DOI] [PubMed] [Google Scholar]
- 44.Gonfintini R. Standards for stable isotope measurements in natural compounds. Nature. 1978;271:534–6. [Google Scholar]
- 45.Prentice AM, editor. The doubly-labelled water method for measuring energy expenditure—technical recommendations for use in humans. Vienna, Austria: International Atomic Energy Agency; 1990. [Google Scholar]
- 46.Schoeller DA. Measurement of energy expenditure in free-living humans by using doubly labeled water. J Nutr. 1988;118:1278–89. [DOI] [PubMed] [Google Scholar]
- 47.Black AE, Prentice AM, Coward WA. Use of food quotients to predict respiratory quotients for the doubly-labelled water method of measuring energy expenditure. Hum Nutr Clin Nutr. 1986;40:381–91. [PubMed] [Google Scholar]
- 48.Donner A, Eliasziw M. Sample size requirements for reliability studies. Stat Med. 1987;6:441–8. [DOI] [PubMed] [Google Scholar]
- 49.Altman DG, Bland JM. Measurement in medicine: the analysis of method comparison studies. Statistician. 1983;32:307–17. [Google Scholar]
- 50.Bland JM, Altman DG. Statistical methods for assessing agreement between two methods of clinical measurement. Lancet. 1986;1:307–10. [PubMed] [Google Scholar]
- 51.Wang Z, Deurenberg P, Wang W, Pietrobelli A, Baumgartner RN, Heymsfield SB. Hydration of fat-free body mass: review and critique of a classic body-composition constant. Am J Clin Nutr. 1999;69:833–41. [DOI] [PubMed] [Google Scholar]
- 52.Goran MI, Poehlman ET, Danforth E., Jr Experimental reliability of the doubly labeled water technique. Am J Physiol. 1994;266:E510–5. [DOI] [PubMed] [Google Scholar]
- 53.Schoeller DA, Bandini LG, Dietz WH. Inaccuracies in self-reported intake identified by comparison with the doubly labelled water method. Can J Physiol Pharmacol. 1990;68:941–9. [DOI] [PubMed] [Google Scholar]
- 54.Schoeller DA, Thomas D, Archer E, Heymsfield SB, Blair SN, Goran MI, Hill JO, Atkinson RL, Corkey BE, Foreyt J, et al. Self-report-based estimates of energy intake offer an inadequate basis for scientific conclusions. Am J Clin Nutr. 2013;97:1413–5. [DOI] [PMC free article] [PubMed] [Google Scholar]
- 55.Bandini LG, Schoeller DA, Cyr HN, Dietz WH. Validity of reported energy intake in obese and nonobese adolescents. Am J Clin Nutr. 1990;52:421–5. [DOI] [PubMed] [Google Scholar]
- 56.Bandini LG, Must A, Cyr H, Anderson SE, Spadano JL, Dietz WH. Longitudinal changes in the accuracy of reported energy intake in girls 10–15 y of age. Am J Clin Nutr. 2003;78:480–4. [DOI] [PubMed] [Google Scholar]
- 57.Meier C, Knoche M, Merz R, Weise SM. Stable isotopes in river waters in the Tajik Pamirs: regional and temporal characteristics. Isotopes Environ Health Stud. 2013;49:542–54. [DOI] [PubMed] [Google Scholar]
- 58.Tremoy G, Vimeux F, Cattani O, Mayaki S, Souley I, Favreau G. Measurements of water vapor isotope ratios with wavelength-scanned cavity ring-down spectroscopy technology: new insights and important caveats for deuterium excess measurements in tropical areas in comparison with isotope-ratio mass spectrometry. Rapid Commun Mass Spectrom. 2011;25:3469–80. [DOI] [PubMed] [Google Scholar]
- 59.Brand WA, Geilmann H, Crosson ER, Rella CW. Cavity ring-down spectroscopy versus high-temperature conversion isotope ratio mass spectrometry; a case study on delta(2)H and delta(18)O of pure water samples and alcohol/water mixtures. Rapid Commun Mass Spectrom. 2009;23:1879–84. [DOI] [PubMed] [Google Scholar]
- 60.Thorsen T, Shriver T, Racine N, Richman BA, Schoeller DA. Doubly labeled water analysis using cavity ring-down spectroscopy. Rapid Commun Mass Spectrom. 2011;25:3–8. [DOI] [PubMed] [Google Scholar]
- 61.Jennings G, Bluck L, Wright A, Elia M. The use of infrared spectrophotometry for measuring body water spaces. Clin Chem. 1999;45:1077–81. [PubMed] [Google Scholar]
- 62.Ferrier L, Robert P, Dumon H, Martin L, Nguyen P. Evaluation of body composition in dogs by isotopic dilution using a low-cost technique, Fourier-transform infrared spectroscopy. J Nutr. 2002;132:1725S–7S. [DOI] [PubMed] [Google Scholar]