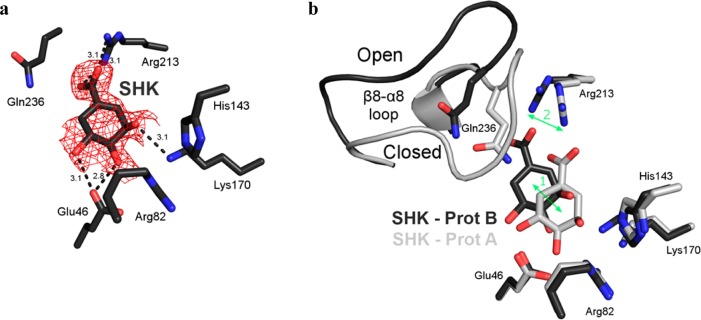
Figure 4.
Protomer B of the shikimate complex. (a) Stick model of the protomer B active site of the quinate complex. The Fo – Fc electron density map was calculated and contoured as described in the legend of Figure 3. (b) Superposition of protomers A (light gray) and B (dark gray) of the shikimate complex. The difference in shikimate position (arrow 1) tracks with the conformational change of Arg213 (arrow 2).

