Abstract
Magnetic resonance imaging (MRI) is a noninvasive technique which can acquire important quantitative and anatomical information from an individual in any plane or volume at comparatively high resolution. Over the past several years, developments in scanner hardware and software have enabled the acquisition of fast MRI imaging, proving extremely useful in various clinical and research applications such as in brain mapping or functional MRI (fMRI), perfusion-weighted imaging (PWI), and diffusion-weighted imaging (DWI). These techniques have revolutionized the use of MRI in the clinics, providing great insight into physiologic mechanisms and pathologic conditions. Since these relatively new areas of MRI have relied on fast scanning techniques, they have only recently been widely introduced to clinical sites. As such, this review article is devoted to the technological aspects of these techniques, as well as their roles and limitations in neuroimaging applications.
Keywords: Diffusion-weighted imaging (DWI), perfusion-weighted imaging (PWI), functional MRI (fMRI)
Magnetic resonance imaging (MRI) has been established for over a decade as a superior research and clinical modality for anatomical imaging. With its high submillimeter spatial and subsecond temporal resolution and its ability to acquire images from virtually any plane or volume, it has enabled the detection and diagnosis of a broad range of pathological conditions.
In addition to T1- and T2-weighted contrast achieved by regular anatomical MRI, other unique contrast mechanisms such as diffusion-weighted imaging (DWI), perfusion-weighted imaging (PWI), and functional MRI (fMRI) have revolutionized detection of pathologic conditions, such as in stroke, inflammatory processes, psychiatric disorders, and many more. These techniques have demonstrated great promise in tracing the links between tissue microstructure, metabolism, and hemodynamics. They have thus furthered our understanding of the pathophysiology of various disease processes and how best to detect these abnormalities. In this article, we will review the foundations of fMRI, DWI, and PWI techniques and address potential strengths and weaknesses of these techniques.
FUNCTIONAL MRI
Functional magnetic resonance imaging (fMRI) is an exciting modern development in MRI. It provides us with noninvasive images of neural activity during specific task activation1–3 to evaluate neurological status and neurosurgical risk. Functional MRI is now in use for the localization of visual, motor, and somatosensory responses in surgery of tumors, localization of “handedness,” and elucidation of brain function and metabolism altered by pathologies such as stroke, multiple sclerosis, schizophrenia, and the like. Moreover, neuroscientists rely heavily on fMRI to elucidate complex processes in the brain that are associated with behavior, reading and language skills, fear, and pain.
Functional MRI capitalizes on magnetic differences between oxygenated and deoxygenated blood during neuronal activation and rest. A stimulus (i.e., visual, vibration, motor activity) causes neuronal activity that increases the cerebral blood flow (CBF), cerebral blood volume (CBV), and hence oxygen delivery. Blood flow increases to a greater extent than necessary simply to provide oxygen and glucose for the increased energy production, resulting in a local reduction in deoxygenated blood. While oxygenated blood (or oxyhemoglobin, HbO2) is isomagnetic, deoxygenated blood (or deoxyhemoglobin, Hb) is slightly paramagnetic relative to brain tissue, and thus slightly distorts the magnetic field in its vicinity. These microscopic field inhomogeneities associated with the presence of deoxyhemoglobin lead to the shortening of the T2* relaxation time within the tissue voxel and is also called static dephasing. Thus, variations in regional tissue oxygenation due to changes in oxygen uptake and altered blood supply caused by localized brain activity can thereby be mapped by T2*-weighted MRI. This naturally occurring contrast mechanism is called blood oxygenation level-dependent (BOLD) contrast.1 Although direct CBF measurements to determine brain activity have been suggested, the BOLD contrast mechanism is by far the most often used measure of brain activation, and allows for spatial resolution on the order of a few millimeters, with the temporal resolution as short as a few seconds. Although fMRI does not measure neuronal function directly—a factor which has been criticized in the past by neuroelectrophysiologists and others—it is nevertheless an acceptable and noninvasive surrogate metric to study brain activity. However, caution must certainly be exercised in interpreting fMRI data, as the BOLD effect is typically focused on the venous compartment which leads to a slight spatial misalignment with the site of neural activity and, as already mentioned, does not reflect electrical activity. Moreover, in many pathologic processes (e.g., tumors), CBV and CBF can be perturbed, and so the BOLD effect in these regions might present differently than in healthy regions despite otherwise normal underlying neuronal activity.
Functional MRI Data Acquisition
The most common imaging sequence used for fMRI is echo planar imaging (EPI) and is shown in Fig. 1. In EPI, imaging data are acquired by sampling during a train of rapid field gradient reversals following radiofrequency (RF) excitation of protons. This allows the formation of an image in less than 100 milliseconds and a total imaging time for whole-brain coverage as short as a few seconds. The type of contrast that is generated is determined by whether a spin echo or gradient echo preparation is used, as well as sequence parameters, such as echo time (TE), sequence repetition time (TR), and flip angle. For fMRI studies, gradient echo preparation is typically used since it confers a signal advantage over spin echo preparation. However, spin echoes offer a greater selective sensitivity to the capillarysized vessels and less distortion at the base of the brain.
Figure 1.
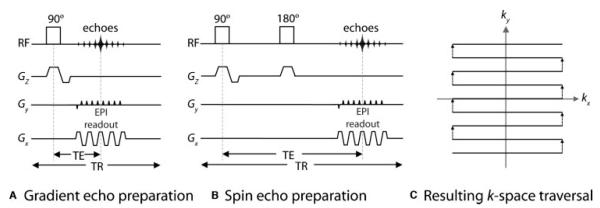
A typical echo planar pulse sequence timing diagram (EPI) from (A) a gradient echo and (B) a spin echo RF excitation. (C) Resulting imaging data, otherwise known as the EPI“ k-space trajectory.” The gradients in Gz are the slice-select gradients. In the readout direction (Gx), the gradients oscillate rapidly between positive and negative values, corresponding to moving in opposite directions along the kx-axis. A strong “blip” in Gy (the phase-encoding direction) moves the k-space trajectory from one line to the next. Thus the whole of k-space (corresponding to one complete image) is filled in one repetition (TR). TE is the echo time, determined by the distance from the middle of the 90-degree RF pulse to the center of the largest echo (i.e., the center of k-space). RF, radiofrequency.
In an fMRI experiment, a large series of images is acquired rapidly while the subject performs a task that shifts brain activity between two or more well-defined states. Do note that the spatial resolution used in fMRI is typically lower (typically 4×4×4 mm) than for a conventional MRI scan. Since the absolute MR signal differences are very small, appropriate task paradigms must be constructed, usually involving a “block on/off design” as illustrated in Fig. 2. The block design uses relatively long alternating periods (i.e., 30 seconds), whereby a certain cognitive state is maintained (i.e., finger tapping, followed by a rest period). A combination of the images from the states leads to an image that demonstrates contrast in areas where functional activation occurred. Generally, only two discrete states are maintained, alternating for several minutes to ensure that variations in patient physiology and scanner sensitivity are kept consistent. Typically, the observable BOLD response follows the stimulus presentation. This is explained best by the hemodynamic response function (HRF), which combines the stimulus presentation function with the BOLD time course by a mathematical convolution operation. Here the HRF is clearly a result of the metabolic and hemodynamic activity (as described above) in response to neuronal activity: that is, an initial slight surplus of deoxygenated blood followed by an overcompensation of inflowing oxygenated blood. Fig. 3 shows task activation maps acquired using a block design with left-hand finger tapping and movement of the tongue. Activation in the sensory and motor cortical regions is clearly delineated.
Figure 2.
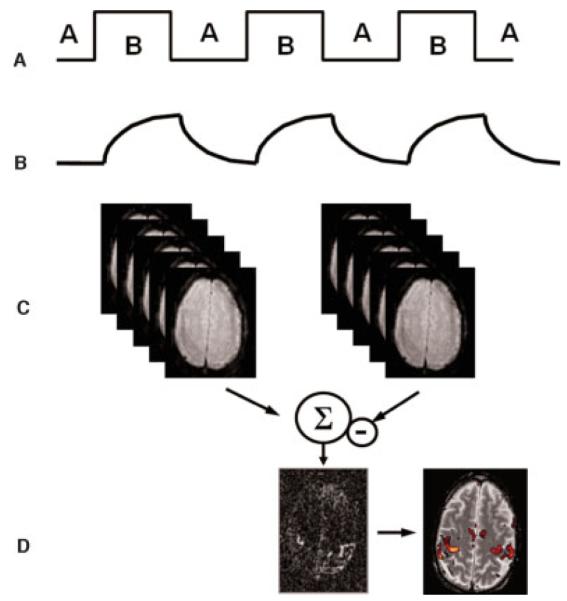
fMRI processing. (A) A usual fMRI experiment is conducted by alternating between two states (A, B); for example, stimulation on/off. (B) The tissue response follows the stimulation pattern determined by the hemodynamic response function. In the activated state B, the fMRI signal increases due to the prolonged T2* time. (C) A combination of the images from states A and B leads to (D) an image that demonstrates contrast in areas where functional activation occurred. For better localization, the activation results can be overlaid onto a morphologic reference image. This allows investigators to determine gray and white matter boundaries precisely as well as to delineate activated and nonactivated borders. fMRI, functional magnetic resonance imaging.
Figure 3.

fMRI performed at 1.5T. The stimulus is a block design with simultaneous left-hand finger tapping and movement of the tongue. (A) Activation in the sensory (S1) and motor (M1) cortical regions from the left-hand finger tapping. (B) Bilateral activation from the tongue movements. (C) Activation of the vermis, a brain structure involved in motor control (anatomically corresponding to the Broca’s area). fMRI, functional magnetic resonance imaging. (Images courtesy of Anders Nordell, Karolinska Institute, Stockholm, Sweden.)
Aside from a block-design approach, eventrelated designs can also be used. Here data are acquired while discrete stimuli or responses are repeated. Since the signal intensity is smaller in event-related fMRI, results from many trials must be averaged to give a measurable response.
Analysis of Functional MRI Data
Due to the small CBV, the BOLD signal changes are typically very small and close to the noise level. In practice, in healthy subjects the signal changes by only a few percent for activation in sensory regions, or an even smaller percent for cognitive tasks. Therefore, statistical processing methods are used to develop maps of activation from the time series of images generated during the scan. In such methods, either linear modeling or correlation algorithms are used to depict statistical parametric maps of the probability that a voxel’s activity is correctly related to the task and not to random chance. Many forms of such algorithms have evolved in attempts to eliminate both false positives (Type I errors, that is, suggesting brain activation when there isn’t one) and false negatives (Type II errors, that is, suggesting no brain activation when there is actually one). Often, Type II errors receive relatively little attention in studies using fMRI. In fMRI experiments, the experimenter chooses a tolerable probability for Type I errors, typically less than 5%, to allow adequate control of specificity. One approach to enhancing the sensitivity is to undertake studies of groups of individuals so that consistently activated regions may then be identified, even if the changes in signal intensity are small.
Analyses of fMRI data in a cohort of patients typically employ either the “fixed” or “mixed” effects model. A fixed model provides a sensitive measure of whether group data are activating on average, but does not look at subject-to-subject variability. A mixed model takes into account both the variance in a measurement for an individual and the variance between individuals, thus the signal changes observed are small. Other confounding effects in fMRI arise from motion, necessitating the use of image realignment algorithms. Despite this, the widespread use of several free packages available for image registration and data analysis (e.g., SPM [www.fil.ion.ucl.ac.uk/spm], FSL [www.fmrib.ox.ac.uk/fsl], and AFNI [http://afni.nimh.nih.gov/afni]) and commercial programs (e.g., BrainVoyager [http://www.brainvoyager.com]) has in many cases helped to reveal consistent localizations and high reproducibility. Many MRI scanner vendors have recently introduced postprocessing software for use on their scanners, which should increase the availability and convenience of fMRI for clinical applications. Some of these software packages and fMRI data acquisition methods can provide task activation maps in quasi real-time—which is very helpful as one can observe how activation begins to “stand out” above noise with an increasing number of block cycles while, for example, providing some activation-based feedback to the subject to steer certain tasks.
DIFFUSION-WEIGHTED IMAGING
Aside from T1 and T2 relaxation, proton diffusion sets the basis for another contrast mechanism in MRI2 that is frequently used in the diagnostic work-up of patients. That is, the grayscale pixel values on DWI are dependent on the underlying diffusivity in these voxels, where voxels with high diffusion appear hypointense (e.g., cerebrospinal fluid) and voxels with low diffusion appear hyperintense (e.g., acute stroke).
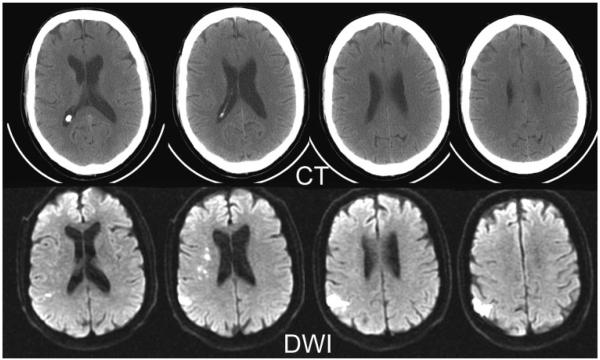
To date, DWI and more advanced methods such as diffusion tensor imaging (DTI)3,4 have advanced from an experimental tool to a method that can be found in the sequence portfolio of any major clinical MR manufacturer. In particular, DWI sequences have been shown in numerous studies to be exquisitely sensitive to early ischemic infarction (Fig. 4),5–7 allowing a more accurate reflection of early-onset pathophysiologic changes than do T2-weighted images. Diffusion images also allow one to differentiate cysts from abscesses, differentiate high-grade from low-grade tumors, help evaluate traumatic brain injury, hypoxic brain injury, and Creutzfeldt-Jakob disease, and detect earlier subtle white matter abnormalities occult to conventional imaging. In addition, DTI can evaluate the microscopic architecture of the brain, by measuring the degree and spatial distribution of anisotropic diffusion within the brain. DTI has been used to demonstrate subtle abnormalities in a variety of diseases (including stroke, multiple sclerosis, amyotrophic lateral sclerosis, dyslexia, and schizophrenia) and is currently becoming part of many routine clinical protocols. DTI may also play an important role in treatment planning of neurosurgery or dose sculpting in radiation therapy. In particular, the anisotropic behavior of diffusion in white matter can be utilized to investigate the orientation of white matter fibers, which cannot be done otherwise without applying invasive or destructive techniques.
Figure 4.
Acute ischemic stroke of a 73-year-old male patient. Top row: Approximately 1.5 to 2 hours after onset of clinical symptoms, conventional x-ray CT shows no clear signs of infarction. Bottom row: Series of DWIs obtained immediately after CT examination allows exact delineation of injured tissue. DWI examination was performed with a navigated diffusion-weighted multi-shot echo planar imaging sequence (b = 1000 second mm2). The CT scan took 5.6 seconds and the DWI took 45 seconds. DWI, diffusion-weighted image; CT, computed tomography.
In the following section a closer look at the biophysical background of diffusion will be provided.
Basic Concept of Diffusion
The thermally driven random motion of water molecules is known as Brownian motion.2 Due to the presence of cell membranes and other obstacles, the water molecules tend to be confined and hindered in their normal free diffusion. The degree of diffusion restriction allows us to interrogate cellular structures on the microscopic level and characterize different tissue types or pathological processes that tend to alter this biophysical property.
By means of DWI, it is possible to measure the apparent diffusion coefficient on a time scale of a few tens of milliseconds. If diffusion is isotropic, there is no preferred direction of water motion for these tissues. However, for white matter consisting of dense fiber bundles, water moves more easily parallel to the fibers than across them. Depending on the fiber packing density, the diffusion will be more or less anisotropic. Mathematically, anisotropic diffusion is characterized by the diffusion tensor. To get a better grasp of the diffusion tensor, so-called diffusion ellipsoids can be derived from the tensor. While diffusion ellipsoids appear spherical for isotropic diffusion, they appear rather cigar-shaped in the case of pronounced diffusion anisotropy. Here, the surface of the diffusion ellipsoid can be seen as the extent of proton displacement for a spin ensemble starting at the center of the voxel and diffusing for a given observation time. Visualization of both isotropic and anisotropic proton displacement fronts is shown in Fig. 5.
Figure 5.
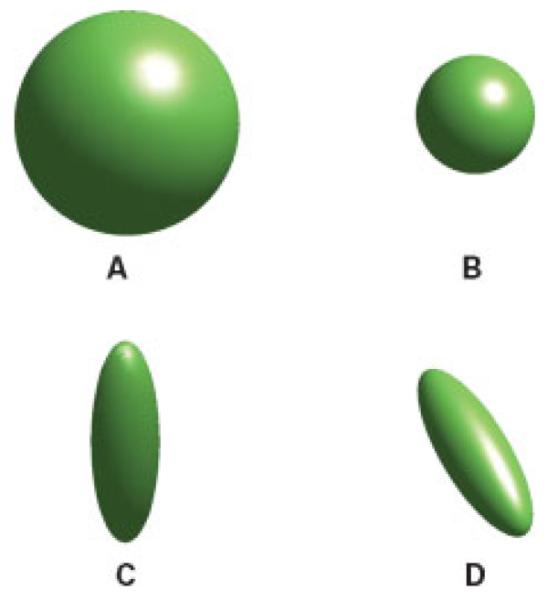
Visualization of proton displacement front due to diffusion. (A) Isotropic diffusion occurs if diffusion is equal along all directions. (B) For the same diffusion observation time interval the proton displacement front is smaller in the presence of reduced diffusion. (C,D) With the introduction of diffusion barriers, diffusion is anisotropic, and differs along different directions.
In Fig. 6, three diffusion-weighted images are presented, with the diffusion weighting applied in different directions. Looking in white matter areas, such as the genu or splenium of the corpus callosum, one can appreciate the signal difference due to anisotropic diffusion. If the white matter tracts are running parallel to the encoding gradient applied, white matter appears hypointense compared with the surrounding tissue, whereas they appear hyperintense when fibers run perpendicular to the encoding gradient. In the first case, this is due to a relatively high diffusion coefficient, while the second case is due to restricted or hindered diffusion occurring across multiple layers of oriented, mostly myelinated fibers. This anisotropic diffusion can be characterized further with the use of DTI. Diffusion tensor imaging is based on DWI scans with diffusion encoding along many different directions to compute the aforementioned diffusion tensor on a per pixel basis. Compared with DWI, this approach provides an even more quantitative view on tissue microstructure. An advanced application of DTI is that of tractography or fiber tracking in the brain. Here, fiber tracking algorithms are used to track a fiber along its whole length. Together with fMRI, fiber tracking could enhance the understanding of the spatiotemporal interaction of normal brain function and adaptive processes such as brain plasticity. The next section now answers the question about how one can make an MR imaging sequence sensitive to diffusion.
Figure 6.
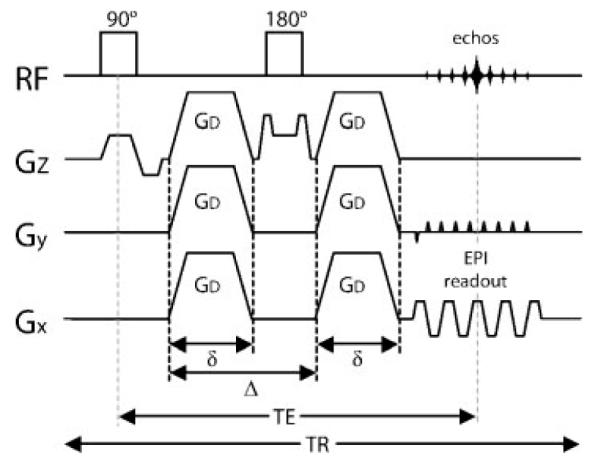
Single-shot diffusion-weighted spin echo EPI pulse sequence. Diffusion-weighting gradients of strength GD, duration δ, and spacing Δ are applied during each TE/2 period. The diffusion-weighted echo is sampled at the time t = TE when the spin echo is formed. The diffusion attenuation is dependent on the parameters GD, δ, and Δ. The entire k-space is filled with a single EPI-readout train. EPI, echo planar imaging; RF, radiofrequency, Gx, readout direction; Gy, phase-encode direction; Gz, slice select direction; TE, echo time; TR, repetition time.
Diffusion-Weighted Acquisitions
Diffusion-weighted images are routinely accomplished by applying strong pulsed “diffusion” gradients during the evolution of the MR signal. Typically, the diffusion-weighted signal is generated by a spin echo with diffusion gradients straddling the 180-degree refocusing pulse, after which the signal is read out with the more or less standardized EPI trajectory (Fig. 7). The reduction in signal can be related to the amount of diffusion that is occurring in the tissue and how much diffusion sensitivity the diffusion gradients add to the spin echo sequence. The amount of diffusion sensitivity is a function of the gradient-related parameters: strength, duration, and the period between diffusion gradients, and is represented by the b-value, i.e., b = (γGδ)2(Δ – δ/3). Using single-shot EPI, each image is acquired within the time frame of 0.1 second so that a typical isotropic DWI scan with encoding applied successively along all principal axes can be done on a stroke patient in less than 1 minute. Some of our neuroradiologists say that this minute spent on acquiring a DWI image is the time most wisely spent on a patient.
Figure 7.

DWIs with diffusion encoding along the (A) left-right, (B) anterior-posterior, and (C) craniocaudal direction. Notice that white matter fibers running perpendicular to the gradient direction appear to be hyperintense because of lower values of diffusivity, whereas fibers running in parallel to the gradient direction demonstrate lower signal intensities. The average of the three images produces the isotropic DWI shown on the right. DWI, diffusion-weighted image.
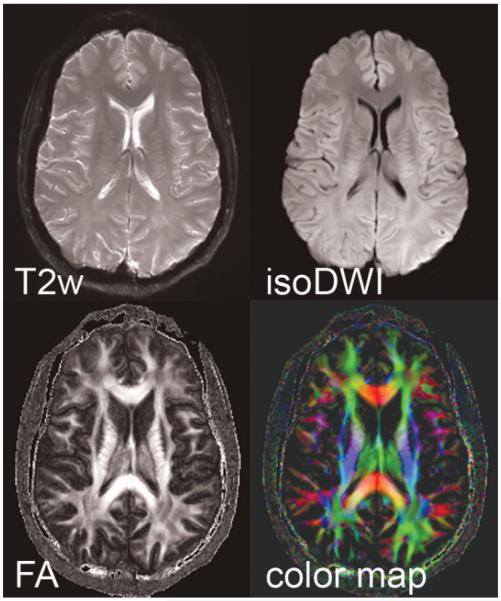
Until recently, single-shot EPI was used almost exclusively for DWI in the clinical routine. However, EPI suffers from some problems, including effects such as image distortion, blurring, and signal loss—particularly at tissue-air boundaries. With the recent introduction of parallel imaging, the quality of EPI scans has been significantly improved. The accelerated k-space traversal in parallel imaging results in reduced blurring and geometric distortions caused by off-resonant spins (Fig. 8). As the magnitude of distortions scales linearly with field strength, at higher field strengths (such as 3T) parallel imaging has become extremely useful for improving the overall image quality of EPI-based DTI (Fig. 9).
Figure 8.
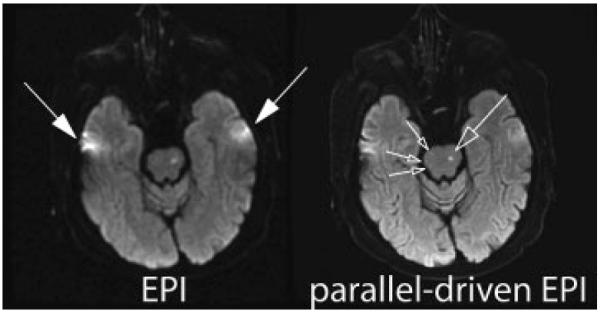
Comparison between conventional diffusion-weighted (b = 1000 second mm2) single-shot EPI at 1.5T without (left) and with (right) acceleration in patient with strokes located in the brainstem (open arrows). The latter used a parallel imaging acceleration factor of 3. By means of the faster k-space traversal with parallel imaging the distortion and blurring artifacts from field-inhomogeneities are markedly diminished (closed arrows). Temporal brain tissue exhibits significantly reduced distortions and signal loss with the use of parallel imaging. EPI, echo planar image.
Figure 9.
Parallel-driven EPI datasets acquired at 3T with an acceleration factor of 3, a target resolution of 288 × 288, three b = 0 second mm2 (T2w) and 15 directions with b = 1000 second mm2, in a scan time of 19 minutes. The isotropic diffusion image (isoDWI) is shown, as well as the fractional anisotropy (FA), and corresponding color map. EPI, echo planar image.
Motion Problems in Diffusion-Weighted Imaging
As DWI is sensitive to motion in the order of tens of microns, even locations not commonly noted for motion (such as the brain) move orders of magnitude more than the diffusive motion under investigation. Even in cooperative patients, image quality of brain scans can be corrupted by brain pulsation8,9 or slight involuntary head motions such as originating from swallowing or tremor. Due to the application of the strong motion-probing gradients, the effect of even such minute motion can lead to erroneous image encoding and substantial artifacts. These artifacts are most successfully combated by single-shot EPI scans, which explains why this readout method is still so popular. Further improvements can be achieved by prospective gating (either via electrocardiogram or more commonly with a finger pulse-oximeter). In this way, imaging can be synchronized with the pulsation of the brain, and scanning during systole can be avoided or shifted to instead select brain slices that are experiencing less brain motion. Do note, however, that the prospective gating will prolong the overall scan time.
If correctly adjusted, motion yields few to no consequences for single-shot EPI, but it is a more severe problem in interleaved or “multi-shot” acquisitions.10 Motion effects usually manifest themselves as so-called ghosting artifacts. Only recently, effective means to correct this ghosting has been introduced—which now opens the arena for high-resolution DWI, but again at the cost of prolonged scan time. For regular isotropic DWI protocols for stroke studies, the extent of scan time prolongation is still in the acceptable range. However, for DTI, the large number of diffusion directions required has forced us to sacrifice spatial resolution, unless one is willing to accept considerably long scan times.
Perfusion-Weighted Imaging
Perfusion imaging using MR is an evolving technology which has become a popular alternative to nuclear medicine perfusion techniques to study cerebral hemodynamics and blood flow.11,12 Perfusion is quantified in terms of the flow rate (milliliters/min) normalized to the tissue mass (typically per 100 g brain tissue). Perfusion-weighted imaging is used in stroke to delineate normal perfused tissue from benign oligemia and infarct core. It can also be used to determine the blood flow reserve in patients with chronic cerebrovascular abnormalities (i.e., moyamoya disease) by means of a Diamox stress test. Perfusion-weighted imaging can easily be combined with other MR techniques such as MR angiography to assess vessel patency, and DWI to assess ischemic injury to brain parenchyma.13
Currently the most popular method of perfusion imaging in MRI is dynamic susceptibility contrast (DSC) MRI using T2*-weighted gradient echo pulse sequences. By administering a paramagnetic contrast agent, the evolution of the intensity of T2*-weighted images can be analyzed to provide quantitative hemodynamic maps. However, the problem of obtaining this quantitative data using indicator dilution theory has proven to be a considerable challenge, necessitating the use of complex algorithms and procedures.
Dynamic Susceptibility Contrast-Based Techniques
Dynamic susceptibility contrast- (DSC-) MRI uses rapid measurements of the MR signal change (i.e., every 1.5 to 2.0 seconds) after the injection of a bolus of paramagnetic contrast agent. After an intravenous injection into the bloodstream, the contrast agent will generate local susceptibility gradients which reduce the T2* relaxation time and thus yield a transient loss in signal intensity in the images as the contrast material passes through the vasculature and capillaries (Fig. 10). By using a rapid gradient echo EPI sequence, T2*-weighted images of the entire brain can be generated roughly every 1.5 to 2.0 seconds. For each voxel, the changes of the T2*-weighted signal over time can be converted into concentration time curves from which one can derive important quantitative parameters that describe the status of the cerebrovascular system, such as CBV, CBF, and mean transit time (MTT).
Figure 10.

Dynamic susceptibility contrast imaging. Time course of the T2*-weighted MR images during contrast material bolus passage. Due to the high concentration of contrast material the signal intensity decreases significantly during the peak of the bolus. (Image courtesy of Rexford Newbould, GSK, London, UK.)
Calculation of CBV, CBF, and MTT
To calculate the CBV, measurements of the MR signal intensity (Fig. 11A) must be converted to concentration versus time curves (Fig. 11B). As shown in the figure, for every pixel in the brain, a curve can be created that depicts the changes in signal intensity over time as contrast enters and leaves the brain. The formula depicting these changes in concentration is as follows:
where S0 is the precontrast signal intensity, S(t) is the contrast signal intensity at time t, and TE is the echo time. Here, S0 is usually the mean of several baseline images that are averaged after the signal has reached its steady state (usually after one to four images). The scaling factor, k, relates T2* changes to concentration, because MR usually demonstrates a different sensitivity (in terms of ΔT2* changes) to contrast concentration in large vessels and parenchyma, which may also vary depending upon the overall concentration level. In addition, the value of k may change depending upon the orientation of the vessel to the main magnetic field.
Figure 11.
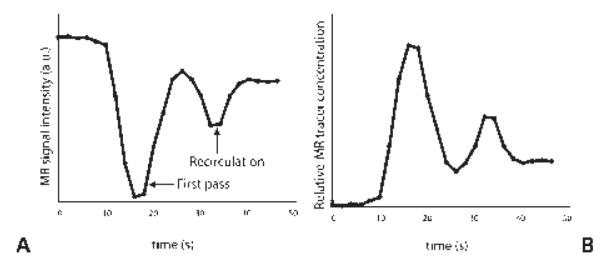
(A) Plot of the signal from a T2*-weighted sequence after injection of a contrast bolus as it travels through a region of interest in the brain. In (B), the signal is converted to concentration versus time.
Once the relationship between the T2*-weighted signal and tracer concentration is determined, one can compute the area under the contrast concentration curve to provide an estimate of the CBV on a pixel-by-pixel basis. This calculation assumes that the contrast agent is only distributed in the plasma space (i.e., 1-hematocrit) and the tissue concentration must be normalized to the blood volume in a large vessel (i.e., 100% blood volume) such as the sagittal sinus.
A parameter that describes the hemodynamic situation of brain tissue very well is the MTT—that is, the mean time an infinitesimally small bolus of contrast agent passes through the capillary system. In contrast to CBV, which gives substantial gray/white matter contrast, MTT maps in healthy subjects are quite “flat.” Thus, any abnormality will typically stand out as a region of elevated MTT. Unfortunately, the bolus is normally a couple of seconds wide, and therefore a deconvolution approach is typically applied to correct the effect of the bolus width. The result of the deconvolution approach yields the CBF, which is a highly relevant parameter to predict tissue fate. Here, the first point or the maximum of the tissue residue function is used to compute the CBF by R(t) = C(t)⊗−1A(t), where C(t) is the tissue tracer concentration over time, A(t) is the arterial concentration time course, and “⊗−1” denotes the deconvolution operation. CBV, CBF, and MTT are directly related through the central volume theorem, MTT = CBV/CBF. These three separate parametric images can be used to provide complementary perfusion-related information. Deconvolution approaches are the focus of research efforts by multiple research sites. The most commonly used technique is the model independent truncated singular vascular decomposition method (TSVD) described by Ostergaard and coworkers.14,15 The advantage of TSVD and more advanced approaches is that better inter- and intra-individual assessments can be performed. Several studies have compared CBF values using PWI with PET or with stable xenon CT and found good correlations in normal, healthy volunteers.
Perfusion-Weighted Imaging Data Acquisition
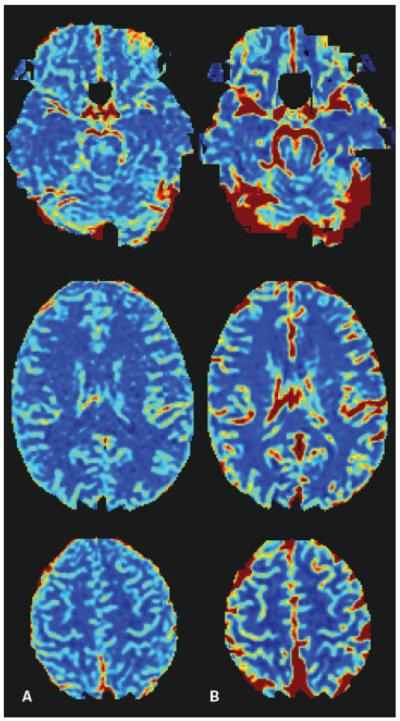
In place of gradient echo EPI, dynamic spin echo EPI acquisitions can be used to measure the concentration time course. The advantage of spin echo perfusion imaging is a selective sensitivity of signal changes to the microvasculature that avoids the strong dominance of large vessels in the maps. Similar to fMRI, spin echo PWI is driven by the dynamic dephasing mechanism, and has a considerably smaller sensitivity to contrast material. Therefore, spin echoes require the administration of more contrast agent to see effects in tissue that are comparable to gradient echo techniques (Fig. 12). Moreover, for a given temporal resolution, the number of slices that can be prescribed with spin echoes is smaller than with gradient echo EPI. Another disadvantage of spin echo PWI is the lack of good arterial input signal— and therefore a combined spin echo and gradient echo approach would be desirable.
Figure 12.
Cerebral blood flow color maps calculated from (A) spin echo, and (B) gradient echo T2*-weighted sequence. Note the great vessel contrast in the gradient echo images, and the increased levels of distortion in the frontal lobe.
Perfusion-Weighted Imaging in Stroke
For stroke, there are several patterns that should be considered. In case of reduced CBF, CBV initially increases to maintain the oxygen extraction, but the vasodilation is at some point exhausted and cannot keep up with any further drop in CBF. A decreased CBF and CBV typically indicate infarcted tissue. In situations where CBV and CBF are elevated, one speaks of luxury perfusion—an event seen frequently when previously ischemic tissue becomes reperfused. In this context, it is important to understand that even if recanalization occurs, either through mechanical throm-bectomy or the administration of intravenous/intra-arterial tissue-plasminogen activator (tPA), tissue might not reperfuse.
While relative changes or hemispherical differences of CBV and CBF are straightforward to compute, for several reasons the calculation of absolute values is still challenging and the subject of intense research. That said, time parameters (e.g., MTT) and relative CBV and CBF measures are the most frequently used metrics, as absolute CBV and CBF metrics are still affected by biases due to the aforementioned confounders (e.g., different vessel/parenchymal sensitivity, nonlinear T2* versus tracer concentration relationship, partial voluming effects, vessel orientation, etc.).
By modification of the analysis methods, several attempts have been made thus far to produce a more accurate estimate of CBF and CBV. However, several problems remain relating to the difficulty of measuring brain density and plasma hematocrit in pathological states. More importantly, measuring the exact arterial input function close to the voxel of interest is difficult, giving rise to the problems of vessel size and orientation as well as delay and dispersion of the contrast bolus.16
Despite this, DSC-MRI has provided an important, complementary technique in the clinical practice. In particular, the combination of DWI and PWI has significantly improved the diagnosis and clinical management of acute stroke patients. The most common MRI profile in patients with acute stroke is a PWI lesion that is larger than the DWI lesion (Fig. 13). Approximately 70% of patients imaged within the first 6 hours after stroke onset will demonstrate this PWI/DWI mismatch.17–20 Here, the mismatch between the lesion identified on PWI and DWI may represent an area with critical hypoperfusion but not yet infarcted tissue, that is, the ischemic penumbra. Those patients who demonstrate a large penumbra zone and also do not have a very large DWI lesion are thought to benefit more from reperfusion therapy and show a better clinical outcome than those with very little penumbra or with large infarct sizes to begin with. Alternatively, those patients who have little mismatch or a large DWI lesion demonstrate a much higher likelihood for hemorrhagic transformations and increased morbidity and mortality.21
Figure 13.
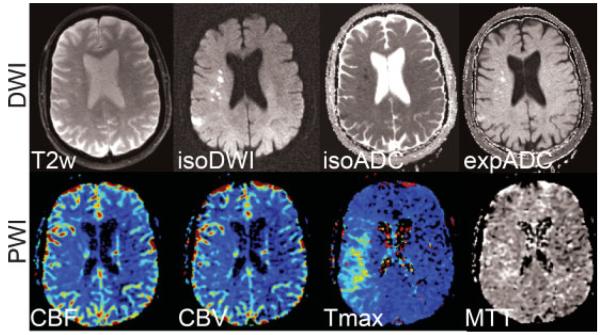
Acute stroke patient with a clear DWI-PWI mismatch pattern in the right MCA territory. (Top row) Diffusion-weighted images (b = 1000 second mm2) showing the T2-weighted (b = 0) image, isotropic DWI (isoDWI) and ADC (isoADC). The exponential ADC (expADC) is the ratio of the isoDWI to the T2, which may be used to distinguish acute from subacute stroke as it eliminates “T2-shine through” effects. (Bottom row) CBV, CBF, Tmax, and MTT maps. The area of perfusion deficit is clearly apparent in the Tmax and MTT images. Although present, the ischemic area is less apparent on the CBF and CBV maps. DWI, diffusion-weighted imaging; PWI, perfusion-weighted imaging; MCA, middle cerebral artery; ADC, apparent diffusion coefficient; CBV, cerebral blood volume; CBF, cerebral blood flow; Tmax, time to peak of the residue function; MTT, mean transit time.
Arterial Spin Labeling
Cerebral perfusion measurements can also be achieved using the arterial spin labeling (ASL) approach,22,23 which utilizes magnetically labeled arterial blood water as an endogenous diffusible tracer for CBF measurements.
With some exceptions, current methods and recent developments are based on the original ASL method first proposed by both Detre and Williams and their colleagues.22,24 These authors employed a continuous adiabatic inversion technique to invert the flowing spins in the carotid arteries. The influx of fresh, labeled protons in the tissue of interest slightly alters the magnetization and, depending on the exchange with tissue protons (therefore the T1 relaxation time of the tissue), renders this method sensitive to the local degree of microperfusion.22 Hence, any change in regional blood flow will be picked up by ASL via image contrast changes.
Considering all current capabilities and restrictions, ASL can provide perfusion maps of a large portion of the brain. However, current ASL methods are often complex and still susceptible to motion and other problems. This is probably also the reason ASL still has not replaced nuclear medicine methods—although they are usually more invasive and do not provide a better resolution. Nevertheless, ASL has been successfully applied to investigate perfusion abnormalities in cerebral stroke and patients with chronic vascular diseases,25 although to a much lesser extent than DSC-MRI perfusion studies. A major disadvantage of ASL is the sensitivity of the technique to substantial label arrival time increases, such as seen in white matter or even more so in chronic and acute cerebral diseases, in which label decay is more pronounced and affects the veracity of flow measurements. With the more widespread use of 3T units, some relief is provided as the longer T1 times offer less label decay and also a higher signal-to-noise ratio. Another very interesting variant of ASL is to selectively label individual vessels and determine their relative contribution to the overall blood supply.
SUMMARY
Magnetic resonance imaging has shown great promise for the diagnostic work-up of patients with various diseases and to facilitate treatment decisions as well as treatment monitoring. Overall, the MR techniques presented here lead to a tremendous increase of knowledge that can be obtained during an MRI session in addition to conventional structural MRI, and are obviously a great asset to making the final diagnosis or providing better differentials. It is foreseeable that many more technical improvements will occur in these areas that may further help improve diagnosis and treatment. It is hoped that, with this review, a better understanding of these exciting methods has been provided, making the reader more aware of their potential strengths and weaknesses.
ACKNOWLEDGMENTS
This work was supported in part by the National Institute of Health NIH-1R01EB2711, 1R01NS047607–01, the Oak Foundation, the Center of Advanced MR Technology of Stanford (NCRR P41 RR 09784), and the Lucas Foundation. The authors are grateful to Matus Straka and Stefan Skare for insightful discussions.
REFERENCES
- 1.Ogawa S, Lee TM, Nayak AS, Glynn P. Oxygenation-sensitive contrast in magnetic resonance image of rodent brain at high magnetic fields. Magn Reson Med. 1990;14:68–78. doi: 10.1002/mrm.1910140108. [DOI] [PubMed] [Google Scholar]
- 2.Crank J. The Mathematics of Diffusion. Oxford University Press; New York, NY: 1956. [Google Scholar]
- 3.Basser PJ, Mattiello J, LeBihan D. Estimation of the effective self-diffusion tensor from the NMR spin echo. J Magn Reson B. 1994;103:247–254. doi: 10.1006/jmrb.1994.1037. [DOI] [PubMed] [Google Scholar]
- 4.Basser PJ. Inferring microstructural features and the physiological state of tissues from diffusion-weighted images. NMR Biomed. 1995;8(7–8):333–344. doi: 10.1002/nbm.1940080707. [DOI] [PubMed] [Google Scholar]
- 5.Moseley ME, Kucharczyk J, Mintorovitch J, et al. Diffusion-weighted MR imaging of acute stroke: correlation with T2-weighted and magnetic susceptibility-enhanced MR imaging in cats. AJNR Am J Neuroradiol. 1990;11:423–429. [PMC free article] [PubMed] [Google Scholar]
- 6.Lansberg MG, Norbash AM, Marks MP, et al. Advantages of adding diffusion-weighted magnetic resonance imaging to conventional magnetic resonance imaging for evaluating acute stroke. Arch Neurol. 2000;57:1311–1316. doi: 10.1001/archneur.57.9.1311. [DOI] [PubMed] [Google Scholar]
- 7.Warach S, Chien D, Li W, Ronthal M, Edelman RR. Fast magnetic resonance diffusion-weighted imaging of acute human stroke. Neurology. 1992;42:1717–1723. doi: 10.1212/wnl.42.9.1717. [DOI] [PubMed] [Google Scholar]
- 8.Skare S, Andersson JL. On the effects of gating in diffusion imaging of the brain using single shot EPI. Magn Reson Imaging. 2001;19:1125–1128. doi: 10.1016/s0730-725x(01)00415-5. [DOI] [PubMed] [Google Scholar]
- 9.Poncelet BP, Wedeen VJ, Weisskoff RM, Cohen MS. Brain parenchyma motion: measurement with cine echo-planar MR imaging. Radiology. 1992;185:645–651. doi: 10.1148/radiology.185.3.1438740. [DOI] [PubMed] [Google Scholar]
- 10.Butts K, de Crespigny A, Pauly JM, Moseley M. Diffusion-weighted interleaved echo-planar imaging with a pair of orthogonal navigator echoes. Magn Reson Med. 1996;35:763–770. doi: 10.1002/mrm.1910350518. [DOI] [PubMed] [Google Scholar]
- 11.Baird AE, Warach S. Magnetic resonance imaging of acute stroke. J Cereb Blood Flow Metab. 1998;18:583–609. doi: 10.1097/00004647-199806000-00001. [DOI] [PubMed] [Google Scholar]; J Cereb Blood Flow Metab. 1998 Oct;18(10) Published erratum appears in. preceding 1047. [Google Scholar]
- 12.Calamante F, Thomas DL, Pell GS, Wiersma J, Turner R. Measuring cerebral blood flow using magnetic resonance imaging techniques. J Cereb Blood Flow Metab. 1999;19:701–735. doi: 10.1097/00004647-199907000-00001. [DOI] [PubMed] [Google Scholar]
- 13.Barber PA, Davis SM, Darby DG, et al. Absent middle cerebral artery flow predicts the presence and evolution of the ischemic penumbra. Neurology. 1999;52:1125–1132. doi: 10.1212/wnl.52.6.1125. [DOI] [PubMed] [Google Scholar]
- 14.Ostergaard L, Sorensen AG, Kwong KK, et al. High resolution measurement of cerebral blood flow using intra-vascular tracer bolus passages. Part II: Experimental comparison and preliminary results. Magn Reson Med. 1996;36:726–736. doi: 10.1002/mrm.1910360511. [DOI] [PubMed] [Google Scholar]
- 15.Ostergaard L, Weisskoff RM, Chesler DA, Gyldensted C, Rosen BR. High resolution measurement of cerebral blood flow using intravascular tracer bolus passages. Part I: Mathematical approach and statistical analysis. Magn Reson Med. 1996;36:715–725. doi: 10.1002/mrm.1910360510. [DOI] [PubMed] [Google Scholar]
- 16.Calamante F, Gadian DG, Connelly A. Delay and dispersion effects in dynamic susceptibility contrast MRI: simulations using singular value decomposition. Magn Reson Med. 2000;44:466–473. doi: 10.1002/1522-2594(200009)44:3<466::aid-mrm18>3.0.co;2-m. [DOI] [PubMed] [Google Scholar]
- 17.Sorensen AG, Buonanno FS, Gonzalez RG, et al. Hyperacute stroke: evaluation with combined multisection diffusion-weighted and hemodynamically weighted echo-planar MR imaging. Radiology. 1996;199:391–401. doi: 10.1148/radiology.199.2.8668784. [DOI] [PubMed] [Google Scholar]
- 18.Beaulieu C, de Crespigny A, Tong DC, et al. Longitudinal magnetic resonance imaging study of perfusion and diffusion in stroke: evolution of lesion volume and correlation with clinical outcome [see comments] Ann Neurol. 1999;46:568–578. doi: 10.1002/1531-8249(199910)46:4<568::aid-ana4>3.0.co;2-r. [DOI] [PubMed] [Google Scholar]
- 19.Barber PA, Darby DG, Desmond PM, et al. Prediction of stroke outcome with echoplanar perfusion- and diffusion-weighted MRI. Neurology. 1998;51:418–426. doi: 10.1212/wnl.51.2.418. [DOI] [PubMed] [Google Scholar]
- 20.Schlaug G, Benfield A, Baird AE, et al. The ischemic penumbra: operationally defined by diffusion and perfusion MRI. Neurology. 1999;53:1528–1537. doi: 10.1212/wnl.53.7.1528. [DOI] [PubMed] [Google Scholar]
- 21.Albers GW, Thijs VN, Wechsler L, et al. Magnetic resonance imaging profiles predict clinical response to early reperfusion: the diffusion and perfusion imaging evaluation for understanding stroke evolution (DEFUSE) study. Ann Neurol. 2006;60:508–517. doi: 10.1002/ana.20976. [DOI] [PubMed] [Google Scholar]
- 22.Detre JA, Leigh JS, Williams DS, Koretsky AP. Perfusion imaging. Magn Reson Med. 1992;23:37–45. doi: 10.1002/mrm.1910230106. [DOI] [PubMed] [Google Scholar]
- 23.Detre JA, Zhang W, Roberts DA, et al. Tissue-specific perfusion imaging using arterial spin labeling. NMR Biomed. 1994;7(1–2):75–82. doi: 10.1002/nbm.1940070112. [DOI] [PubMed] [Google Scholar]
- 24.Williams DS, Detre JA, Leigh JS, Koretsky AP. Magnetic resonance imaging of perfusion using spin inversion of arterial water. Proc Natl Acad Sci U S A. 1992;89:212–216. doi: 10.1073/pnas.89.1.212. [DOI] [PMC free article] [PubMed] [Google Scholar]
- 25.Calamante F, Gadian DG, Connelly A. Quantification of perfusion using bolus tracking magnetic resonance imaging in stroke: assumptions, limitations, and potential implications for clinical use. Stroke. 2002;33:1146–1151. doi: 10.1161/01.str.0000014208.05597.33. [DOI] [PubMed] [Google Scholar]


