Abstract
Previous flow velocity measurements during phonation in canine larynges were done above the glottal exit. These studies found that vortical structures are present in the flow above the glottis at different phases of the glottal cycle. Some vortices were observed to leave the glottis during the closing phase and assumptions were proposed regarding their formation mechanism. In the current study, intraglottal velocity measurements are performed using PIV, and the intraglottal flow characteristics are determined. Results from five canine larynges show that at low subglottal pressure the glottis assumes a minimal divergence angle during closing and the flow separates at the glottal exit. Vortical structures are observed above the glottis but not inside. As the subglottal pressure is increased, the divergence angle between the folds during closing increases and the location of the flow separation moves upstream into the glottis. Entrainment flow enters the glottis to fill the void that is formed between the glottal jet and the fold. Vortical structures develop near the superior edge at medium and high subglottal pressures from the flow separation. The magnitude of their swirling strength changes as a function of the wall dynamics.
INTRODUCTION
In the classic myoelastic-aerodynamic theory of voice production, Van den Berg1 proposed that vocal fold vibration was due to the interaction between vocal fold elasticity and intraglottal aerodynamics. Since the publication of this paper in 1958, significant advances have been made to identify the mechanisms responsible for vocal fold vibration; the vast majority of this research has been performed using theoretical and mechanical models. Designing these models requires the characterization of the intraglottal shape, vocal fold mechanical properties, and intraglottal aerodynamics in tissue models. The mechanical properties of the vocal folds were measured in excised larynges (Hirano,2 Chhetri et al.,3 and Goodyer et al.4) and the intraglottal geometry was investigated in a hemilarynx model (Berry et al.5 and Döllinger et al.6). However, detailed measurements of the intraglottal velocity fields in tissue models are scant.
Theoretical models of the intraglottal aerodynamics have differed regarding the flow patterns that characterize different phases of the folds' vibration. During the opening phase of vocal fold vibration, the glottis assumes the shape of a converging nozzle and the airflow is attached to the entire medial surface of the vocal folds; in this case, all theoretical models assume that the flow separates from the superior surface of the vocal folds at the glottal exit. During the closing phase, the glottis acquires a shape of a diverging nozzle. As the divergence angle between the folds exceeds a certain value, the flow can no longer follow the contour of the wall inside the glottis and the location where the flow separates begins to move upstream inside the glottis. Using a computational model, Zhao et al.7 suggested that during closing the flow separates at the inferior edge of the glottis. Other computational studies (Decker and Thomson,8 Alipour and Scherer,9 and Zhang10) suggested that the location changes as a function of the closing phase. Sciamarella and Le Quéré11 predicted that the location will also change as a function of the changes in intraglottal flow rate. The location of flow separation was also examined experimentally by Kucinschi et al.12 in a static mechanical model and showed similar dependence on the flow rate. Kucinschi et al. also found that the location was dependent on the presence of the false vocal folds.
Downstream of the separation point, the velocity between the separated flow and the walls becomes negative (i.e., flow reversal relative to the main stream direction), resulting in flow recirculation. This recirculating flow is fed by flow that is entrained from above the glottis and can roll into vortices that are referred to as flow separation vortices (FSV). These vortices are external to the jet and are different from the Kelvin–Helmholtz vortices, which are formed within the initial shear layer of the jet due to the Kelvin–Helmholtz instability. Zhao et al.7 predicted the formation of intraglottal vortices using direct numerical simulation (DNS) and noted that these were Kelvin–Helmholtz vortices because their formation frequency was higher than the forcing frequency of the model.
While there have been no published measurements of the intraglottal flow field in an excised larynx, velocity measurements have been made above the vocal folds. Berke et al.,13 Verneuil et al.,14 and Alipour and Scherer15 measured the flow velocities using a single hot-wire probe placed 10 mm above the vibrating folds to avoid interfering with the vibrations and to prevent damage to the probe. Single hot-wire anemometry assumes that the flow is in a direction perpendicular to the wire, and thus it is not adequate for measurements of rotational motion and vortical structures. Using particle imaging velocimetry (PIV), Khosla et al.16 measured the velocity fields directly above the glottal exit and showed the formation of vortices during the mid-to-latter part of the closing phase. They proposed that these vortices were formed inside the glottis due to flow separation and subsequently were advected downstream out of the glottis.
The method used by Khosla et al.16 was modified to include measurements of the intraglottal geometry and the velocity fields inside the glottis in an excised vibrating canine larynx. PIV measurements were taken using a time resolved system, which provides added insight into the transient dynamics of the intraglottal flow. Results from five larynges are shown and comparisons to current models are discussed.
METHODOLOGY
Experimental setup
Five excised larynges were harvested from shared research mongrel canines immediately after the animals were euthanized. The animals gender and weight were: male—15.0 kg, female—17.2 kg, female—19.1 kg, male—17.2 kg, and male—19.5 kg. The membranous lengths of their vocal folds were 14.0, 14.2, 14.5, 14.0, and 17.0 mm, respectively. The heights (measured along the medial aspect) of their folds were 2.5, 3.0, 3.0, 3.0, and 3.5 mm, respectively. The tracheas, having diameter size of 1.5–2.5 cm, were kept between 3–5 cm long. The dimensions of the vocal folds were measured using a hand-held caliper (Mitutoyo, 500-196-20 Absolute Digimatic Caliper). All cartilage and soft tissue above the vocal folds were removed in order to produce an unobstructed view of the folds. PIV measurements were performed within 24 h postmortem, and the larynges were kept in saline when not used. In order to get the vocal folds to vibrate, the folds were adducted by placing a suture through both vocal processes at the same level. The stitch was tied with the minimal tension needed to have a pre-phonatory width of 0 mm between the vocal processes. Special care was taken to position the suture symmetrically in both the anterior-posterior and inferior-superior directions. The posterior (cartilaginous) glottis was also closed with a suture.
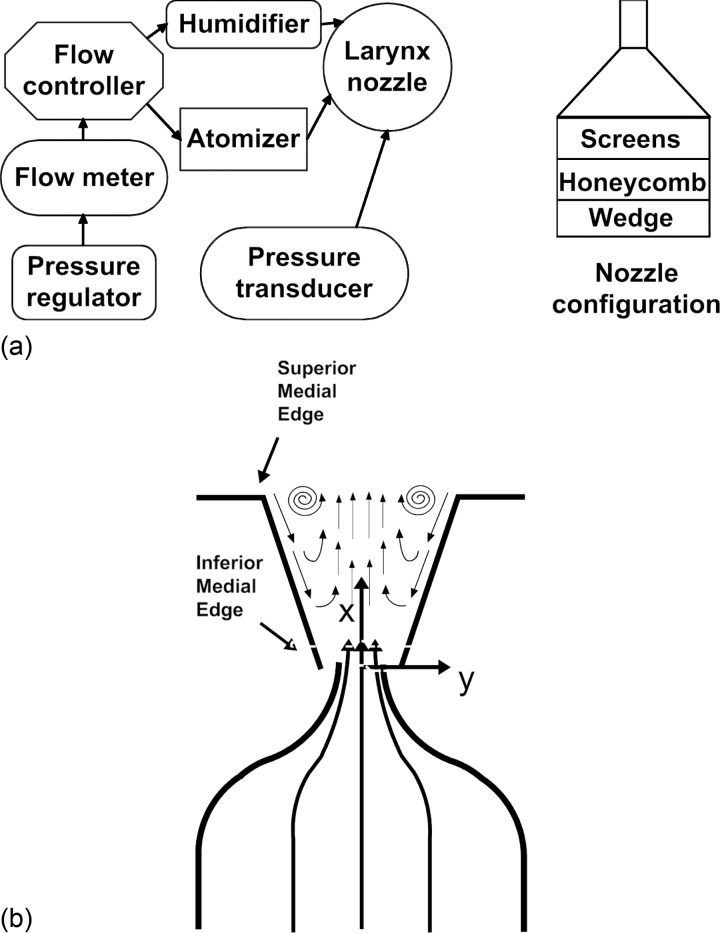
The larynx was supported using a four-prong support attached to the cricoid. The trachea was fitted over an aerodynamic nozzle that was connected to a cylindrical settling chamber (101 mm ID, 250 mm long) in which the airflow was conditioned before entering the glottis. The inside of the chamber included a perforated wedge, honeycomb, and screens. The airflow transitioned from the chamber into the trachea via a nozzle having a contraction ratio of 1:35 with a fifth order polynomial profile. The exit section of the nozzle, which was connected to the trachea, was 25 mm long, with an ID of 12.7 mm at its inlet and 17.0 mm at the exit. The design of the settling chamber and the nozzle was constructed according to guidelines given by Morel17 and Mehta.18 The pressure inside the chamber was measured using a pressure transducer (Honeywell, FPG). The airflow was humidified (Hudson RCI, ConchaTherm III®) and regulated using a flow controller (Parker, MPC series), a flow meter (MicroMotion Inc, CMF025 Coriolis Flow Meter), and a pressure regulator (ControlAir Inc, type 100 Precision Air Pressure Regulator). Polyurethane tubing (3/4 in. OD, 1/8 in. wall) was used to connect between the different instrumentations. Figure 1a shows the flow control schematic of the current experiment. Figure 1b depicts schematically the glottis attached to the nozzle and the flow inside the glottis. It also defines the coordinate system with the origin at the glottal exit center. The velocity components are defined as u, v, and w in the x, y, and z directions, respectively.
Figure 1.
Experimental setup: (a) Flow control schematics. (b) Schematic of the PIV measurement at the mid-membranous plane (i.e., coronal plane). The z axis is pointing out of the page. u, v, and w are velocity components in the x, y, and z directions. The PIV camera is located on the x-z plane, anterior and superior to the larynx. The laser sheet is projected from above the larynx in the x-y plane.
A 70 cm × 50 cm × 80 cm enclosure was constructed around the testing area, using clear vinyl sheets, in order to seed the ambient air, which enabled measurements of the entrained flow into the glottal jet. The enclosure was not sealed and was large enough not to disturb the laryngeal airflow and not to affect the acoustics. Both the ambient air in the enclosure and the glottal flow were seeded using DEHS oil [bis(2-ethylhexyl) sebacate] generated by an atomizer (TSI, model 9306).
The PIV measurements were performed by illuminating the flow using a high repetition rate, dual cavity, Nd:YLF laser system (Litron Lasers, LDY304) synchronized with a high speed video camera (Photron, FASTCAM SA5). Fluorescent red dye (Cole-Parmer, Rhodamine WT Dye) was applied to the tissue in conjunction with a 527 nm band-pass filter to reduce the laser reflections from the tissue. The PIV camera was fitted with a Nikon 85 mm F/1.4 lens, 72 mm extension tubes, and ×1.4 teleconverter, which yielded spatial resolution of 83 pixel/mm. Each image pair was taken at a time interval of 3.0 μs. A total of 2000 PIV images were taken at 5 kHz and the camera TTL signal was captured for reference. Post processing of the PIV data was done using DAVIS® 8.1 software (LaVision GmbH) with a multi-pass decreasing window size (64 × 64 to 32 × 32) and adaptive interrogation window with 75% overlap. The velocity vector fields were filtered such that the maximum particle displacement never exceeded one fourth of the interrogation window and the minimal particle displacement was no less than one fourth of a pixel (equivalent to 1 m/s).
The laser was focused and spread to produce a 1 mm thick light sheet in the coronal plane, halfway between the vocal process and the anterior commissure (referred to as the mid-membranous plane). In order to perform intraglottal velocity measurements, the laser sheet illuminated the mid-membranous plane (x-y) from above and the camera was placed in the x-z plane above the vocal folds at an oblique angle of 40° relative to the x-y plane, directed towards the glottis. A Scheimpflug optical adaptor (LaVision GmbH) was connected between the camera and the teleconverter to correct the image distortion due to the oblique viewing angle.
The glottal opening was captured with a high-speed (HS) video camera using resolution of 25.5 pixel/mm. The camera was placed approximately 80 cm above the glottis and a total of 14 000 images were taken for each case at a sampling rate of 20 kHz. The acquisition of the glottal opening images was synchronized with the acquisition of the PIV images based on the TTL signal of both cameras.
Acoustic measurements were performed using a microphone (Brüel & Kjær, 0.5 in. free-field microphone, model 4950) that was placed approximately 15 cm laterally and superiorly to the glottis where it did not interfere with the airflow. The accuracy of the microphone was ±0.2 dB. An electroglottograph (EGG) was used to determine glottal opening and closing by attaching its electrodes to the cricoid. The sampling rates for the pressure transducer, EGG, TTL, and microphone were 200 kHz using a National Instrument data acquisition system (NI, PXIe-6356).
The timing of the PIV, high-speed images, and data acquisition was synchronized using a shared reference clock with a timing and synchronization module (NI PXIe-6672) equipped with an onboard high-stability reference clock (temperature compensated crystal oscillator).
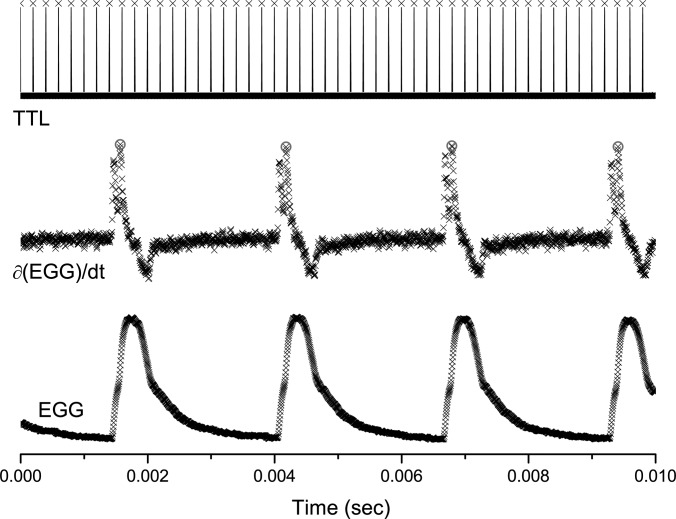
The phase of the intraglottal velocity fields was determined using the EGG as a reference signal. It was selected because of its low cycle-to-cycle variation compared to the microphone signal. Golla et al.19 showed that using the time derivative of the EGG signal provided the most distinctive and repeatable reference points, hence minimizing the cycle-to-cycle variations in the signal. The sharp peaks in the time derivative of the EGG signal were used as reference points (Fig. 2). The TTL signal captured from the camera marked the beginning of the image acquisition and its phase was determined relative to the reference point of the EGG. The 0° phase was defined as the beginning of opening, which was determined from the EGG signal. The glottal cycle (0°–360°) included opening, closing, and closed phases.
Figure 2.
(Color online) Sample data from the EGG and TTL signals. Red circles show the reference points on the ∂EGG/∂t signal. The TTL signal marks the beginning of the frame acquisition by the PIV camera. The sampling rate for the EGG and TTL was 200 kHz. The sampling rate for the PIV was 5 kHz.
Experimental uncertainties
The seeding for the PIV had a mean particle size of 0.3 μm. Chein and Chung20 showed that in order for a particle to follow an incompressible flow, the Stokes number, defined as , should be less than 0.2. Here and , where ρp and Dp are the particle density and diameter, respectively. μ is the absolute viscosity of air, UCL is the average centerline velocity of the glottal flow, and δo is the thickness of the shear layer at the orifice (measured as the radial distance where the velocity drops to 80% of its value at UCL). The upper bound for the PIV measurements in the current study was S = 0.002, which according to Crowe et al.21 sets the estimated error due to the Stokes number effect at less than 2%.
The uncertainties of the PIV measurements were estimated to be in the orders of 0.1 pixel for the particle displacement and 1 ns for the timing of the laser pulses.
RESULTS
Phonation of each larynx was tested at three subglottal pressures: low, medium, and high. The three pressure levels for each larynx and the corresponding vibration frequency are listed in Table TABLE I.. Data acquisition was initiated about 10 s after the onset of phonation to allow for the vibration frequency to stabilize. Larynx L2 was harvested from a female canine and showed higher fundamental frequency of vibrations compared to the other larynges. Larynges L2 and L3 were characterized by a zipper-like motion, where closing in the anterior-posterior direction is out-of-phase with closing in the inferior-superior direction. In the case of the zipper motion, a prominent mucosal wave is present in the anterior-poster direction. Granqvist et al.22 who also observed the zipper-like motion did not find this characteristic to affect the acoustics. The zipper-like motion was observed from the HS camera located above the larynx and had no affect on the velocity measurements from PIV.
TABLE I.
Experimental parameters for the study.
| Larynx | Folds length (mm) | Subglottal pressure (cm H2O) | F0 (Hz) | Notes |
|---|---|---|---|---|
| L1 | 14.0 | 10.0 | 153 | Male canine |
| 19.4 | 124 | No flow separation at low PSG | ||
| 25.5 | 126 | |||
| L2 | 14.2 | 15.1 | 320 | Female canine |
| 18.5 | 347 | Zipper-like motion | ||
| 21.5 | 383 | No flow separation at low PSG | ||
| L3 | 14.5 | 14.7 | 114 | Female canine |
| 19.1 | 130 | Zipper-like motion | ||
| 24.9 | 149 | No flow separation at low PSG | ||
| L4 | 14.0 | 18.8 | 87 | Male canine |
| 22.8 | 118 | |||
| 27.2 | 119 | |||
| L5 | 17.0 | 15.2 | 66 | Male canine |
| 20.2 | 84 | |||
| 27.5 | 104 |
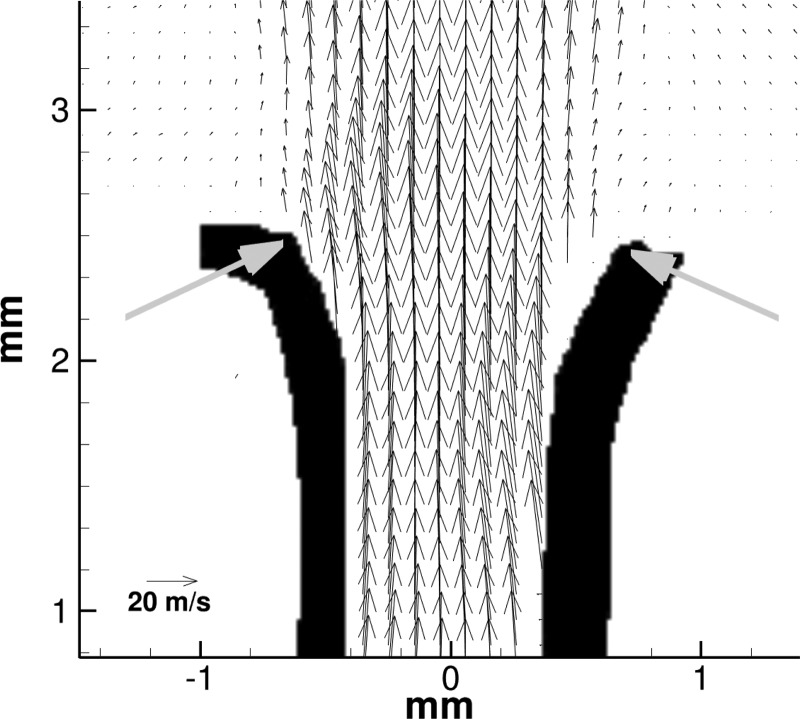
The intraglottal velocity field at low subglottal pressure in larynx L1 (PSG = 10.0 cm H2O) is shown for a phase of θ = 197° in Fig. 3. In this case, the closing phase occurs during 150° < θ < 250° and the phase that is shown occurs in mid-closing. The length of the vectors (i.e., arrows) in the velocity field corresponds to the velocity magnitude. The gray arrows in the figure mark the superior aspect of the folds. The lateral displacement of the folds produces minimal divergence of the glottis and the flow does not separate from the glottal wall. In this case flow separation occurs at the glottal exit.
Figure 3.
(Color online) Intraglottal velocity field during closing (θ = 197°) for low subglottal pressure (PSG = 10.0 cm H20) in larynx L1. The flow does not separate from the glottal wall. Arrows mark the approximate location of the superior edge.
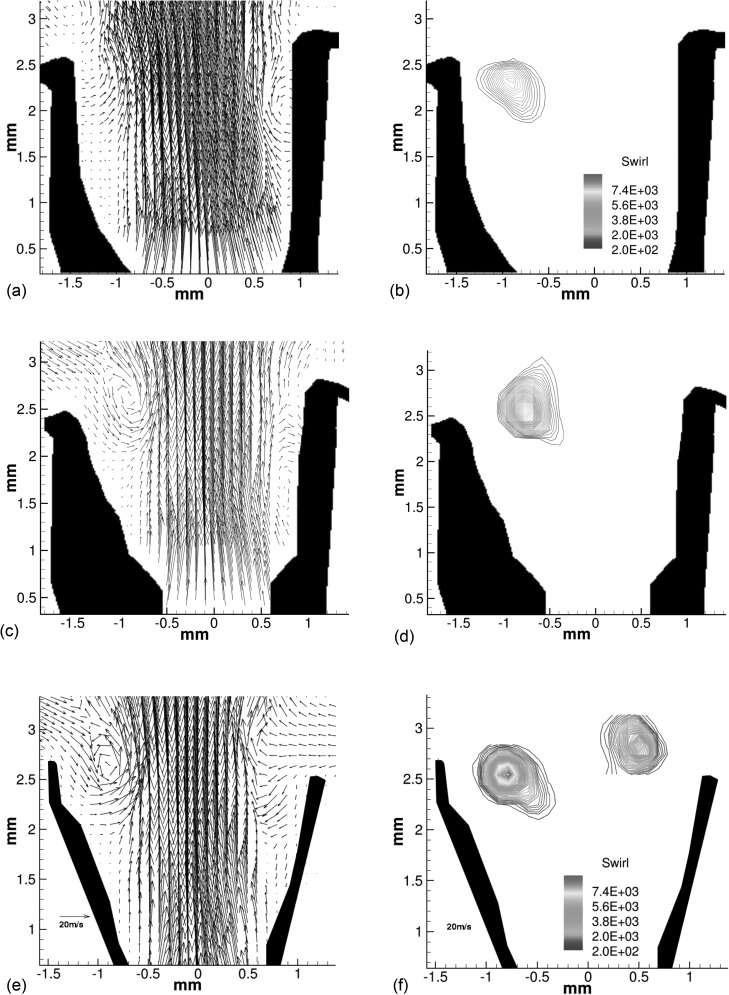
The intraglottal velocity fields for three phases during closing (θ = 128°, 135°, and 137°) for larynx L1 at high subglottal pressure (PSG = 25.5 cm H2O) are shown in Fig. 4. The images were taken during a single cycle (i.e., from consecutive PIV images). They show that at high PSG the glottal wall assumes a much larger divergence angle compared to the divergence angle at low subglottal pressure. The diverging shape is formed by the superior-inferior mucosal wave (the closing phase occurred during 105° < θ < 160°).
Figure 4.
(Color online) Intraglottal velocity and swirling strength fields during closing for high subglottal pressure (PSG = 25.5 cm H2O) in larynx L1. (a),(b) θ = 128°; (c),(d) θ = 135°; (e),(f) θ = 137°. Because of the diverging angle, the flow separates from the glottal wall, external flow is entrained into the glottis and a flow separation vortex develops. Velocity fields are shown using the same scale [shown in (e)].
The closing of the folds begins at the inferior edge with minimal divergence angle, and therefore the flow does not separate except at the top of the superior edge, similar to the low subglottal pressure of this larynx. Although it is not seen clearly in the velocity field image [Fig. 4a, θ = 128°], swirling in the flow begins to develop near the superior aspect as the flow begins to separate from the glottal wall [Fig. 4b]. The rotational motion in the flow is identified using the swirling strength parameter, λci, which is a quantity that reveals areas in the flow with high swirling motion (Adrian et al.23).
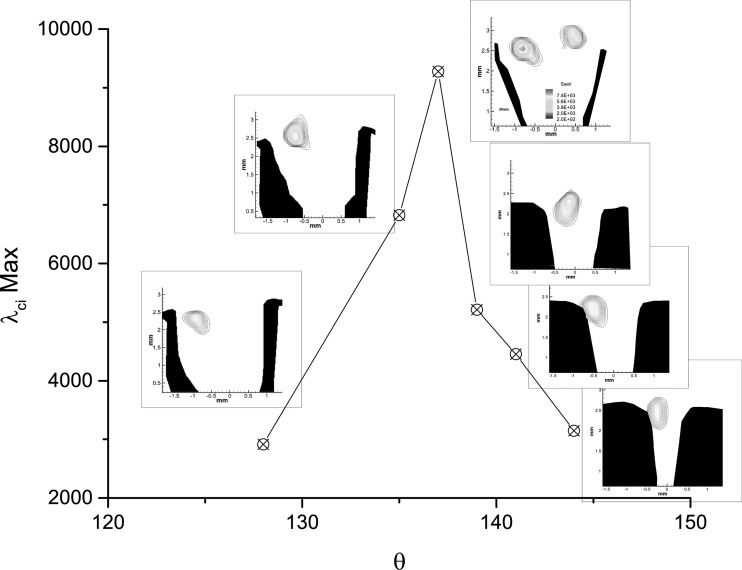
Around the middle of closing [θ = 135° in Fig. 4c], the left glottal wall forms a larger divergence angle and the flow separates from that wall. The exact location where flow separation occurs is hard to determine because of the limited ability of the PIV to obtain accurate data in the proximity of the wall. However, separation can be observed at the lower quadrant of the left fold. Ambient flow is being entrained into the void that is formed between the glottal jet and the wall. The entrainment flow rolls into a vortex near the superior edge [Fig. 4d]. The maximum magnitude of the swirling strength have increased to 6800s2 compared with 2900s2 at θ = 128°.
The maximum lateral displacement of the superior aspect, which corresponds to the maximum divergence angle of the folds, occurs around θ = 137° [Fig. 4e]. Entrainment flow is observed near the right fold and the vortex is still present near the superior aspect of the left fold. The location of the vortex did not change much relative to the previous image, but the magnitude of the swirling strength in the flow increased to 9300s2 [Fig. 4f; note that Figs. 4b, 4d, 4f are shown on the same scale].
Another observation is the left-right asymmetries of the walls that is shown in Fig. 4. The successive images (i.e., taken in the same cycle) show that slight asymmetry develop at the beginning of closing, but quickly subside. Figure 4c shows that the divergence angle on the left fold is greater than on the right. On the next image, which is taken θ = 2° later, the divergence angle is about the same on both sides of the folds. Quantifying the divergence angle, or the exact location of the glottal wall, from the PIV images is difficult because the reflection of the laser from the tissue surface can affect the quality of the data near the wall. The asymmetry motion of the wall was not observed in the HS images that were taken from above the larynx. On the other hand, there is a clear asymmetry in the dynamics of the glottal flow where the swirling in the flow is much higher initially near the divergent left fold [cf. Figs. 4d, 4f]. The asymmetry characteristics of the intraglottal flow did not show an affect on the acoustic characteristics, but its existence should be considered when studying the hemilarynx model.
Figure 5 shows how the magnitude of the swirling strength develops in the glottis during the closing phase for larynx L1 at high PSG. The inserted images in the figure illustrate the geometry of the folds and the location of the vortical structures in the glottal flow. The figure shows that after a peak in the magnitude near θ = 137°, the swirling strength in the glottis starts to decay. The location for the maximum swirling in the inserted images reveal that the vortical structures remains near the superior aspect of the fold, probably encompassed by the entrainment flow that enters the glottis. Similar observations were made for larynges L2–L5 in medium and high PSG.
Figure 5.
(Color online) Maximum magnitude of the swirling strength, λci, during closing for high subglottal pressure (PSG = 25.5 cm H2O) in larynx L1. The inset images show the glottal geometry and the location of the FSV for each measurement. Contours of the swirling strength are shown on the same scale.
The intraglottal vortical structure that is identified in the inserted images of Fig. 5 remains near the superior aspect and does not advect downstream with the glottal jet. This type of flow behavior, where a vortex remains stationary can be seen in a flow behind a sphere or above a delta wing (Van Dyke24). In both examples, upstream airflow particles are moving past the body, twirl inside the vortex, then continue to move downstream. The structure of the vortex, however, remains at the same location and do advect downstream.
The observation that intraglottal vortices are formed near the superior aspect and do not advect downstream indicates that these vortices developed from the flow separation in the glottis and not from the Kelvin–Helmholtz instabilities in the jet, which was suggested by Zhao et al.7 The Kelvin–Helmholtz vortices are not stationary and are expected to advect downstream with a convective velocity magnitude that is 0.7 times the magnitude of the centerline jet velocity (Gutmark and Ho25).
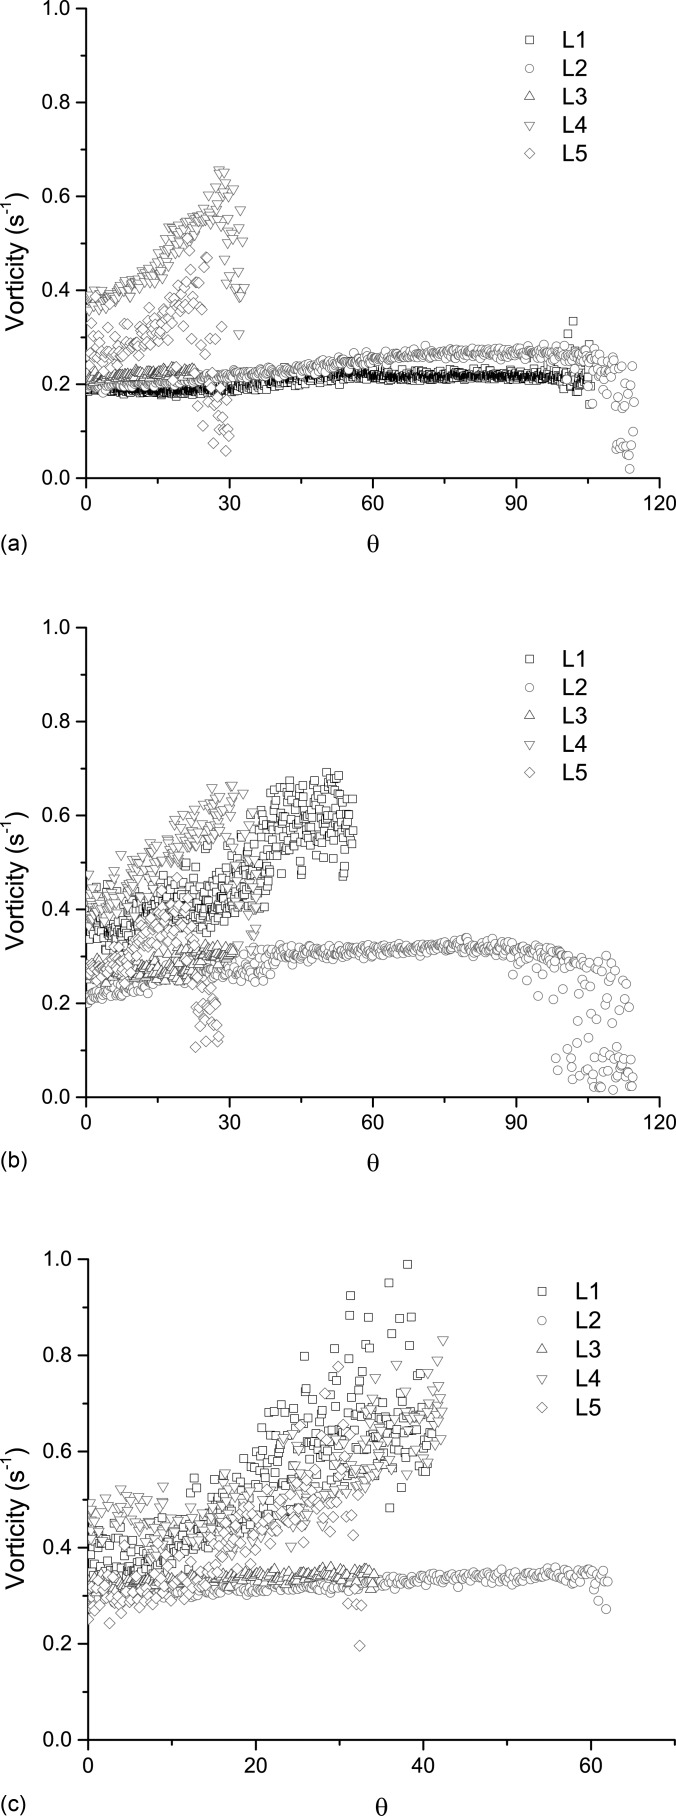
The maximum magnitude of the out-of-plane component of vorticity of the intraglottal flow, for the five larynges is shown in Fig. 6. The figure shows the vorticity component only during the closing phase (i.e., 0° corresponds to the beginning of the closing phase). At low PSG [Fig. 6a] there is a noticeable increase in the magnitude of the intraglottal vorticity in larynges L4 and L5, but not much for larynges L1, L2, L3; the difference may be due to the fact that no flow separation was observed in these three larynges, but some flow separation did occur in larynges L4 and L5.
Figure 6.
(Color online) The highest magnitude of the intraglottal out-of-plane vorticity component during closing for (a) low, (b) medium, and (c) high PSG. The value shown in each phase is taken as the highest magnitude computed near the superior aspect of the folds.
The intraglottal out-of-plane component of the vorticity is directly related to the dynamics of the flow separation in the glottis. The vorticity component level is about constant at the beginning of closing and begins to increase as flow separation develops in the glottis. As closing progresses, the divergence angle between the folds grows larger, which increases the entrainment into the glottis with a concomitant increase in the out-of-plane vorticity component magnitude in the flow. FSV may develop in the glottis in the separated region augmenting the magnitude of the out-of-plane vorticity component within the glottis.
The increase in the out-of-plane vorticity component for larynges L2 and L3 was not as pronounced as the other larynges [Figs. 6b, 6c] and could be related to the zipper-like motion of the folds that was observed in them. Such anterior-posterior motion, which is out-of-phase with the superior-inferior motion may affect the flow dynamics.
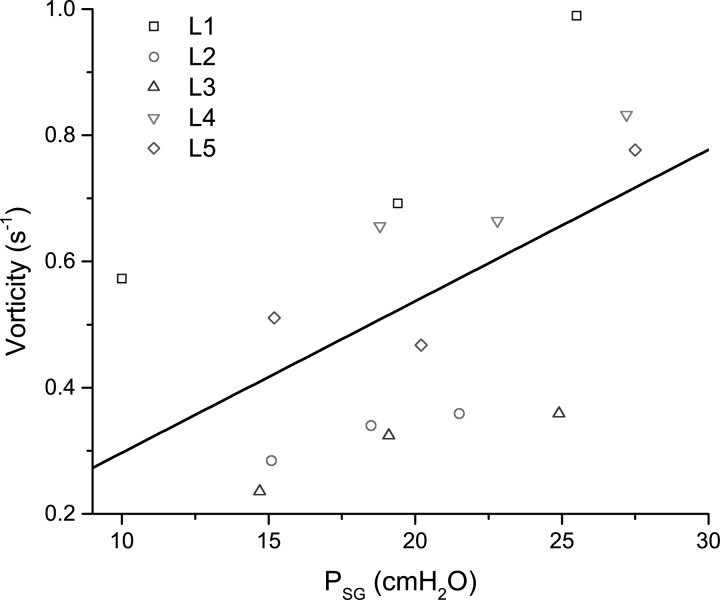
Figure 7 shows the maximum magnitude of the out-of-plane vorticity component near the superior aspect of the folds as a function of the subglottal pressure. The solid line marks the linear regression fit to the data. Increasing the subglottal pressure correlates with an increase in the magnitude of the intraglottal out-of-plane vorticity component. Increasing the subglottal pressure causes the velocity of the glottal jet to increase resulting in stronger entrainment and an increase in the vorticity.
Figure 7.
(Color online) Maximum magnitude of the out-of-plane vorticity component as a function of the subglottal pressure. The solid line marks the linear regression fit to the data. The ranges for PSG varied between 10.0 to 18.8 cm H2O for the low, 18.5 to 22.8 cm H2O for the medium, and 21.5 to 27.5 cm H2O for the high.
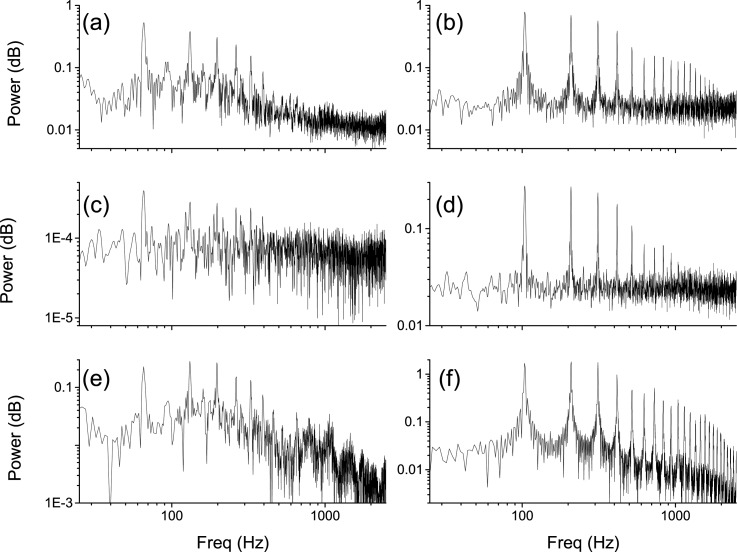
In addition to the characteristics of the intraglottal flow, the instability of the jet above the glottis was examined using the spectral information extracted from the time resolved PIV measurements. A power spectrum was computed for each interrogation window in the flow field based on the axial velocity measurements. The spectrums at each axial location were averaged across the width of the jet: , where is the power spectrum, n is the total number of interrogation windows where the axial velocity is >0.2UCL, and j is the axial distance. UCL is the centerline axial velocity. Figure 8 shows power spectrums for the aerodynamics of the flow above the glottis for the case of larynx L5 and compares the data with the power spectrum from the acoustics measurements. The images in the left column are based on low subglottal pressure (PSG = 15.2 cm H2O) and the images in the right column are based on high subglottal pressure (PSG = 27.5 cm H2O). The images in the top row show the spectrums computed based on the velocity fields measured immediately above the glottal exit. The images in the middle row show the spectrums computed based on the velocity fields measured 1.5 mm downstream of the glottal exit. The images in the bottom row show the spectrum computed based on the acoustic measurements (measured 15 cm laterally and superiorly to the glottis). The fundamental frequency, F0, and the higher harmonics in the velocity spectrum at the glottal exit match well with the acoustics spectrum. The figure also shows that increasing the subglottal pressure corresponds to an increase in the magnitude of the energy in the higher harmonics frequencies, which can affect speech recognition in listeners (Stevens26).
Figure 8.
Power spectrums for the flow above the glottis in larynx L5. (a), (c),(e) Low subglottal pressure, PSG = 15.2 cm H2O, and F0 = 66. (b),(d),(f) High subglottal pressure, PSG = 27.5 cm H2O, and F0 = 104. The power spectrums based on velocity fields are averaged across the glottal jet and are shown for the measurements at the glottal exit (a),(b) and 1.5 mm downstream of the glottal exit (c),(d). Power spectrums based on acoustic measurements (e),(f).
The small structures (eddies) in the flow produce the energy of the higher harmonics that are shown in Fig. 8b. These small structures decay rapidly downstream of the glottis and the magnitude of the higher harmonics in the flow decreases correspondingly [Fig. 8d].
It is unknown in the current study how the decay of the higher harmonics in the acoustic signal follows since the data was collected using only one microphone. However, the decay of the energy in the flow occurred within 1.5 mm above the glottis and the acoustic data is measured much further downstream (15 cm). It therefore suggests that the small structures in the flow do not contribute to the higher harmonics of the acoustic signal.
DISCUSSION AND CONCLUSION
Detailed intraglottal velocity measurements using PIV are presented in a canine model of the larynx. The results show that the intraglottal velocity is correlated with the motion of the wall and the magnitude of the subglottal pressure. The dynamics of the centerline glottal jet, which can be predicted by the Bernoulli equation, shows that the flow accelerates and decelerates corresponding to the lateral and medial displacement of the folds. The current results also show that during closing the intraglottal flow separates from the glottal wall and vortical structures with high swirling strength are formed at the superior aspect of the folds downstream of the point of separation. These flow dynamics cannot be predicted by Bernoulli.
The results show that at low subglottal pressures, the divergent angle of the folds during closing is minimal and the intraglottal flow does not separate from the folds. As the subglottal pressure is increased, the divergence angle increases and the flow separates from the glottal wall. This induces external flow to be entrained into the area between the separated flow and the wall. As the separated area increases, the entrained flow can form vortices.
The main weakness of the current study is that it only captures the wall motion and flow dynamics in a single, 2-D, (mid-membranous) plane. The results for the out-of-plane vorticity component are based on the u and v velocity components. It is likely that the w (i.e., out-of-plane) component of velocity also contributes to the dynamics of the flow, as suggested by Scherer et al.27
The flow separation location occurs at the glottal exit during opening, and as the folds diverge during closing it moves upstream into the glottis. The exact location of the intraglottal flow separation could not be determined as the nature of the PIV yields higher uncertainties of the measurements near the wall. However, the flow did not separate at the glottal entrance (i.e., highest constriction) as suggested by the computational model of Zhao et al.7 The current data shows that the location moved inside the glottis, as predicted by Decker and Thomson,8 Alipour and Scherer9 (computationally), and by Zhang10 (numerically). It could not be determined how the location changed as a function of the glottal angle, which was predicted by Sciamarella and Le Quéré,11 because of the lack of spatial information from the PIV data.
Once the glottal flow separates from the glottal wall, the entrained flow can develop into FSV that affect the dynamics of the glottal flow and possibly the pressure distribution within the glottis. It is well established that vortices can generate pressures that are less than atmospheric (i.e., negative pressure), and its magnitude depends on the strength of the rotational motion. For example, measured velocity fields over bat wings during flight show that FSV, which occurred directly above the wings, produce 40% of the lift force due to the induced negative pressure (Muijres et al.28). It is yet to be determined whether the FSV in the glottis generate negative pressures near the superior aspect of the fold and whether its magnitude and duration is sufficient to affect the aeroelastic behavior of the vocal folds.
In addition to the aeroelastic forces in the glottis, the FSV could also affect the aeroacoustic properties of the voice. Barney et al.29 showed that a dipole acoustic source could be generated by the interaction of the vortex generated by the vibrations of the folds with the solid boundary of the vocal tract. Since no vocal tract was used in the current study, it eliminated the existence of a dipole source. Consequently, the affect of FSV on the acoustics, if any, could not be determined in the current study.
Further work is needed to better understand how the intraglottal flow characteristics affect the folds' dynamics. The contribution of the folds' elasticity, the intraglottal flow dynamics on the superior/inferior displacement, and divergence angle are currently being investigated. Together with the assessment of the intraglottal pressure, these data could be used to elucidate the mechanism driving the different phases of vocal fold vibrations.
ACKNOWLEDGMENTS
The authors acknowledge the support of NIH Grant No. 5R01DC009435. The authors thank Doug Dembinski and John Cha for their contribution in performing the experiments.
References
- Van den Berg J., “Myoelastic-aerodynamic theory of voice production,” J. Speech Lang. Hear. Res. 1, 227–244 (1958). [DOI] [PubMed] [Google Scholar]
- Hirano M., “Morphological structure of the vocal cord as a vibrator and its variations,” Folia. Phoniatr. 26, 89–94 (1974). 10.1159/000263771 [DOI] [PubMed] [Google Scholar]
- Chhetri D., Zhang Z., and Neubauer J., “Measurement of Young's modulus of vocal folds by indentation,” J. Voice 25, 1–7 (2011). 10.1016/j.jvoice.2009.09.005 [DOI] [PMC free article] [PubMed] [Google Scholar]
- Goodyer E., Muller F., Bramer B., Chauhan D., and Hess M., “In vivo measurement of the elastic properties of the human vocal fold,” Eur. Arch. Otorhinolaryngol. 263, 455–462 (2006). 10.1007/s00405-005-1034-y [DOI] [PubMed] [Google Scholar]
- Berry D., Montequin D., and Tayama N., “High-speed digital imaging of the medial surface of the vocal folds,” J. Acoust. Soc. Am. 110, 2539–2547 (2001). 10.1121/1.1408947 [DOI] [PubMed] [Google Scholar]
- Döllinger M., Berry D., and Berke G., “A quantitative study of the medial surface dynamics of an in vivo canine vocal fold during phonation,” Laryngoscope 115, 1646–1654 (2005). 10.1097/01.mlg.0000175068.25914.61 [DOI] [PubMed] [Google Scholar]
- Zhao W., Zhang C., Frankel S., and Mongeau L., “Computational aeroacoustics of phonation, part I: Computational methods and sound generation mechanisms,” J. Acoust. Soc. Am. 112, 2134–2146 (2002). 10.1121/1.1506693 [DOI] [PubMed] [Google Scholar]
- Decker G. and Thomson S., “Computational simulations of vocal fold vibration: Bernoulli versus Navier-Stokes,” J. Voice 21, 273–284 (2007). 10.1016/j.jvoice.2005.12.002 [DOI] [PubMed] [Google Scholar]
- Alipour F. and Scherer R. C., “Flow separation in a computational oscillating vocal fold model,” J. Acoust. Soc. Am. 116, 1710–1719 (2004). 10.1121/1.1779274 [DOI] [PubMed] [Google Scholar]
- Zhang Z., “Influence of flow separation location on phonation onset,” J. Acoust. Soc. Am. 124, 1689–1694 (2008). 10.1121/1.2957938 [DOI] [PMC free article] [PubMed] [Google Scholar]
- Sciamarella D. and Le Quéré P., “Solving for unsteady airflow in a glottal model with immersed moving boundaries,” Eur. J. Mech. B/Fluids 27, 42–53 (2008). 10.1016/j.euromechflu.2007.06.004 [DOI] [Google Scholar]
- Kucinschi B., Scherer R., DeWitt K., and Ng T., “Flow visualization and acoustic consequences of the air moving through a static model of the human larynx,” J. Biomech. Eng. 128, 380–390 (2006). 10.1115/1.2187042 [DOI] [PubMed] [Google Scholar]
- Berke G., Moore D., Monkewitz P., Hanson D., and Gerratt B., “A preliminary study of particle velocity during phonation in an in vivo canine model,” J. Voice 3, 306–313 (1989). 10.1016/S0892-1997(89)80052-9 [DOI] [Google Scholar]
- Verneuil A., Berry D., Kreiman J., Gerratt B., Ming Y., and Berke G., “Modeling measured glottal volume velocity waveforms,” Ann. Otol. Rhinol. Laryngol. 112, 120–131 (2003). [DOI] [PubMed] [Google Scholar]
- Alipour F. and Scherer R., “Pulsatile airflow during phonation: An excised larynx model,” J. Acoust. Soc. Am. 97, 1241–1248 (1995). 10.1121/1.412233 [DOI] [PubMed] [Google Scholar]
- Khosla S., Muruguppan S., Gutmark E., and Scherer R., “Vortical flow field during phonation in an excised canine larynx model,” Ann. Otol. Rhinol. Laryngol. 116, 217–228 (2007). [DOI] [PMC free article] [PubMed] [Google Scholar]
- Morel T., “Comprehensive design of axisymmetric wind tunnel contractions,” J. Fluids Eng. 97, 225–233 (1975). 10.1115/1.3447255 [DOI] [Google Scholar]
- Mehta R., “Turbulent boundary layer perturbed by a screen,” AIAA J. 23, 1335–1342 (1985). 10.2514/3.9089 [DOI] [Google Scholar]
- Golla M., Deliyski D., Orlikoff R., and Moukalled H., “Objective comparison of the electroglottogram to synchronous high-speed images of vocal-fold contact during vibration,” in Proceedings of the 6th International Workshop on Models and Analysis of Vocal Emissions for Biomedical Applications MAVEBA, edited by Manfredi C. (2009), Vol. 6, pp. 141–144.
- Chein R. and Chung J., “Simulation of particle dispersion in a two dimensional mixing layer,” AIChE J. 34, 946–954 (1988). 10.1002/aic.690340607 [DOI] [Google Scholar]
- Crowe C., Chung J., and Troutt T., “Particle mixing in free shear flows,” Prog. Energy Combust. Sci. 14, 171–194 (1988). 10.1016/0360-1285(88)90008-1 [DOI] [Google Scholar]
- Granqvist S., Hertegård S., Larsson H., and Sundberg J., “Simultaneous analysis of vocal fold vibration and transglottal airflow: Exploring a new experimental setup,” J. Voice 17, 319–330 (2003). 10.1067/S0892-1997(03)00070-5 [DOI] [PubMed] [Google Scholar]
- Adrian R., Christensen K., and Liu Z.-C., “Analysis and interpretation of instantaneous turbulent velocity fields.” Exp. Fluids 29, 275–290 (2000). 10.1007/s003489900087 [DOI] [Google Scholar]
- Van Dyke M., An Album of Fluid Motion (The Parabolic Press, Stanford, CA, 1982), pp. 24–59. [Google Scholar]
- Gutmark E. and Ho C., “Preferred modes and the spreading rates of jets,” Phys. Fluids 26, 2932–2938 (1983). 10.1063/1.864058 [DOI] [Google Scholar]
- Stevens K., Acoustic Phonetics (MIT Press, Cambridge, MA, 1998), Chaps. 1–3, pp. 1–202. [Google Scholar]
- Scherer R. C., Torkaman S., Kucinschi B. R., and Afjeh A. A., “Intraglottal pressures in a three-dimensional model with a non-rectangular glottal shape,” J. Acoust. Soc. Am. 128, 828–838 (2010). 10.1121/1.3455838 [DOI] [PMC free article] [PubMed] [Google Scholar]
- Muijres F., Johansson L., Barfield R., Wolf M., Spedding G., and Hedenström A., “Leading-edge vortex improves lift in slow-flying bats,” Science 319, 1250–1253 (2008). 10.1126/science.1153019 [DOI] [PubMed] [Google Scholar]
- Barney A., Shadle C. H., and Davies P., “Fluid flow in a dynamic mechanical model of the vocal folds and tract. I. Measurements and theory,” J. Acoust. Soc. Am. 105, 444–455 (1999). 10.1121/1.424504 [DOI] [Google Scholar]


