Abstract
The vowel space area (VSA) has been studied as a quantitative index of intelligibility to the extent it captures articulatory working space and reductions therein. The majority of such studies have been empirical wherein measures of VSA are correlated with perceptual measures of intelligibility. However, the literature contains minimal mathematical analysis of the properties of this metric. This paper further develops the theoretical underpinnings of this metric by presenting a detailed analysis of the statistical properties of the VSA and characterizing its distribution through the moment generating function. The theoretical analysis is confirmed by a series of experiments where empirically estimated and theoretically predicted statistics of this function are compared. The results show that on the Hillenbrand and TIMIT data, the theoretically predicted values of the higher-order statistics of the VSA match very well with the empirical estimates of the same.
INTRODUCTION
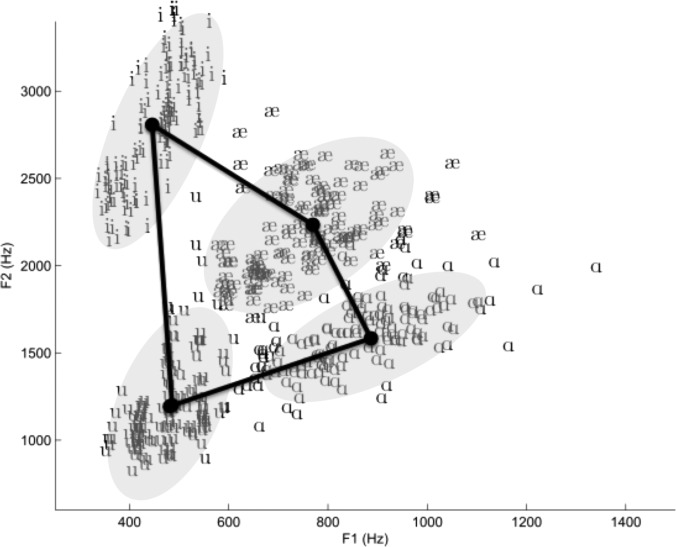
The vowel space area (VSA), defined as the area of the quadrilateral formed by the four corner vowels when projected on the first two formant frequencies (F1 and F2), is often used to characterize speech motor control.1, 2, 3, 4, 5, 6, 7 Frequencies of the first and second formants roughly relate to the size and shape of the cavities created by jaw opening (F1) and tongue position (F2). As such, VSAs are acoustic proxy for the kinematic displacements of the articulators. Figure 1 shows a sample quadrilateral that forms the VSA for a group of individuals. In particular, the figure demonstrates the distribution of the first two formant frequencies for the four corner vowels that define the area of the vowel space (data from Hillenbrand8). The area (in Hz2) of the shape defined by these vowels serves as a quantitative measure of articulatory displacement for this group of speakers. This metric is interpreted as a measure of articulatory excursions and separability between distinct acoustic-articulatory vowel targets. This interpretation makes the VSA an attractive metric for characterizing speech motor control, including speech development,1, 2 speech disorders,3, 4 speech interventions,5 dialects,6 and speaking styles.7
Figure 1.
The distribution of the first two formant frequencies for the four corner vowels that define the area of the vowel space. The mean of each distribution serves as an edge for the vowel space quadrilateral.
A fundamental issue often unaccounted for in existing VSA studies is that vowel acoustics and the associated articulatory kinematics in connected speech are non-deterministic. This is largely the result of anticipatory and carry-over coarticulation, which directly influence vowel formant frequencies. Further, speaking effort (clear versus conversational), speaking rate, regional dialects, idiosyncratic speaking styles, and VSAs computed for groups of individuals (as in Fig. 1) also contribute to the stochastic nature of vowel acoustics and production. None of the commonly used methods for estimating VSA accommodates this fact. Indeed, the /hVd/ context commonly used for generating vowel samples for VSA estimation is designed to reduce the effects of coarticulation on vowel formant values. This results in incomplete characterizations of the VSA that focus on average values of the area formed by /hVd/ stimuli. It is hypothesized that to fully understand its utility as a measure of articulatory excursion (and intelligibility, by proxy), the VSA must be characterized stochastically through statistics that more completely describe the underlying distribution of the area.
Here the main contribution is to extend the mathematical analysis of the VSA by treating it as a random variable and characterizing its full distribution rather than only its average. It is important to note that the aim of this work is not to confirm or refute the utility of this metric as a measure of intelligibility. Rather, under reasonable assumptions on the distribution of the formant frequencies for the four corner vowels, the distribution of the vowel area is characterized by defining a closed-form expression for its moment generating function. From this, expressions for a series of higher-order statistics (variance, skewness, kurtosis, etc.) are derived, and their accuracy is confirmed using numerical experiments. The newly derived expressions can be used by researchers in the field to more completely characterize the vowel area in future studies and to study the relationship between intelligibility (or other measures of articulator displacement) and this new characterization. In addition, from the calculated statistics (the variance in particular), confidence intervals can be computed for the area, which allow for a more accurate comparison of differences in VSA between individuals.
There are two principal contributions in this study. First, a mathematical analysis of the VSA yields a closed-form expression for its moment generating function and, as a result, all of its moments. Second, the formulae are validated through a series of numerical experiments on two speech databases.8, 9 The speech in the databases is processed and formants extracted for each of the corner vowels. From this, values of the sample mean, variance, skewness, and kurtosis are compared against the derived mathematical expressions of the same.
METHODS
The main theoretical result of this paper is a closed form mathematical expression for the moment generating function of the area of a quadrilateral that defines a person's vowel space. Before stating the main result, the notation is defined, a new form for the area of an arbitrary quadrilateral is derived, and necessary assumptions are outlined.
Notation
In the rest of this paper, a random variable is notated by a capital letter (e.g., F1). A specific draw from a random variable is notated by a lowercase letter (f1). Operations on random variables result in new random variables (e.g., for , is a new random variable). Vectors and matrices are notated by lowercase and uppercase, boldface variables, respectively (e.g., , ). Indexing on vectors and matrices is notated by a parenthetic superscript index (e.g., , ).
To write the area of the quadrilateral in Fig. 1 in closed form, a series of random variables must be defined. Let , , , and denote the formant pairs (and their respective distributions) for each of the four vowels shown in Fig. 1. The following auxiliary random variables and distributions are required for the analysis in ensuing sections:
where , , , , , , , and . Because it is assumed that each formant pair for the corner vowels is drawn from a jointly Gaussian distribution, the distributions of result directly from the fact that the difference of Gaussian random variables is also Gaussian.9
The area of a non-crossing quadrilateral
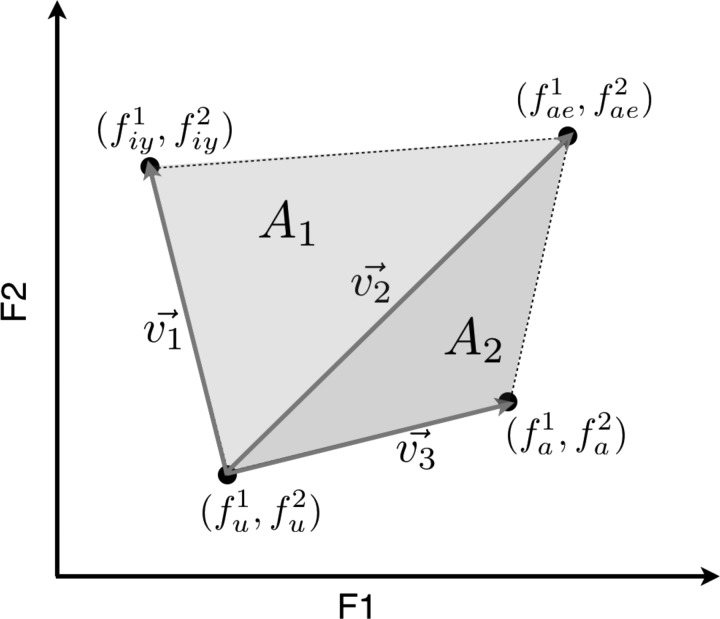
In Fig. 2, we show an arbitrary, non-crossing quadrilateral with endpoints drawn from the distributions (, ), (, ), (, ), and (, ) previously defined. The area of this quadrilateral can be split into two triangular regions with areas A1 and A2, as shown in the figure. We define the vectors , , and from the endpoints of the quadrilateral as follows:
| (1) |
| (2) |
| (3) |
Using vector notation, the areas of the two triangles are
| (4) |
| (5) |
The total area of the quadrilateral is
| (6) |
Under the assumption that the quadrilateral is non-crossing, the quantities defined inside the vector norm are positive. As a result, the norms are removed, each vector replaced by the definitions in Eqs. 1 to 3, and the expression is simplified. The resulting area of a quadrilateral the vertices of which are the four points in Fig. 2 is given by
where are defined in the previous section.
Figure 2.
A notional quadrilateral formed from one instance of each of the four corner vowels. The quadrilateral vowel space area, A, can be decomposed into the areas of two triangles, A1 and A2.
Assumptions
The goal of the rest of the paper is to completely characterize the distribution of A. Two key assumptions are made in this analysis: (1) The distribution of the formant values can be modeled by a jointly Normal distribution and (2) The random variable pairs , , and are independent.
Single Gaussian models and Gaussian mixture models have been used to successfully model formant distributions in the literature.11, 12 These distributions have been used in forensic speech analysis and have proved to be an adequate representation in that field. In the results, this is confirmed in the present application by comparing theoretical values of higher-order statistics with those empirically estimated from the same data set. The results show that the closed-form statistics derived using the Gaussian assumption match well with the empirical estimates of the same values.
To confirm the validity of the independence assumption, it is shown that the random variable pairs have low correlation coefficients. In general, random variables can be uncorrelated but dependent; however, for jointly Gaussian random variables, the components that are uncorrelated are independent. The independence assumption is empirically confirmed using data from the phonetically segmented TIMIT database.9 TIMIT contains speech from 630 speakers from eight dialect regions. For each dialect region, formant pairs for each of the corner vowels are extracted and the correlation coefficient between the three pairs of random variables is calculated. The values are shown in Table TABLE I.. Details on how the formants were extracted can be found in Sec. 3. As the table shows, the correlation coefficient between the random variable pairs is low. For multivariate, normally distributed data, any two or more of its components that are uncorrelated are also independent. As such, the low values of the correlation coefficient, combined with the assumption of joint normality, implies the independence assumption is reasonable for the first two variable pairs in this representative data set. The correlation coefficient of the third variable pair is larger (and not normally distributed); however, in Sec. 3, it is demonstrated that closed-form statistics are still able to follow empirical estimates of the same.
TABLE I.
Correlation coefficients for random variable pairs.
| RV pairs | Correlation coefficients |
|---|---|
| −0.0020 | |
| −0.0028 | |
| 0.1327 |
Analytic expression for the moment generating function of the vowel space area
The main theoretical result of this paper is a closed form expression for the moment generating function of A, denoted by . From this, the central and non-central moments of the area are derived. From the preceding information, the area of the non-crossing quadrilateral is given by
| (7) |
If we denote , , and , then the moment generating function of Z, , is given by
| (8) |
| (9) |
The integral in Eq. 9 can be solved in closed form, and the resulting MGF of Z is
| (10) |
The closed form solution to the integral in Eq. 9 is derived in the Appendix.
Using the intermediate result in Eq. 10, the MGF of the area in Eq. 7 can be derived. The moment generating function of A is
| (11) |
| (12) |
| (13) |
where the expectations are split because of the independence assumption. Substituting the intermediate result of Eq. 10 in Eq. 13 and simplifying, yields the moment generating function of the area, :
| (14) |
In the literature, oftentimes, only the average vowel space area is calculated empirically from the formant measurements. The closed form expression of the MGF, MA(s), allows us to derive expressions for other statistics. The non-central moments can be calculated directly from the moment generating function. To calculate the nth moment of the area, we use
| (15) |
Using Eq. 15, expressions for the central moments are calculated, using the definitions in Papoulis.10 In particular, the mean, , and variance, , of the distribution of the area are given by
| (16) |
| (17) |
The closed-form expressions for the higher-order statistics (e.g., skewness and kurtosis) calculated using Eq. 15 are omitted from the paper because of space constraints; however, it is shown in the next section that these expressions match well with empirical estimates of the same values.
NUMERICAL RESULTS AND DISCUSSION
The validity of the derived results are confirmed by comparing the theoretical, closed-form vowel space area statistics against empirical estimates of the same on two data sets—the Hillenbrand8 data and the TIMIT9 data.
Hillenbrand data
The Hillenbrand data are used to assess the validity of the newly derived analytic expressions. In the Hillenbrand study, speech samples were collected from speakers consisting of 45 men, 48 women, and 46 ten- to 12-yr-olds (27 boys, 19 girls). Eighty-seven percent of speakers were raised in Michigan's lower peninsula, primarily in the southeastern and southwestern parts of the state. After a screening process, audio recordings were taken of the 12 English vowels in /hVd/ syllables, then low-pass filtered at 7.2 kHz, and digitized at 16 kHz. Measurements were made of vowel duration, F0 contour, and formant frequency contours for all of the 1668 utterances. Vowel start and end times were obtained by hand using high resolution spectrographs by two experimenters. Formant frequencies were obtained by calculation of 14-pole, 128-point linear predictive coding (LPC) spectra with 16 ms (256-point) hamming windowed frames. Spectral peaks were estimated using three-point parabolic interpolation of the LPC spectrum. F0 contours were extracted using an autocorrelation pitch tracker.
For each of the four corner vowels in the Hillenbrand data set,8 a bivariate Gaussian distribution is fit to the first and second formant. The covariance ellipse associated with these distributions is shown in Fig. 1. In an effort to evaluate the derived statistics on a number of underlying distributions, a scaling coefficient, α, is introduced to generate new distributions by modifying those learned from the Hillenbrand data. This parameter helps generate a set of underlying distributions with varying mean and variance to validate the expressions for statistics derived by Eq. 15. This is done by scaling the mean vector and covariance matrix of each corner vowel by . For each value of α, 100 000 sets of four corner vowels are drawn from the resulting distribution, and the VSA for each set is empirically calculated.
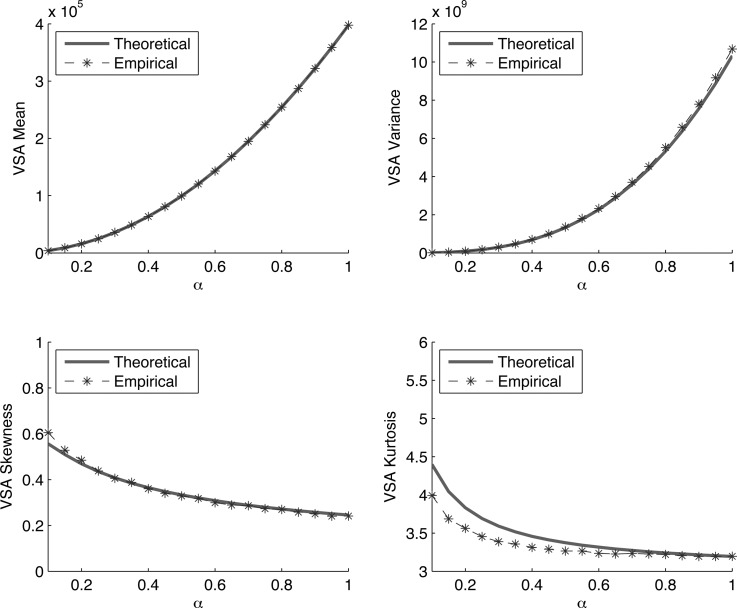
The theoretical values of the same parameters are calculated by making use of Eq. 15 and the formulas for the sample skewness and kurtosis in Papoulis.10 The results are overlaid in Fig. 3. As is apparent from the figure, there is very good agreement between the empirical and theoretical estimates. As the order of the statistic increases, the agreement between the theoretical and empirical estimates decreases (in particular the kurtosis estimate). The principal reason for this is that the non-zero correlation between and (see Table TABLE I.) becomes more important for the higher-order terms, resulting in a slight difference between the empirical and theoretical estimates of kurtosis. Nonetheless the theoretical estimates capture the general trend in the data even for the kurtosis, where the agreement is not exact.
Figure 3.
Empirical and theoretical estimates of the vowel space area mean (top left), variance (top right), skewness (bottom left), and kurtosis (bottom right) computed for the distributions learned from the Hillenbrand (Ref. 8) data.
TIMIT data
In addition to the academic example using the Hillenbrand data, the validity of the theoretical estimates are further assessed on the TIMIT data set.9 For each dialect region (DR) in TIMIT, all instances of the corner vowels are extracted using the meta-information in TIMIT, which provides phonetic segmentation. A praat (Ref. 13) script is used to automatically extract the first and second formant at the midpoint of each vowel instantiation. The praat formant extraction algorithm works by resampling the speech signal to a frequency of twice the maximum formant frequency (a user-defined parameter in the algorithm). Follow this, a pre-emphasis filter is applied, the signal is windowed with a Gaussian window, and the LPC spectrum is estimated. The peaks in the result spectrum are used as estimates of the formant frequency.
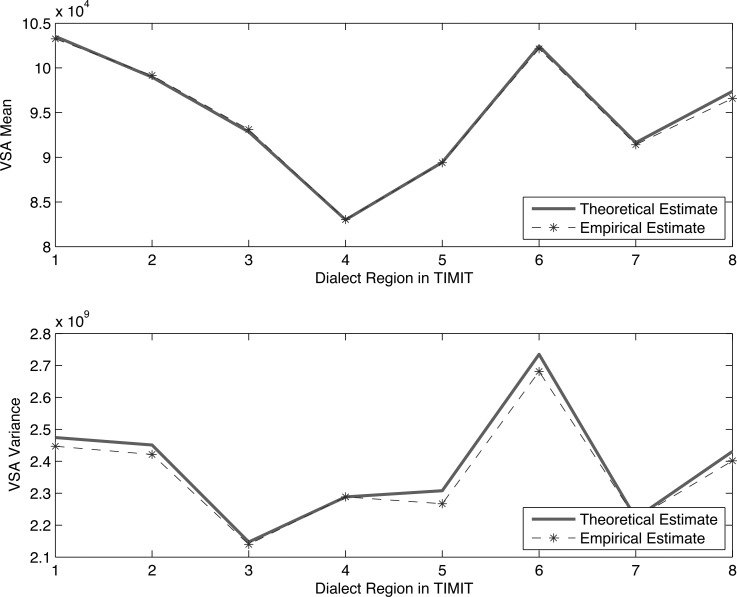
The resulting formants are filtered such that only those within 3σ of each formant's mean are kept. The 3σ threshold was determined by visually inspecting the formants to ensure that outliers arising from visually obvious errors in the formant extraction algorithm were removed. For those that remain, the vowel space area for each set of four corner vowels is empirically estimated, followed by the mean and variance of the VSA. The theoretical values of the same parameters are calculated using Eqs. 16, 17. The comparative results are shown in Fig. 4. As the figure shows, there is very good agreement between the empirical and the theoretical results, further confirming the validity of the derived results.
Figure 4.
Empirical and theoretical estimates of the vowel space area mean (top figure) and variance (bottom figure) computed for each dialect region in the TIMIT (Ref. 12) database.
Figure 4 provides further motivation for extending the analysis of the VSA to beyond the mean. As an example, consider the VSA of DR 6. The mean VSA for this dialect is comparatively high. In fact, in a ranking of the eight dialect regions by mean VSA, DR 6 has the second largest vowel area (behind DR 1). Of course, the mean estimate fails to capture the variation in the VSA of DR 6. Analyzing the VSA variance of DR 6, it is noted that it contains significantly more variation than the other dialect regions. With this additional statistic, ranking can be calculated using the inverse of the coefficient of variation —a statistic that takes into consideration both the mean and variance of the VSA. Qualitatively, this statistic makes sense because it positively weights a large vowel space area but penalizes dialect regions with large variance in the VSA. This ranking is different and uses a metric that provides a more complete characterization of the VSA. Beyond ranking, from the closed form variance expression, confidence intervals can be computed for the area, which allow for a more accurate comparison of differences in VSA between individuals/groups.
CONCLUSION
The distribution of the vowel space area is characterized under reasonable assumptions. From this, expressions are derived for a series of higher-order statistics, and their accuracy is confirmed using numerical experiments. The newly derived expressions can be used by researchers in the field to better characterize the robustness of the vowel area estimates by measuring not only its mean, but its variance, and potentially third- or fourth-order statistics like skewness and kurtosis. This provides a multi-dimensional, statistical representation of the VSA and, like the mean, these additional quantities (and their combinations) can be correlated against intelligibility to assess their predictive power. The higher-order statistics capture information about the shape of the distribution of the VSA by modeling the articulatory kinematics in a non-deterministic manner. In addition, a closed form expression for the variance means that we can define confidence intervals for the computed area and allows us to more accurately compare differences in VSA between individuals. Future work involves assessing the newly derived statistics on pathological speech to compare the additional information provided against intelligibility. Additionally, relaxing the independence assumption could be considered in an effort to yield even more accurate estimates of the higher-order statistics.
ACKNOWLEDGMENTS
This research was supported in part by National Institute of Health, National Institute on Deafness and Other Communicative Disorders Grant Nos. 2R01DC006859 (J.L.) and 1R21DC012558 (J.L. and V.B.).
APPENDIX: THE MGF OF THE PRODUCT OF TWO GAUSSIANS
Let , , and . The moment generating function of Z, , is given by
Proof
Craig14 and Ware15 analyze the product of Gaussian random variables. The current problem is set up in similar fashion. Using the definition of the moment generating function,
| (A1) |
| (A2) |
| (A3) |
It is noted that that the quantity in the parenthesis is , the MGF of evaluated at ,
| (A4) |
The quadratic polynomial in the exponent is expanded (w.r.t. ) and like terms are combined. Letting and , the square in the exponent is completed by adding and subtracting from the exponent to obtain
| (A5) |
| (A6) |
| (A7) |
| (A8) |
Going from Eq. A7 to A8, it is seen that the integrand as , therefore integrating over ℝ equals 1. Substituting for a and b and simplifying, the final MGF is obtained,
| (A9) |
References
- Flipsen P. and Lee S., “Reference data for the American English acoustic vowel space,” Clin. Linguist. Phonet. 26(11–12), 926–933 (2012). 10.3109/02699206.2012.720634 [DOI] [PubMed] [Google Scholar]
- Vorperian H. K. and Kent R. D., “Vowel acoustic space development in children: A synthesis of acoustic and anatomic data,” J. Speech, Lang. Hear. Res. 50(6), 1510–1545 (2007). 10.1044/1092-4388(2007/104) [DOI] [PMC free article] [PubMed] [Google Scholar]
- Skodda S., Grönheit W., and Schlegel U., “Impairment of vowel articulation as a possible marker of disease progression in Parkinson's disease,” PLoS One 7(2), e32132 (2012). 10.1371/journal.pone.0032132 [DOI] [PMC free article] [PubMed] [Google Scholar]
- Leonard L. B., Ellis Weismer S., Miller C. A., Francis D. J., Tomblin J. B., and Kail R. V., “Speed of processing, working memory, and language impairment in children,” J. Speech, Lang. Hear. Res. 50(2), 408–428 (2007). 10.1044/1092-4388(2007/029) [DOI] [PubMed] [Google Scholar]
- Sapir S., Ramig L. O., Spielman J. L., and Fox C., “Formant centralization ratio: A proposal for a new acoustic measure of dysarthric speech,” J. Speech, Lang. Hear. Res. 53(1), 114–125 (2010). 10.1044/1092-4388(2009/08-0184) [DOI] [PMC free article] [PubMed] [Google Scholar]
- Jacewicz E. and Fox R. A., “Dialectal and age-related acoustic variation in vowels in spontaneous speech,” J. Acoust. Soc. Am. 132(3), 2002 (2012). 10.1121/1.4755410 [DOI] [Google Scholar]
- Lam J., Tjaden K., and Wilding G., “Acoustics of clear speech: Effect of instruction,” J. Speech, Lang. Hear. Res. 55(6), 1807–1821 (2012). 10.1044/1092-4388(2012/11-0154) [DOI] [PMC free article] [PubMed] [Google Scholar]
- Hillenbrand J., Getty L. A., Clark M. J., and Wheeler K., “Acoustic characteristics of American English vowels,” J. Acoust. Soc. Am. 97(5), 3099–3111 (1995). 10.1121/1.411872 [DOI] [PubMed] [Google Scholar]
- Garofolo J. S., Lamel L. F., Fisher W. M., Fiscus J. G., Pallett D. S. and Dahlgren N. L., “DARPA TIMIT acoustic phonetic continuous speech corpus,” CDROM, 1993.
- Papoulis A. and Pillai S. U., Probability, Random Variables and Stochastic Processes (McGraw-Hill, New York, 2002), 852 p. [Google Scholar]
- Becker T., Jessen M., and Grigoras C., “Forensic speaker verification using formant features and Gaussian mixture models,” in Proceedings of Interspeech, Brisbane, Australia, 2008, pp. 1505–1508.
- Moos A., “Long-term formant distribution,” Master’s thesis, Universitat des Saarlandes, Saarbrcken, Germany, 2008, 92 pp. [Google Scholar]
- Boersma P., “praat, a system for doing phonetics by computer,” Glot Int. 5(9/10), 341–345 (2001). [Google Scholar]
- Craig C. C., “On the frequency function of xy,” Ann. Math. Stat. 7(1), 1–15 (1936). 10.1214/aoms/1177732541 [DOI] [Google Scholar]
- Ware R. and Lad F., “Approximating the distribution for sums of products of normal variables,” Technical Report UCDMS 2003/15, University of Canterbury (2003).


