Abstract
Purpose: Given the radiation concerns inherent to the x-ray modalities, accurately estimating the radiation doses that patients receive during different imaging modalities is crucial. This study estimated organ doses, effective doses, and risk indices for the three clinical chest x-ray imaging techniques (chest radiography, tomosynthesis, and CT) using 59 anatomically variable voxelized phantoms and Monte Carlo simulation methods.
Methods: A total of 59 computational anthropomorphic male and female extended cardiac-torso (XCAT) adult phantoms were used in this study. Organ doses and effective doses were estimated for a clinical radiography system with the capability of conducting chest radiography and tomosynthesis (Definium 8000, VolumeRAD, GE Healthcare) and a clinical CT system (LightSpeed VCT, GE Healthcare). A Monte Carlo dose simulation program (PENELOPE, version 2006, Universitat de Barcelona, Spain) was used to mimic these two clinical systems. The Duke University (Durham, NC) technique charts were used to determine the clinical techniques for the radiographic modalities. An exponential relationship between CTDIvol and patient diameter was used to determine the absolute dose values for CT. The simulations of the two clinical systems compute organ and tissue doses, which were then used to calculate effective dose and risk index. The calculation of the two dose metrics used the tissue weighting factors from ICRP Publication 103 and BEIR VII report.
Results: The average effective dose of the chest posteroanterior examination was found to be 0.04 mSv, which was 1.3% that of the chest CT examination. The average effective dose of the chest tomosynthesis examination was found to be about ten times that of the chest posteroanterior examination and about 12% that of the chest CT examination. With increasing patient average chest diameter, both the effective dose and risk index for CT increased considerably in an exponential fashion, while these two dose metrics only increased slightly for radiographic modalities and for chest tomosynthesis. Effective and organ doses normalized to mAs all illustrated an exponential decrease with increasing patient size. As a surface organ, breast doses had less correlation with body size than that of lungs or liver.
Conclusions: Patient body size has a much greater impact on radiation dose of chest CT examinations than chest radiography and tomosynthesis. The size of a patient should be considered when choosing the best thoracic imaging modality.
Keywords: chest CT, chest radiography, chest tomosynthesis, chest X-ray imaging, radiation dose, CT dose, organ dose, effective dose, dose comparison, risk index, Monte Carlo, computational phantom, XCAT
INTRODUCTION
There are three main x-ray based modalities for imaging the thorax: radiography, tomosynthesis, and CT. Chest radiography remains the most commonly performed diagnostic imaging test overall, especially for the diagnosis of many pulmonary diseases.1 The advantages of chest radiography include high accessibility, low cost, and minimal radiation dose to lungs and breasts. However, the detectability of pathologies in radiography is very limited by quantum noise, spatial resolution, and overlaying projected anatomy.1 The introduction of computed tomography (CT) in the 1970s provided a great solution for limitations of overlaying anatomy, imaging the inner depth of the body slice by slice.2 The high level of feature resolution in CT brings with it much higher radiation exposure to the patient, which has increased concern about CT imaging among health care professionals.3, 4, 5 Tomosynthesis, which can also eliminate overlaying structures and provide depth information, was introduced to the medical imaging world as a possible low dose alternative to CT.6 It is certain that each of the three imaging modalities carries its own value and is beneficial to patients, but the benefit to radiation risk ratio should be well assessed before deciding on the appropriate modality to use. Therefore, it is important to have the ability to accurately estimate radiation doses that patients receive during these procedures to place them in perspective with diagnostic quality.
There are many radiation dose studies focused on a specific procedure7, 8, 9, 10, 11, 12, 13, 14, 15, 16, 17 as well as several studies comparing radiation doses between the three chest imaging modalities.18, 19 Both Sabol and Bath's study simulated the chest radiography and tomosynthesis using Monte Carlo method and one generic mathematical phantom. Sabol's study found that the total effective dose for tomosynthesis examination was less than 75% of that predicted by scaling of the posteroanterior chest radiograph to tomosynthesis mAs ratio. The same study also showed that the effective dose for tomosynthesis was about twice that of a conventional two-view chest x-ray examination and less than 2% of the published average values for chest CT.19 Bath's study found that the effective dose for tomosynthesis examination was around two to three times that of a conventional two-view chest x-ray examination and about 2% of an average chest CT.18 Both of these studies compared their results with published chest CT values, thus previous comparison studies across the three modalities have not been based on one common dosimetry platform.18, 19 Limited to one generic phantom, patient specific doses have not been previously compared.
This study fills this gap by estimating organ doses, effective doses, and risk indices for each of the three modalities. This study used a common Monte Carlo simulation platform to enable direct comparison of the results. Furthermore, this study was based on 59 voxelized phantoms emulating patient variability that exists in a clinical practice and thus providing means to use patient specific methods. As such, this study aimed to offer a patient specific comparison of the three modalities.
METHODS
Patients and extended cardiac-torso (XCAT) computational phantoms
A total of 59 adult patients (35 male and 24 female) were studied. With IRB approval, 57 of these patients were chosen from the Duke CT database; an additional two were based on the Visible Human anatomical data, created as reference phantoms matched to ICRP publication 89 anatomical values.
Each of the 57 computational phantoms were created based on a four step process.20 First, high resolution chest-abdomen-pelvis CT data were chosen retrospectively to represent a wide range of body types and ages of adult males and females. Subject BMIs ranged from 19.2 to 36.1 kg/m2 with an average of 27.0 kg/m2 for males and from 18.2 to 36.7 kg/m2 with an average of 27.4 kg/m2 for females; the ages ranged from 18 to 78 for males and from 27 to 75 for females. The mean BMI for all patients in this study was 27.2 kg/m2. An experienced radiologist examined the CT data to ensure that their anatomies were normal. The CT data were then segmented semimanually by in-house software ImageSegment (RAI Laboratories, Duke University, Durham, NC) on a tablet computer.
Second, the obtained segmentation data for chest-abdomen-pelvis were imported to processing software (Rhinoceros, www.rhino3d.com) to build 3D NURBS models. In the software, the surfaces of segmented organs were smoothed and fit to 3D polygon mesh surfaces. After the trunk was built, the arm and leg measurements, including their skin circumferences and arm length, were determined by the PeopleSize software (http://www.openerg.com/psz/index.html). The length of legs was determined according to a linear relationship between trunk height and body height. The arms and legs were then attached to the trunk with the Rhinoceros software.
Third, the multichannel large deformation diffeomorphic metric mapping (MC-LDDMM) was applied to obtain the patient's framework (the outline of patients).21 Lastly, the transformed phantom was finalized by an experienced observer visually examining the anatomy. The criterions for accepting the finalized phantom included examinations of organ volumes and total body weight. Through voxelizing the phantom and counting the voxels, the organ volumes were determined, which were then evaluated to be within the ranges given in the ICRP Publication 89 and expected from patients’ heights.21, 22 Organ weights were determined by multiplying the obtained volumes with the corresponding tissue densities, based on NIST data (http://physics.nist.gov/PhysRefData/XrayMassCoef/tab2.html). The total body weight was thereafter calculated and adjusted finely to match the patient's original weight within 1%, achieved by scaling the skin surface of the phantom's arms and legs.
The two reference phantoms, one male and one female, were built through the same process except that their organ weights were adjusted to match the reference values from ICRP Publication 89. They were also assumed to be 20-year-old adults. Thus, these two phantoms were named reference phantoms in the XCAT phantom library.21, 23
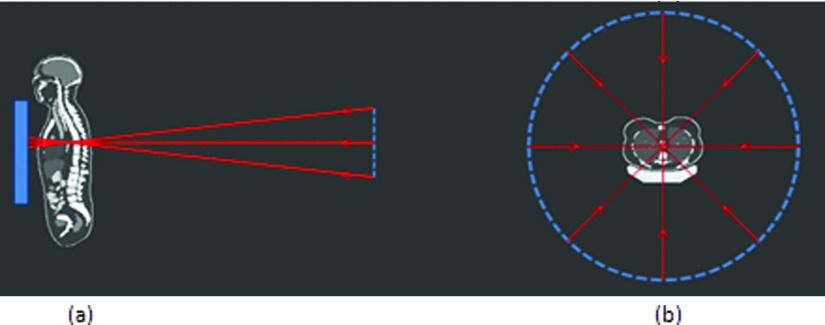
To implement the Monte Carlo simulation, the 59 phantoms were isotropically voxelized with 3.45 mm voxels. For the CT simulation, patients were “positioned” on a table to mimic the real clinical setting [Fig. 1b].
Figure 1.
Schematic illustration of the tomosynthesis acquisition geometry (a) and the CT acquisition geometry (b).
Organ dose simulation
The Monte Carlo simulation software PENELOPE (version 2006, Universitat de Barcelona, Spain) was used to calculate the organ dose for all modalities, and energy deposition in organs and tissues was tallied for the dose computation. A total of 8 × 10⁷ histories were simulated for each examination to achieve relative errors of less than 1% for organs inside the field-of-view. The location of the x-ray source with respect to the phantom was according to each modality's configuration.
Chest x-ray radiography configuration
A clinical radiography system with the capability of conducting tomosynthesis (Definium 8000, GE Healthcare) was modeled. To be able to accurately calculate patient dose, the x-ray spectrum used in the simulation should be properly generated. In our study, the half-value-layer (HVL) was measured on a GE Definium 8000 machine using the real clinical settings for chest x-ray (120 kVp with 2 mm Al + 0.1 mm Cu filtration). The spectrum that yielded the exact same HVL, which was 7.0 mm Al for 120 kVp, was generated with xSpect software.24
Lateral field-of-view (FOV) was fixed, because the lateral field size does not affect the radiation dose when the body is completely irradiated in that direction. Therefore, the largest detector FOV (41 cm) was chosen for chest posteroanterior, anteroposterior, and tomosynthesis examinations and a 35 cm FOV for the left lateral. For obese patients laterally exceeding the FOV, the collimation was still fixed at the lateral dimension of the corresponding detector FOV. To determine the vertical collimation, the longitudinal locations of the apex and bottom of the lungs were first computed. Two 3 cm margins were added above the apex and below the bottom to approximate the clinical setting (Table 1). The x-ray source was located on the same plane as the central transaxial plane of the lungs.
Table 1.
Imaging techniques for all modalities. PA = posteroanterior, AP = anteroposterior, and LAT = lateral.
| Modalities |
||||||||||
|---|---|---|---|---|---|---|---|---|---|---|
| Examination |
PA and AP |
Left LAT |
Tomosynthesis |
CT |
||||||
| Thickness | Number of | mAs | Thickness | Number of | mAs | Thickness | Number of | mAs | ||
| (cm) | patients | (cm) | patients | (cm) | patients | |||||
| <21 | 5 | 1.7 | <30 | 1 | 3.1 | <21 | 5 | 15 | ||
| 21–24 | 26 | 2.1 | 30–33 | 9 | 3.8 | 21–24 | 26 | 19.2 | CTDIvol | |
| mAs or CTDIvol | ||||||||||
| 24–27 | 18 | 2.5 | 33–39 | 37 | 5.4 | 24–27 | 18 | 24 | = 0.061e0.15d | |
| >27 | 10 | 3.1 | >39 | 12 | 7.6 | >27 | 10 | 30 | ||
| Scan mode | … | … | … | Helical | ||||||
| Pitch | … | … | … | 1.375 | ||||||
| Beam collimation | … | … | … | 40 mm | ||||||
| Scan field-of-view | … | … | … | Large body | ||||||
| Tube voltage | 120 kVp | 120 kVp | 120 kVp | 120 kVp | ||||||
| Scan coverage | 3 cm margins above and below lungs | 1 cm margins | ||||||||
| above and | ||||||||||
| below lungs | ||||||||||
Tomosysthesis configuration
The radiographic system modeled in this study is enabled to conduct tomosynthesis sweeps by installing the VolumeRAD software. This software controls the x-ray tube head movement in the vertical direction and performs acquisitions to obtain tomosynthesis projections, shown in Fig. 1a. The extreme angles with respect to the horizontal direction were −15.3° and +15.2° with a pivot-point-to-image-distance of 9.9 cm. In a real clinical setting, 60 projections are taken during one sweep with the same vertical increment (a constant step size) between the extreme angles. The high number of projection angles is needed for reconstruction; for the dosimetry purpose of this study, 20 projection angles were used with the same vertical increment considering that the radiation dose difference between adjacent angles is extremely small. In this study, collimation of the beam remained the same for all angles. The effect of the unchanged collimations will be discussed later.
Radiographic and tomosynthesis techniques
The Monte Carlo program provides energy deposition per mAs. The mAs values for the chest posteroanterior, anteroposterior, and left lateral examinations were determined by the technique charts in use at Duke University, shown in Table 1. For tomosynthesis, the total mAs was ten times that of the corresponding posteroanterior mAs (recommended by the GE user manual for chest tomosynthesis). The total mAs was then divided by 60, the number of projection angles acquired clinically, and rounded down to the next lower mAs from the imaging system. This resulted in a lower total mAs (Table 1), which was divided by 20 for one projection in our simulation software.
CT system simulation and scan techniques
A Monte Carlo dose program previously developed in our laboratory, based on PENELOPE software, was used for chest CT dose calculation.25, 26 The Monte Carlo program modeled the different components of a 64-slice CT system (LightSpeed VCT, GE Healthcare). The HVL for this system was 7.5 mm Al at 120 kVp. The accuracy of the simulated dose was validated in a cylindrical phantom and two anthropomorphic phantoms for both axial and helical scanning modes. Simulations were found to agree with measurements within 1%–11% on average and 5%–17% maximum error.25
The Monte Carlo program calculates energy deposition to organs and tissues per unit CTDIvol values. The CTDIvol values for chest CT examinations on the GE VCT machine were studied in our group. It was found that CTDIvol followed an exponential relationship (Table 1) with the patient's diameter obtained from the scout images.27 This diameter, referred to here as average diameter, was calculated by measuring the anteroposterior and lateral thickness of the middle part of the trunk. The square root of the product of the two thicknesses was then taken.27
Effective dose and risk index calculation
Organ dose obtained from the Monte Carlo simulation was used to calculate the effective dose defined in ICRP publication 103.28 Since each phantom has only one type of gender reproductive organs, dose to gonads was approximated by dose to testes or ovaries; dose to prostate or uterus/cervix was used in the calculation of dose to remainder tissues. To estimate cancer risk, risk index was calculated as
where rT is the gender, age- and tissue specific risk coefficient (cases/100 000 exposed to 0.1 Gy) and HT is the equivalent dose to organ T.26 The tabulated lifetime attributable risk of cancer in BEIRVII report were used for the values of rT at discrete ages with linear interpolation for intermediate ages.29
Data analysis
To examine the effect of patient size on organ and effective dose and to make the results applicable to different imaging techniques, the effective dose per mAs (for chest posteroanterior, anteroposterior, left lateral, and tomosynthesis) or 100 mAs (for chest CT) was plotted against patient thickness or diameter respectively. Organ dose per mAs or 100 mAs was plotted against average chest diameter, with the thicknesses in the square root being the anteroposterior and lateral thickness through the beam center. Organ dose was plotted against one parameter for all modalities for easy comparisons. Chest posteroanterior and left lateral examinations were also combined for the plots of normalized organ dose to simulate the conventional two-view chest x-ray. A nonlinear regression analysis was performed to explore the relationship between organ or effective dose with body size.
RESULTS
Average organ dose and effective dose across imaging modalities
Figures 2a, 2b show the average organ dose and effective dose of the 59 patients from each modality. The average effective dose was calculated by averaging the 59 patients’ effective dose, obtained from the organ dose of each patient (Sec. 2C). The average lung dose for posteroanterior radiography examination was 0.12 mGy, about 11% of that for tomosynthesis (1.0 mGy) and 2% of that for CT (6.11 mGy). The average breast dose for posteroanterior examination was 0.03 mGy, about 11% of that for tomosynthesis (0.24 mGy) but only 0.5% of that for CT (5.8 mGy). The chest CT had the largest average effective dose of 3.2 mSv, while the chest posteroanterior examination had the smallest average effective dose of 0.039 mSv, which is 1.3% that of the chest CT. The average effective dose of the chest anteroposterior examination was around two times that of the chest posteroanterior examination; the average effective dose of the chest left lateral examination was around 2.5 times that of the chest posteroanterior examination. The chest tomosynthesis had the highest average effective dose among radiographic examinations, which was about nine times that of the chest posteroanterior examination but still only about 12% that of the chest CT. For all chest radiographic examinations, the coefficient of variation of the estimated effective dose ranged from 10% (posteroanterior examination) to 19% (left lateral examination), while for CT it is much higher at 35%.
Figure 2.
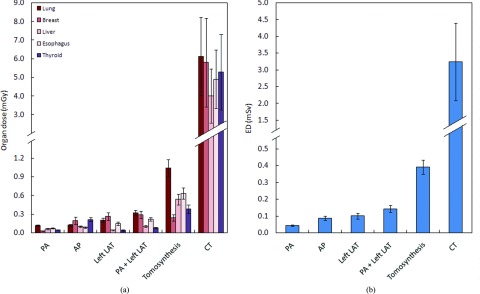
Average organ (a) and effective dose (b) across imaging modalities. The tomosynthesis dose excluded the dose from the scout image. ED = effective dose, PA = posteroanterior, AP = anteroposterior, and LAT = lateral.
Effect of patient size on radiation dose
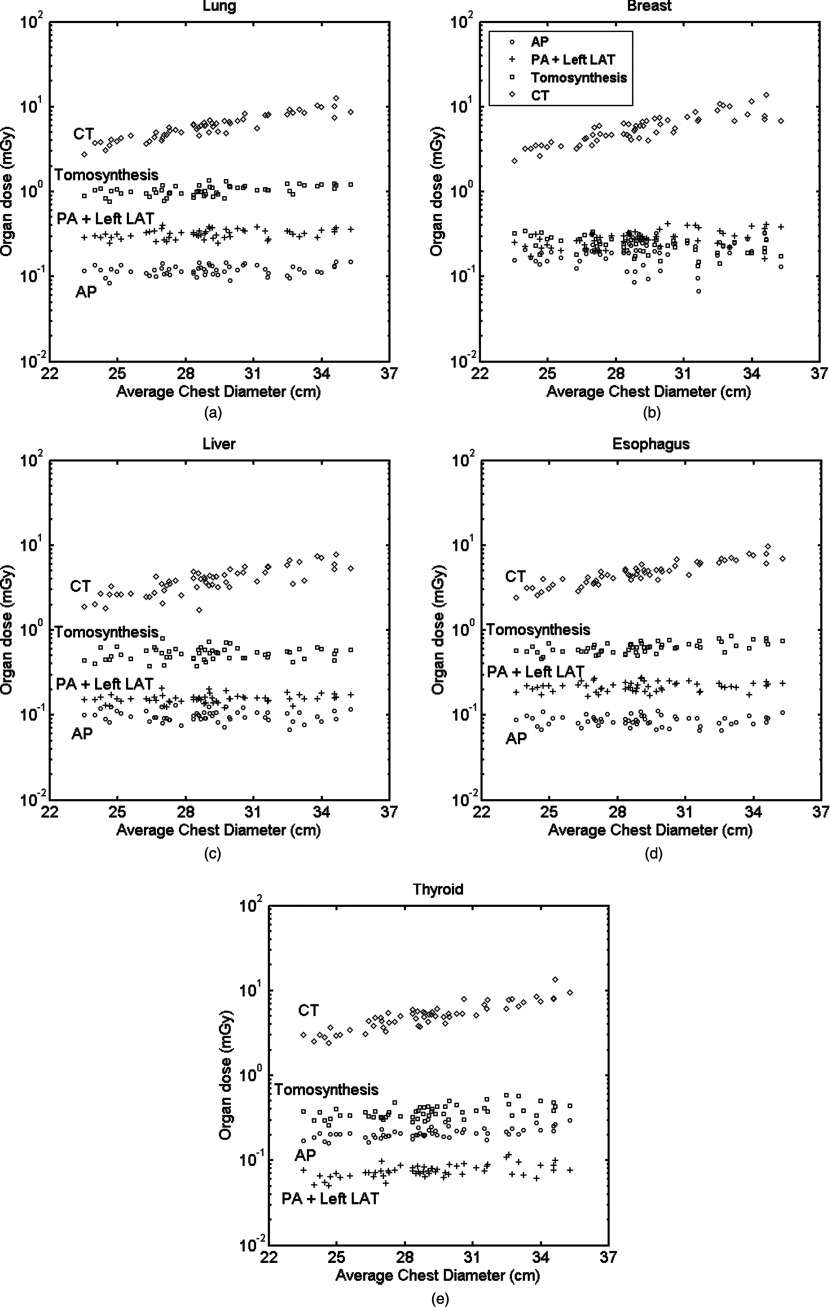
Figures 3a, 3b, 3c, 3d, 3e show the distribution of radiation dose to radiosensitive organs relevant to chest imaging. Results from the posteroanterior and left lateral study (PA + Left LAT) were combined in the plots to represent the conventional two-view chest x-ray. For CT, all the organ doses increased significantly with patient size in an exponential fashion. However, they remained comparatively flat for the radiographic modalities. In these radiographic modalities, while doses to lungs, liver, and esophagus for different modalities were distinguishable for individual patients, doses to breasts were overlapping for some patients.
Figure 3.
Distribution of organ dose with respect to patient size: (a) lung, (b) breast, (c) liver, (d) esophagus, and (e) thyroid. Average chest diameter is defined as the square root of the product of the anteroposterior and lateral thicknesses at the beam center. PA = posteroanterior, AP = anteroposterior, and LAT = lateral.
Figures 4a, 4b show the distribution of effective dose for all patients. Results from the posteroanterior and left lateral study (PA + Left LAT) were also combined. With increasing patient average chest diameter, the effective dose for CT increased considerably in an exponential fashion, while effective dose for radiographic modalities only increased slightly. The ratio of effective dose for chest CT versus tomosynthesis showed a significant slope as a function of chest diameter, while the same ratio for chest tomosynthesis versus the two-view chest x-ray remained rather flat.
Figure 4.
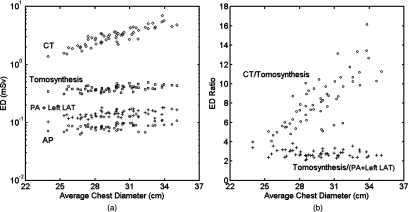
(a) Distribution of effective dose with respect to patient size for all modalities and (b) effective dose ratio of chest CT and tomosynthesis, and of chest tomosynthesis and conventional two-view chest x-ray. ED = effective dose, PA = posteroanterior, AP = anteroposterior, and LAT = lateral.
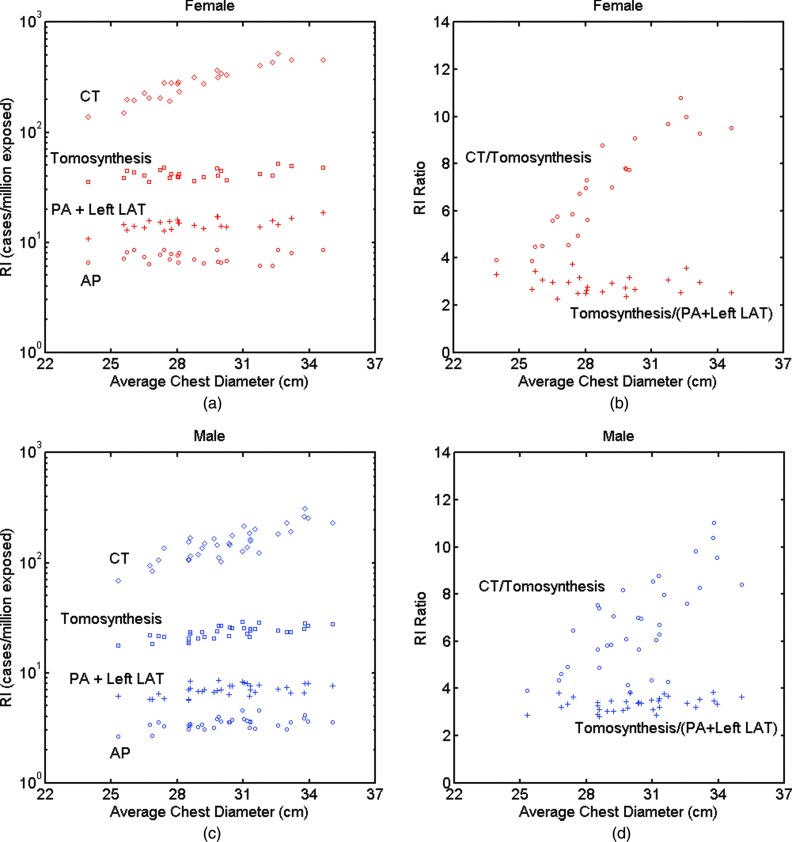
Figures 5a, 5b, 5c, 5d show the distribution of risk index for all patients. In the plots, all patients were set to 40 years old to eliminate the effect of age. Risk index values across the four modalities and the corresponding risk index ratio showed trends similar to those for effective dose of both female and male patients. For the same size females and males, risk index for females was about twice of that of males. The risk index ratios for males and females showed similar results.
Figure 5.
(a) and (c) Distribution of risk index with respect to patient size for all modalities and (b) and (d) risk index ratio of chest CT and tomosynthesis, and of chest tomosynthesis and conventional two-view chest x-ray. ED = effective dose, RI = risk index, PA = posteroanterior, AP = anteroposterior, and LAT = lateral.
Correlation of patient size with effective dose per mAs or 100 mAs
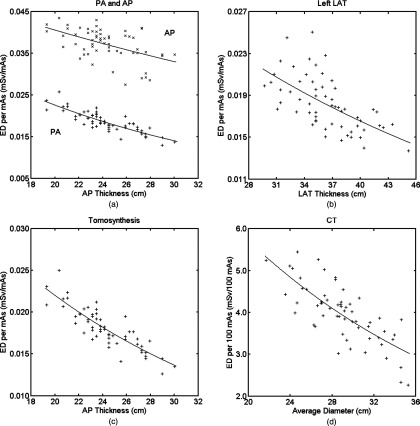
Figures 6a, 6b, 6c, 6d depict the exponential relationship between effective dose per mAs or 100 mAs and patient body size. Table 2 tabulates the fitting parameters for the following formula:
where d is the body dimension related to the technique used by the specific examination. For the chest posteroanterior, anteroposterior, and tomosynthesis examinations, d was the anteroposterior thickness at the beam center; for the left lateral examination, d was the lateral thickness at the beam center; for chest CT, d was the average diameter (defined in Sec. 2B4). Chest tomosynthesis had the highest R2 value, indicating the best correlation between effective dose per mAs and anteroposterior thickness. This can also be observed by the less scattered “+” in Fig. 6c. To the contrary, the chest anteroposterior examination had the smallest R2 value, which can be observed by the dispersed points in Fig. 6a. The chest posteroanterior and tomosynthesis examinations had a very similar distribution of effective dose per mAs, and thus close αED and βED values.
Figure 6.
Effective dose per mAs or 100 mAs as a function of body dimension for all patients and modalities: (a) chest PA and chest AP, (b) chest left LAT, (c) chest tomosynthesis; and (d) chest CT. For (a) and (c), patient's anteroposterior thickness at the beam center is used for the x-axis; for (b), patient's lateral thickness at the beam center is used for the x-axis; and for (d), average diameter is used for the x-axis. “+” or “×” are the effective dose values calculated from the organ dose of individual patients. Lines are the exponential fit ED (d) = exp (αEDd +βED) with parameters αED and βED tabulated in Table 2. ED = effective dose, PA = posteroanterior, AP = anteroposterior, and LAT = lateral.
Table 2.
Exponential relationship between effective dose and body size: ED (d) = exp (αEDd + βED), where d is anteroposterior thickness for PA, AP, and tomosynthesis, lateral thickness for left LAT, and average diameter for CT. PA = posteroanterior, AP = anteroposterior, and LAT = lateral.
| Fitting parameter |
|||
|---|---|---|---|
| Protocol | αED (cm−1) | βED | R2 |
| PA | −0.047 | −2.84 | 0.731 |
| AP | −0.021 | −2.79 | 0.256 |
| Left LAT | −0.025 | −3.10 | 0.373 |
| Tomosynthesis | −0.048 | −2.86 | 0.738 |
| CT | −0.041 | 2.57 | 0.574 |
Correlation of patient size with organ dose per mAs or 100 mAs
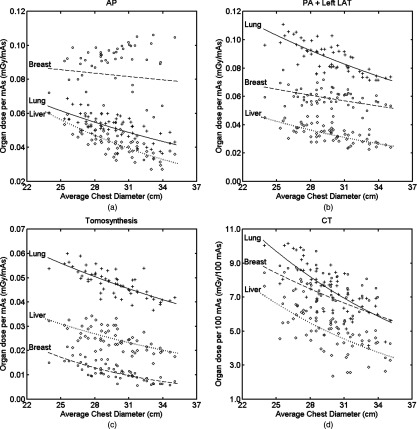
Figures 7a, 7b, 7c, 7d show relationship between three large organs of interest in chest examinations with average chest diameter (defined in Sec. 2D). The lungs received higher dose compared to the liver and breasts in the two-view chest x-ray and tomosynthesis. The breasts received higher dose in the chest anteroposterior examination for most patients. The liver received lower dose in CT compared to that of the lungs and breasts. Table 3 tabulates the fitting parameters of the exponential relationship:
with d the average chest diameter. Among all the modalities, chest tomosynthesis had the best exponential fit for organ dose and body size. Lung dose had the highest R2 value, indicating best fit, which can also be observed from the plots. Dose to the breasts showed an exponential decrease with body size for chest tomosynthesis; it had much weaker exponential correlation for CT and the two-view chest x-ray and even less correlation for the chest anteroposterior examination.
Figure 7.
Lung, breast, and liver doses as a function of body dimension. Lines are the exponential fit: organ dose (d) = exp (αorgand + βorgan) with the fitting parameters tabulated in Table 3 for each organ. PA = posteroanterior, AP = anteroposterior, and LAT = lateral.
Table 3.
Exponential relationship of organ dose with body size: organ dose (d) = exp (αorgand + βorgan) with d the average chest diameter defined in Sec. 2D. PA = posteroanterior, AP = anteroposterior and LAT = lateral.
| Fitting parameter |
||||
|---|---|---|---|---|
| Organ | Protocol | αorgan (cm−1) | βorgan | R2 |
| Lungs | AP | −0.039 | −1.82 | 0.471 |
| PA + left LAT | −0.037 | −1.36 | 0.590 | |
| Tomosynthesis | −0.035 | −2.01 | 0.596 | |
| CT | −0.056 | 3.67 | 0.602 | |
| Breasts | AP | −0.008 | −2.26 | 0.008 |
| PA + left LAT | −0.022 | −2.17 | 0.201 | |
| Tomosynthesis | −0.096 | −1.65 | 0.613 | |
| CT | −0.039 | 3.11 | 0.261 | |
| Liver | AP | −0.060 | −1.39 | 0.616 |
| PA + left LAT | −0.052 | −1.86 | 0.509 | |
| Tomosynthesis | −0.048 | −2.28 | 0.412 | |
| CT | −0.063 | 3.47 | 0.403 | |
Effect of tomosynthesis angles on radiation dose
Figures 8a, 8b show the effect of projection angles on radiation dose in chest tomosynthesis for the reference phantoms. Effective dose increased as the x-ray tube moved towards the center, maximized at approximately zero degrees, and decreased as the tube moved off-center. The difference between the minimum effective dose at angle −15.3° and the maximum at angle −0.9° was extremely small, only 0.002 mSv. Dose received by the lungs, breasts, and liver for the male and female reference phantoms illustrated a very similar trend, therefore only female data are shown here. Dose to the lungs and breasts with respect to angles showed a similar trend as effective dose, with dose to the breasts being much smaller (about one-fifth that of the lungs). Dose to the liver continued increasing as the x-ray tube moved up and had a small decrease at the end.
Figure 8.
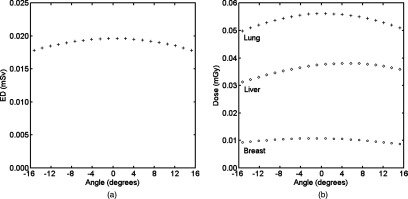
(a) Effective dose at each acquisition angle of chest tomosynthesis for the reference phantoms and (b) doses to lungs, breasts, and liver at each acquisition angle for the reference female phantom. Negative angles mean the x-ray tube is inferior to the pivot point. The effective dose was averaged across male and female reference phantoms as defined in ICRP publication 103. Doses to the three organs for both reference phantoms showed the same pattern, so only female data were plotted here. ED = effective dose.
DISCUSSION
Organ doses, effective doses, and risk indices between the three main x-ray based chest imaging modalities (chest radiograph, tomosynthesis, and CT) were studied across 59 anatomically varied adult patients. Among these three modalities, CT may provide the highest level of feature resolution but with a notably higher radiation dose. To implement the ALARA (as low as reasonably achievable) principle in making an appropriate choice between standard chest projection imaging, tomosynthesis, and CT to achieve the lowest possible dose to patients, the organ doses, effective doses, and risk indices for each modality should be accurately known. Although some comparison studies across the three modalities have been conducted,18, 19 these studies were based on different platforms and used only one generic phantom. To the authors’ knowledge, this study was the first study that provided a dosimetric comparison across these modalities on one platform with a wide range of patient sizes.
Effective dose across imaging modalities
The average effective doses, obtained from averaging effective doses of the 59 patients, for the chest posteroanterior, left lateral, and tomosynthesis studies were found to be 0.043 mSv, 0.099 mSv, and 0.39 mSv, which were about two to three times of the values reported by Sabol for the same machine and technical settings.19 There are multiple possible reasons for this as follows. First, the phantoms used in the two studies were very different. Sabol used a mathematical phantom that was scaled to a medium American male, while we used 59 voxelized phantoms that were created from real patients’ CT data. Second, this work did not count for the change of collimation of the x-ray source at different projection angles for the tomosynthesis examination, which would result in over exposure to patient anatomy especially for radiosensitive organs at the edge of the FOV (thyroid, breast, and liver) and therefore higher effective dose. Third, neither this study nor Sabol's study validated the spectrum used in the simulation. Sabol assumed a 2.7 mm Al equivalent filtration at 71 kVp for the spectrum at 120 kVp. It is known that a material's linear attenuation changes with kVp, thus the equivalent filtration will be different at 120 kVp. The spectrum in our study was generated by xSpect software24 with its HVL matched to the measured value (Sec. 2B1) at 120 kVp. This was significantly different from the spectrum implemented in Sabol's work. Furthermore, mAs techniques used in the two studies were different. Sabol used 1.9 mAs for posteroanterior and 5.9 mAs for left lateral, while we used mAs adjusted values based on the patient's body dimensions, having averages of 2.4 mAs for posteroanterior and 5.6 mAs for left lateral.
An mAs ratio of 10:1 was assumed for the chest tomosynthesis to the posteroanterior examination during the calculation. If a simple scale of ten was used to estimate the average effective dose of the chest tomosynthesis from the chest posteroanterior examination, it would result in a discrepancy of 3.6%, a value different from that of Sabol's work (discrepancy of 25%).19 This can be explained by the effective dose discussion in the previous paragraph.
Effect of body size on radiation dose
Exponentially decreasing effective dose per mAs or 100 mAs with increasing body size was observed as expected, agreeing with many other studies.9, 13, 14, 30, 31 This was simply due to the exponential absorption of x-ray photon energy by body tissues. Correlation of effective dose per mAs with body dimensions for the chest anteroposterior and left lateral study was weaker than that of the posteroanterior and tomosynthesis studies [Figs. 6a, 6b, 6c]. This can be explained by the wide spread dose to the surface organ—breasts—in these two examinations [Figs. 7a, 7b]. Breasts are important in chest examinations because they receive a high radiation dose and carry a high weighting factor in ICRP 103.28 In chest anteroposterior and left lateral examinations, the breasts were directly irradiated without any other body shielding, so the dose received was independent of the body dimension. Thus, the R2 value of breasts (Table 3) for the anteroposterior study was very small (0.008).
Correlations between the body diameter and the normalized lung and liver doses were better than that of the breasts for all modalities, indicating surface organs have weaker correlation with body size, which agreed well with previous studies.13, 32 The exponential relationship between organ dose normalized to mAs and body size shown in this study has also been reported in the literature.13, 30, 31 Our study further demonstrated such an exponential relationship for chest tomosynthesis examinations.
The absolute effective dose from the chest CT examination increased exponentially with the increase of patient size, while only increasing slightly for radiographic modalities. This is caused by the exponential dependence of CTDIvol on the average diameter in CT. With the effective dose per tube current known for different body sizes and for both planer x-ray and CT, the absolute effective dose can be expressed as (ED/mAs)×mAs. From Table 2, chest tomosynthesis and CT examinations have very close α values (−0.048 cm−1 and −0.041 cm−1 respectively), indicating that their ED/mAs decreased at a similar rate with respect to patient size. Thus, the different trends of absolute effective dose between these two examinations can be explained by the differences of their mAs values. For tomosynthesis examinations, mAs increased with patient size in a discrete fashion, while for CT, it increased in a continuous and exponential fashion. This resulted in the differences in absolute effective dose trends between these two examinations, which indicated that a larger patient would benefit much more by choosing chest tomosynthesis as opposed to chest CT. Although Duke technique charts already considered image quality in terms of detector dose, it did not aim to offer a fully optimized performance across patient size. While our study is meaningful as it offers dose comparisons for clinically applicable techniques, we believe a future study is warranted to address this limitation, and to determine dose across modalities when the modalities are fully optimized with respect to explicit image quality targets.
Recognizing the limitations of effective dose and cancer risk, risk index was estimated for each modality. The trends of risk index for the various modalities were similar to that of effective dose, which follows the same argument with the additional provision of accounting for patient gender.
Effect of tomosynthesis angles on radiation dose
Effective doses and doses to lungs and breasts for each projection angle in chest tomosynthesis displayed a parabolic shape, as reported in other studies.15, 19, 33 Since the same collimation was used throughout all projection angles, the parabolic response was mainly due to the change of field-to-source distance from extreme to central angles and thus the inverse square effect on incident exposure. Dose to the liver, however, did not have the maximum at zero degrees, which was because of more shielding for body tissues at lower angles caused by its inferior location with respect to the pivot point.
Limitations and future work
The results presented in this paper were obtained under particular technique settings, meaning that they might not directly apply to examinations performed with different imaging parameters (for example different kVp or filtration). Thus, when implementing the results, it should be ensured that the imaging parameters are similar. Nonetheless, the protocols used in this study corresponded to clinical operation, and as such the results were of clinical relevance.
In this work, we used effective dose to quantify the total burden of the patient in an examination in a scalar form. Effective dose, however, is not explicitly defined for an individual patient. In the absence of a universally defined scalar metric, effective dose has been used to fulfill this need. It is in that spirit that we used effective dose in this work.
It should be noted that the primary purpose of this study was to provide dosimetric information between chest x-ray radiography, tomosynthesis, and CT. The data reported here are intended to determine the best imaging modality for individual patients. However, to have a thorough picture, the image quality of the three modalities and thus the benefit to risk ratios should also be considered. For example, although larger patients receive much less dose during a chest tomosynthesis examination than CT compared to smaller patients, the image quality from a tomosynthesis scan might be much worse for larger patients which might result in a smaller benefit to risk ratio. Furthermore, future work should consider patients’ age while computing risk index, since age dependency is one significant advantage of the concept of risk index over effective dose as a dose metric. This study can also be extended to pediatric patients, who are more radio-sensitive and have a longer life time to develop cancers. However, one major conclusion from this study that can also be applied to pediatric patients is that the effective dose ratio between CT and tomosynthesis might be less for pediatric patients, due to their small sizes.
CONCLUSION
In this study, organ doses, effective doses, and risk indices were compared across three main x-ray based chest imaging modalities based on one common Monte Carlo simulation platform. Fifty-nine anatomically varied male and female adult patients covering a wide range of body habitus were employed in the Monte Carlo simulation of each modality. With increasing patient average chest diameter, organ dose, effective dose, and risk index for CT increased considerably in an exponential fashion, while these three dose values only increased slightly for radiographic modalities and tomosynthesis. The ratios of effective dose and risk index versus chest diameter for CT/tomosynthesis showed a significant slope, while the ratios for tomosynthesis and conventional two-view x-ray remained rather flat, indicating a greater benefit for larger patients in choosing chest tomosynthesis over CT.
References
- McAdams H. P., Samei E., Dobbins J. 3rd, Tourassi G. D., and Ravin C. E., “Recent advances in chest radiography,” Radiology 241, 663–683 (2006). 10.1148/radiol.2413051535 [DOI] [PubMed] [Google Scholar]
- Bushberg J. T., The Essential Physics of Medical Imaging (Williams & Wilkins, Baltimore, 1994). [Google Scholar]
- Berlin L., “To order or not to order a CT examination because of radiation exposure: That is the question,” AJR Am. J. Roentgenol. 196, W216 (2011). 10.2214/AJR.10.5527 [DOI] [PubMed] [Google Scholar]
- Brenner D. J. and Hall E. J., “Computed tomography—An increasing source of radiation exposure,” N. Engl. J. Med. 357, 2277–2284 (2007). 10.1056/NEJMra072149 [DOI] [PubMed] [Google Scholar]
- NCRP, Ionizing Radiation Exposure of the Population of the United States : Recommendations of the National Council on Radiation Protection and Measurements (National Council on Radiation Protection and Measurements, Bethesda, MD, 2009). [Google Scholar]
- J. T.Dobbins3rd and McAdams H. P., “Chest tomosynthesis: Technical principles and clinical update,” Eur. J. Radiol. 72, 244–251 (2009). 10.1016/j.ejrad.2009.05.054 [DOI] [PMC free article] [PubMed] [Google Scholar]
- Compagnone G., Baleni M. C., Pagan L., Calzolaio F. L., Barozzi L., and Bergamini C., “Comparison of radiation doses to patients undergoing standard radiographic examinations with conventional screen-film radiography, computed radiography and direct digital radiography,” Br. J. Radiol. 79, 899–904 (2006). 10.1259/bjr/57138583 [DOI] [PubMed] [Google Scholar]
- Compagnone G., Pagan L., Baleni M. C., Calzolaio F. L., Barozzi L., and Bergamini C., “Patient dose in digital projection radiography,” Radiat. Prot. Dosim. 129, 135–137 (2008). 10.1093/rpd/ncn013 [DOI] [PubMed] [Google Scholar]
- Huda W. and Gkanatsios N. A., “Effective dose and energy imparted in diagnostic radiology,” Med. Phys. 24, 1311–1316 (1997). 10.1118/1.598153 [DOI] [PubMed] [Google Scholar]
- Huda W., Sandison G. A., Palser R. F., and Savoie D., “Radiation doses and detriment from chest x-ray examinations,” Phys. Med. Biol. 34, 1477–1492 (1989). 10.1088/0031-9155/34/10/010 [DOI] [PubMed] [Google Scholar]
- Huda W., Scalzetti E. M., and Roskopf M., “Effective doses to patients undergoing thoracic computed tomography examinations,” Med. Phys. 27, 838–844 (2000). 10.1118/1.598949 [DOI] [PubMed] [Google Scholar]
- Li X., Samei E., Segars W. P., Sturgeon G. M., Colsher J. G., and Frush D. P., “Patient-specific dose estimation for pediatric chest CT,” Med. Phys. 35, 5821–5828 (2008). 10.1118/1.3026593 [DOI] [PMC free article] [PubMed] [Google Scholar]
- Li X., Samei E., Segars W. P., Sturgeon G. M., Colsher J. G., and Frush D. P., “Patient-specific radiation dose and cancer risk for pediatric chest CT,” Radiology 259, 862–874 (2011). 10.1148/radiol.11101900 [DOI] [PMC free article] [PubMed] [Google Scholar]
- Li X., Samei E., Williams C. H., Segars W. P., Tward D. J., Miller M. I., Ratnanather J. T., Paulson E. K., and Frush D. P., “Effects of protocol and obesity on dose conversion factors in adult body CT,” Med. Phys. 39, 6550–6571 (2012). 10.1118/1.4754584 [DOI] [PMC free article] [PubMed] [Google Scholar]
- Svalkvist A., Mansson L. G., and Bath M., “Monte Carlo simulations of the dosimetry of chest tomosynthesis,” Radiat. Prot. Dosim. 139, 144–152 (2010). 10.1093/rpd/ncq068 [DOI] [PubMed] [Google Scholar]
- Ullman G., Dance D. R., Sandborg M., Carlsson G. A., Svalkvist A., and Bath M., “A Monte Carlo-based model for simulation of digital chest tomosynthesis,” Radiat. Prot. Dosim. 139, 159–163 (2010). 10.1093/rpd/ncq079 [DOI] [PubMed] [Google Scholar]
- Zhang Y., Li X., Segars W. P., and Samei E., “Organ doses, effective doses, and risk indices in adult CT: Comparison of four types of reference phantoms across different examination protocols,” Med. Phys. 39, 3404–3423 (2012). 10.1118/1.4718710 [DOI] [PMC free article] [PubMed] [Google Scholar]
- Bath M., Svalkvist A., von Wrangel A., Rismyhr-Olsson H., and Cederblad A., “Effective dose to patients from chest examinations with tomosynthesis,” Radiat. Prot. Dosim. 139, 153–158 (2010). 10.1093/rpd/ncq092 [DOI] [PubMed] [Google Scholar]
- Sabol J. M., “A Monte Carlo estimation of effective dose in chest tomosynthesis,” Med. Phys. 36, 5480–5487 (2009). 10.1118/1.3250907 [DOI] [PubMed] [Google Scholar]
- Bond J., Frush J., Hon S., Eckersley C., Williams C. H., Feng J. Q., Tward D. J., Ratnanather T. J. T., Miller M. I., Frush D., Samei E., and Segars W. P., “Series of 4D adult XCAT phantoms for imaging research and dosimetry,” Proc. SPIE 8313, 83130P-1–83130P-6 (2012). 10.1117/12.911676 [DOI] [Google Scholar]
- Segars W. P., Bond J., Frush J., Hon S., Eckersley C., Williams C. H., Feng J., Tward D. J., Ratnanather J. T., Miller M. I., Frush D., and Samei E., “Population of anatomically variable 4D XCAT adult phantoms for imaging research and optimization,” Med. Phys. 40, 043701 (11pp.) (2013). 10.1118/1.4794178 [DOI] [PMC free article] [PubMed] [Google Scholar]
- de la Grandmaison G. L., Clairand I., and Durigon M., “Organ weight in 684 adult autopsies: New tables for a Caucasoid population,” Forensic Sci. Int. 119, 149–154 (2001). 10.1016/S0379-0738(00)00401-1 [DOI] [PubMed] [Google Scholar]
- Segars W. P., Sturgeon G., Mendonca S., Grimes J., and Tsui B. M., “4D XCAT phantom for multimodality imaging research,” Med. Phys. 37, 4902–4915 (2010). 10.1118/1.3480985 [DOI] [PMC free article] [PubMed] [Google Scholar]
- Samei E. and Flynn M. J., “An experimental comparison of detector performance for computed radiography systems,” Med. Phys. 29, 447–459 (2002). 10.1118/1.1449873 [DOI] [PubMed] [Google Scholar]
- Li X. A., Samei E., Segars W. P., Sturgeon G. M., Colsher J. G., Toncheva G., Yoshizumi T. T., and Frush D. P., “Patient-specific radiation dose and cancer risk estimation in CT: Part I. Development and validation of a Monte Carlo program,” Med. Phys. 38, 397–407 (2011). 10.1118/1.3515839 [DOI] [PMC free article] [PubMed] [Google Scholar]
- Li X. A., Samei E., Segars W. P., Sturgeon G. M., Colsher J. G., Toncheva G., Yoshizumi T. T., and Frush D. P., “Patient-specific radiation dose and cancer risk estimation in CT: Part II. Application to patients,” Med. Phys. 38, 408–419 (2011). 10.1118/1.3515864 [DOI] [PMC free article] [PubMed] [Google Scholar]
- Christianson O., Li X., Frush D., and Samei E., “Automated size-specific CT dose monitoring program: Assessing variability in CT dose,” Med. Phys. 39, 7131–7139 (2012). 10.1118/1.4761871 [DOI] [PubMed] [Google Scholar]
- ICRP, “The 2007 Recommendations of the International Commission on Radiological Protection. ICRP publication 103,” Ann. ICRP 37, 1–332 (2007). 10.1016/j.icrp.2007.10.003 [DOI] [PubMed] [Google Scholar]
- National Research Council (U.S.), “Committee to assess health risks from exposure to low level of ionizing radiation,” Health Risks from Exposure to Low Levels of Ionizing Radiation : BEIR VII Phase 2 (National Academies Press, Washington, D.C., 2006). [PubMed] [Google Scholar]
- Huda W., Atherton J. V., Ware D. E., and Cumming W. A., “An approach for the estimation of effective radiation dose at CT in pediatric patients,” Radiology 203, 417–422 (1997). 10.2214/AJR.06.0101 [DOI] [PubMed] [Google Scholar]
- Nickoloff E. L., Dutta A. K., and Lu Z. F., “Influence of phantom diameter, kVp and scan mode upon computed tomography dose index,” Med. Phys. 30, 395–402 (2003). 10.1118/1.1543149 [DOI] [PubMed] [Google Scholar]
- Turner A. C., Zankl M., DeMarco J. J., Cagnon C. H., Zhang D., Angel E., Cody D. D., Stevens D. M., McCollough C. H., and McNitt-Gray M. F., “The feasibility of a scanner-independent technique to estimate organ dose from MDCT scans: Using CTDIvol to account for differences between scanners,” Med. Phys. 37, 1816–1825 (2010). 10.1118/1.3368596 [DOI] [PMC free article] [PubMed] [Google Scholar]
- Svalkvist A., Zachrisson S., Mansson L. G., and Bath M., “Investigation of the dosimetry of chest tomosynthesis,” Proc. SPIE 7258, 72585X_1–72585X_8 (2009). 10.1117/12.810256 [DOI] [Google Scholar]


