Abstract
A direct numerical simulation of flow-structure interaction is carried out in a subject-specific larynx model to study human phonation under physiological conditions. The simulation results compare well to the established human data. The resulting glottal flow and waveform are found to be within the normal physiological ranges. The effects of realistic geometry on the vocal fold dynamics and the glottal flow are extensively examined. It is found that the asymmetric anterior-posterior laryngeal configuration produces strong anterior-posterior asymmetries in both vocal fold vibration and glottal flow which has not been captured in the simplified models. It needs to be pointed out that the observations from the current numerical simulation are only valid for the flow conditions investigated. The limitations of the study are also discussed.
INTRODUCTION
Voice is a critical component of the unique human attribute known as speech. While the majority of the population is accustomed to normal voice production, at least 20% of the human population will develop a voice production disorder (Mittal and Iaccarino, 2005). A voice disorder impedes the individual's ability to work and to conduct normal social interactions and has long been associated with economic and social handicaps and with changes in self-image. As estimated by the National Institute on Deafness and Other Communication Disorders (NIDCD), there are 7.5 × 10⁶ people each year in the United States who suffer from a voice disorder (http://www.nidcd.nih.gov/health/statistics/ vsl/Pages/stats.aspx). Research on voice production could lead to better health care and benefits for a large group of the population (Titze, 1973).
Phonation refers to voice production inside the human larynx resulting from nonlinear biomechanical coupling between glottal aerodynamics and vocal fold (VF) vibrations. Phonation is a very rich problem in fluid mechanics, structural dynamics, and aero-structural interactions. Modeling of phonation represents a significant challenge due to the multiphysics nature of the problem and the highly complex geometry of the human airway (Mittal et al., 2013). Early phonation research has mainly relied on either gross simplifications in geometry, kinematics, and/or the physics, or reduced-order models (Flanagan and Landgraf, 1968; Ishizaka and Flanagan, 1972; Story and Titze, 1995; Titze, 1973). Because of highly simplified models, these earlier studies have primarily focused on analyzing resulting wave forms (glottal flow and area) which only provide limited insight into human phonation.
In the recent decade, the understanding of human phonation has been greatly enhanced owing to the rapid development of computational modeling as well as experimental techniques (Mittal et al., 2013). Detailed glottal flow fields and VF vibration patterns, especially three-dimensional effects, were able to be uncovered and investigated (Alipour et al., 2000; Becker et al., 2009; Erath and Plesniak, 2006; îSidlof et al., 2013; Neubauer and Zhang, 2007; Triep et al., 2005; Triep and Brücker, 2010; Xue et al., 2012; Zheng et al., 2011a). For example, the glottal flow, manifested by a pulsatile turbulent jet, is found to have a very complex dynamic behavior (Erath and Plesniak, 2006). The glottal jet is unsteady and asymmetric with a stochastic jet deflection behavior from cycle to cycle. The jet is highly three-dimensional, manifested with axis switching and vena contracta (Triep et al., 2005). The glottal flow strongly interacts with the supraglottal wall, producing complex vortex structures which further destabilize the glottal jet (Xue et al., 2012; Zhang et al., 2002). Moreover, the pair of VFs is found to present a very complex vibration pattern mainly composed of a medial/lateral motion and mucosal type motion vibrating at the same frequency. This phenomenon is the so called 1:1 modal entrainment and is an important indicator of healthy phonation (Berry et al., 2001; Berry et al., 1994; Zhang et al. 2007). The dependency of the vibration pattern on material properties and the distribution of inner tissue layers has also been investigated (Cook et al., 2008; Xue et al., 2011). These fluid mechanics and solid mechanics studies have greatly improved the fundamental understanding of human phonation and have clarified and confirmed many longstanding debates and hypotheses. However, most of these studies only provided limited insights due to the inability to address the nonlinear coupling between the glottal flow and VF tissue.
Flow-structure interaction (FSI) computational modeling of human phonation has also been undertaken by several researchers. These models coupled the full Naiver-Stokes equation flow model with continuum tissue models. These studies created the detailed flow field and flow induced VF vibrations in a fully coupled manner. Because of the high computational expense, the FSI studies were mostly limited to two-dimensional simulations (Duncan et al., 2006; Link et al., 2009; Luo et al., 2008; Tao et al., 2007). The first three-dimensional FSI modeling of human phonation was carried out by Rosa and Pereira (2003). In this model, the tissue was modeled as transversely isotropic viscoelastic material and the airflow was described by unsteady Navier-Stokes equations. The larynx was represented by an elliptical tube. The authors clearly demonstrated self-sustained oscillations of the VFs; however, the grid resolution was too low to provide detailed flow field information.
Very recently we have utilized a three-dimensional, coupled FSI computational model with fully resolved flow and tissue fields to investigate the dynamics of phonation. This model coupled an accurate immersed-boundary method (IBM) based flow solver with a finite element method (FEM) based solid dynamics solver (Zheng et al., 2010). The simulations were carried out and thoroughly validated on an idealized rectangular larynx model (Zheng et al., 2011b) as well as a three-dimensional tubular model with many important anatomical geometric parameters (Xue et al., 2012). These studies reproduced many of the characteristic features of the glottal flow and VF dynamics observed in vivo (Hertegard et al., 1992; Titze, 2000; Zemilin, 1998) and in vitro (Berry et al., 1994; Berry et al., 2001) the model also provided new insights regarding asymmetric jet deflection and transition.
However, one remaining important factor that all the aforementioned studies, either single discipline and multi-disciplinary studies or numerical and experimental studies, failed to address is the geometric complexity. All of these studies assumed either no-variation or symmetry along the anterior-posterior direction as well as a straight airway lumen. The shapes of the larynx lumen and VF are highly three dimensional and this complex geometry will produce profound impacts on both glottal flow (Farley and Thomson, 2011) as well as VF dynamics (îSvec and Schutte, 1996). For instance, flow-induced vibrations of the VFs were observed to have strong anterior-posterior variations in high speed imaging studies (îSvec and Schutte, 1996). To date, to the best of our knowledge, there is no FSI study carried out on a subject-specific model. The three-dimensional glottal flow and VF vibration pattern with a realistic larynx geometric model during phonation remains elusive.
To advance the state of the art, we investigated human phonation in a realistic subject-specific larynx using FSI simulations. This study is an important precursor step to developing a computer tool for voice disease diagnosis and surgical planning. It will help bridge the gap between phonation research and clinical practice and help bring computational techniques directly into clinical practice. It should also help to improve the fundamental understanding of human phonation, especially the effects of anatomical complexity, and to provide new insights into the biophysics of voice production.
The objectives of the effort described in this paper are (1) to simulate phonation in a subject-specific model and compare computed features with established data and (2) to examine the data to generate new insights into the physics of phonation, especially the effects of geometric complexity. It should be pointed out that the observations in this paper are only valid for the flow conditions that are investigated. The limitations of the study are discussed in detail in conclusion section.
COMPUTATIONAL METHODS AND SIMULATION SETUP
Computational methodology
The glottal airflow is governed by the three-dimensional, unsteady, viscous, incompressible Navier–Stokes equations. The equations are discretized in space using a second-order non-dissipative central difference scheme and integrated in time using a second-order fractional step method. The advection term is linearized using a second-order Adams–Bashforth scheme, and the diffusion term is discretized using implicit Crank–Nicolson scheme. The boundary conditions are implemented through a sharp-interface IBM. The VF dynamics are governed by the Navier equation (Alipour et al., 2000). The equations are solved using the FEM and second-order Newmark scheme. The coupling between the flow and solid solver is implemented by tracking the aerodynamic load on the interface mesh as well as its deformed shape and velocity in a Lagrangian fashion. This FSI solver has been fully validated (Zheng et al., 2010) and successfully applied in several of our previous FSI studies of human phonation in idealized two-dimensional (Zheng et al., 2009) and three-dimensional larynx models (Xue et al., 2012; Zheng et al., 2011b). Details regarding the FSI solver can be found in Zheng et al. (2010). To deal with the contact between two VFs during closed phase, we apply a kinematic constraint on the VFs to enforce a minimum glottal gap of 0.01 cm. While this glottal gap is necessary for the success of the flow solver, it nevertheless allows some “leakage” flow even during closed phase and this fact needs to be kept in mind while interpreting the results.
Anatomical model of larynx
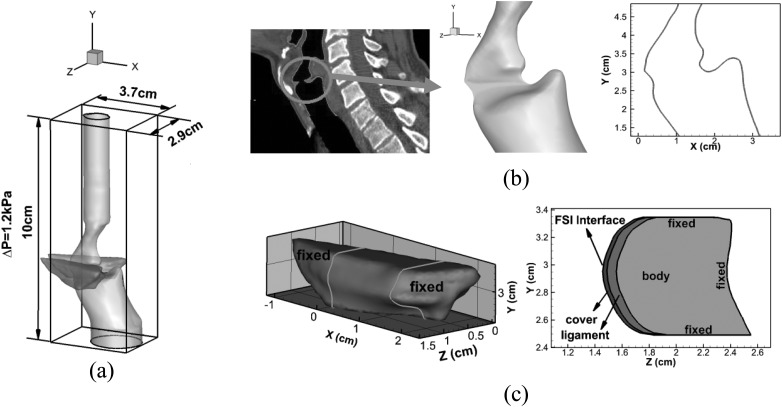
A realistic geometric reconstruction of both the laryngeal airway lumen and the VFs is required for the subject-specific study. In the current study, a thin-slice CT scan of the larynx (0.5 mm plane-to-plane resolution) has been performed on a 30-year-old male subject with normal (undiseased) VFs at The George Washington University Hospital. To be able to assess the VF surfaces, the subject was asked to phonate during the scan, and the scan covered the subject's entire larynx. This thin-slice CT scan provides sufficient spatial resolution to accurately reconstruct the anatomical structure, such as VFs, false VFs, etc. Both the surface of the laryngeal airway lumen and VFs were extracted from this CT scan using commercial software, Mimics. To ensure the level of accuracy required by the subject-specific simulation, both the larynx airway and VFs were manually segmented by the experienced otolaryngologist at George Washing University Hospital. It should be pointed out that the vocal fold mucosa and superficial lamina propria were vibrating during the CT acquisition, making this area blurry in the CT image. When performing the outline of the airway and VF, the otolaryngologist initially traced the sharp border between the airway and soft tissues of the larynx in the CT scans. This operation excluded the vibrating part of the VF. Then, the medial surface of the VF was adjusted so that the medial surfaces are straight along the VF length and meet at the center pane. At last, the airway surface was adjusted according to the adjustment of the VF. Figure 1a shows the manually segmented lumen and VFs superimposed on a sagittal view of the CT of the human larynx. The registration and mesh generation were then automatically performed by the software to obtain the surface mesh of the airway lumen and the volume mesh of the VFs, which were then used taken by the numerical simulations. Three views of the reconstructed lumen and VFs are shown in Figs. 1a, 1b, 1c. The approximate dimension of each VF is 0.9 cm (thickness) × 1.0 cm (depth) × 1.4 cm (length). Two artificial straight tubes are connected to both the subglottal trachea and the supraglottal pharynx to provide enough distance for applying uniform pressure boundary conditions.
Figure 1.
(Color online) (a) Computational domain and laryngeal model. (b) A high resolution CT scan image of human larynx and the geometric model of the laryngeal airway in three-dimensional as well as two-dimensional views. (c) The geometric model of the VF and its three-layer inner structure as well as boundary conditions. The solid lines in the three-dimensional view indicate the position beyond which the two ends of the VF are fixed.
Simulation setup
The lumen model is immersed into a 10 cm (inferior-superior) × 2.9 cm (medial-lateral) × 3.7 cm (anterior-posterior) rectangular box. The VFs are located between 2.5 cm and 3.5 cm from the bottom inlet in the inferior-superior direction. A supraglottal straight tube (about 5-cm long) is attached to the vocal folds to ensure no reverse flow occurring at the outlet. Also, 0 and 1.2 kPa gauge pressure are applied at the outlet and inlet, respectively, yielding a typical 1.2 kPa pressure drop across the vocal tract (Titze, 2000). The jet peak Reynolds number (defined as , where is phase-averaged peak velocity at the glottal exit, is the phase-averaged maximum glottal gap, and ν is the kinematic viscosity of air (Triep et al., 2005) is about 300. The density of air is 1.225 kg/m3. The non-slip-non-penetration flow condition is applied on all of the lumen walls.
The flow solver employs a high-resolution, non-uniform 64 × 256 × 128 Cartesian grid for the computational domain. The highest grid density is provided around the intraglottal and near-supraglottal region which is discretized by a 64 × 160 × 40 grid with uniform distribution in X and non-uniform distribution in the Y and Z directions. The minimum glottal gap width is resolved to at least two points in the Z direction. The same Cartesian mesh has been applied in our previous three-dimensional simulations (Zheng et al., 2011b), which had similar geometric dimensions and flow conditions. It has been shown that grid independent solutions can be achieved with such resolution.
The internal anatomical structure of the human VF is made up of three layers (Hirano et al., 1981): cover, ligament, and vocalis. As shown by Hirano et al. (1981), these inner layers have a longitudinal (anterior-posterior) variation in the thickness which is manifested by a thicker cover layer in the middle and a thicker ligament layer at two longitudinal ends. Because of similar tissue density, these profiles of the inner layers cannot be captured through the CT scan. However, according to our recent study, the longitudinal variation of each inner layer does not affect the overall vibratory characteristics of the VFs (Xue et al., 2011). Thus, in the current study, both the cover layer and the ligament layer had a uniform thickness in the longitudinal direction, 0.03 and 0.1 cm, respectively, taken from the histological measurement (Hirano et al., 1981). The in-plane profiles of both layers were represented by two curves parallel to the initial medial surface of the VF. The three layers were modeled as transversally isotropic viscoelastic materials and material properties of each are shown in Table TABLE I., where ρ is the tissue density, is the transversal Young's Modulus, is the in-plane transversal Poisson's ratio, is the longitudinal Young's Modulus, is the longitudinal Poisson's ratio, and is the longitudinal shear modulus. Modulus was set equal to 104 times the transversal Young's modulus and this automatically enforces the satisfaction of the in-plane motion constraint (Cook et al., 2008). It should be noted that all these parameters are well within the physiological range and have been extensively used in past studies (Alipour et al., 2000; Cook et al., 2008; Luo et al., 2008; Zheng et al., 2011b).
TABLE I.
Material properties of the three-layers of the vocal folds. ρ is the tissue density, is the transversal Young's Modulus, is the in-plane transversal Poisson's ratio, is the longitudinal Young's Modulus, is the longitudinal Poisson's ratio and is the longitudinal shear modulus.
| Property | |||||||
|---|---|---|---|---|---|---|---|
| Layer | |||||||
| Cover | 1.043 | 1.00 | 0.9 | 10 000 | 0.0 | 10 | 1 |
| Ligament | 1.043 | 1.15 | 0.9 | 11 500 | 0.0 | 20 | 1 |
| Body | 1.043 | 2.00 | 0.9 | 20 000 | 0.0 | 12 | 1 |
A zero displacement boundary condition was imposed on the lateral, inferior, and superior surfaces of the VF, and a traction boundary condition was applied on the portion of the medial surface of the VF which overlaps with the lumen surface. The anterior and posterior ends of the VF were anchored on the arytenoid and thyroid cartilages. The portions of the VF beyond the anchors were fixed. Each VF was discretized with a dense mesh consisting of 23 973 tetrahedral elements which ensured complex flow induced VF motion.
A small time step of is employed for both the flow solver and the solid dynamics solver to provide good temporal resolution as well as to satisfy the CFL stability constraint. The simulation was carried out on a 6.1 TeraFLOPS cluster from Penguin Computing with 512 compute cores running at 3.0 Ghz, with 3 TB of RAM and 40 Gbps QDR Infiniband for interprocess communication. The wall clock time was 240 h and the overall computational expense was 30 720 CPU hours.
RESULTS AND DISCUSSION
Glottal wave form
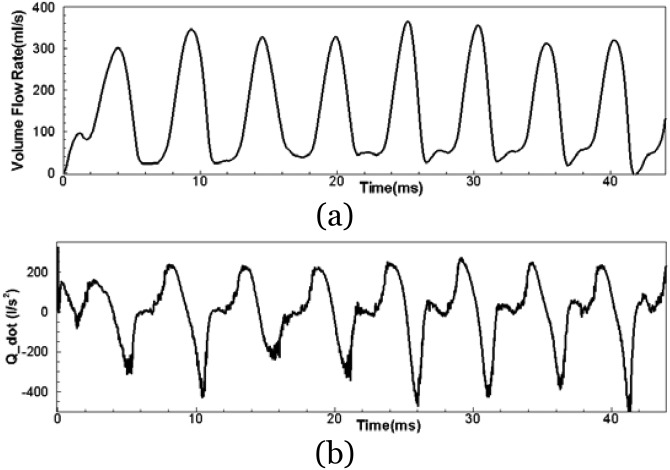
Simulations were carried out for over eight vibration cycles, and the time history of the volume flow rate, Q, and time change of volume flow rate, , is shown in Fig. 2. Figure 2a suggests that the simulation ran successfully to provide quasi-steady cycles with a range of peak flows from 300 to 360 ml/s. The monopole sound strength is directly related to the time-rate of change of the volume flow rate [shown in Fig. 2b]. In current study, the phase averaged amplitude of (difference between positive peak to negative peak) is 599 l/s2 and the standard deviation is 13%. The glottal flow waveform is a very important clinical variable for voice assessment. Because of flow incompressibility, the glottal flow can be measured using an OroNasal 4-chamber CV Masks with built-in pressure and flow transducers (Glottal Enterprises, Syracuse, New York) covering the subject's mouth and nose (Titze, 2000). Several statistical metrics are usually computed from this waveform to examine voice quality. The comparison between the simulated values and typical physiological ranges for these metrics are shown in Table TABLE II.. The simulated values are computed by phase-averaging over the “steady” cycles, and it can be seen that they are all well within typical physiological ranges. Thus, this simulation has successfully captured a typical glottal waveform of human phonation, and the computer simulation appears to be a good representation of real human phonation.
Figure 2.
Computed time-history of the glottal flow rate and time rate change of flow rate.
TABLE II.
Statistical quantities computed from current simulation compared to typical ranges reported by previous studies. is the fundamental frequency; and are the peak and mean glottal flow rate, respectively; is the open quotient, defined as, where is the duration of the glottal open phase(computed based on the glottal motion) and T is the cycle period; is the skewing quotient, defined as where is the duration of the flow increasing phase and is the duration of the flow decreasing phase. Trans-glottal pressure was 1.2 kPa.
| Computed value | Typical range | |
|---|---|---|
| (Hz) | 194.7 | 65–260 (Zemlin, 1988) |
| (ml/s) | 336.53 | 200–580 (Hertegard et al., 1992) |
| (ml/s) | 147.07 | 110–220 (Zemlin, 1988) |
| 0.60 | 0.4–0.7 (Titze, 2000) | |
| 1.28 | 1.1–3.4 (Ishizaka and Flanagan, 1972; Lamar et al., 2003; Duncan et al., 2006) |
Vocal fold dynamics
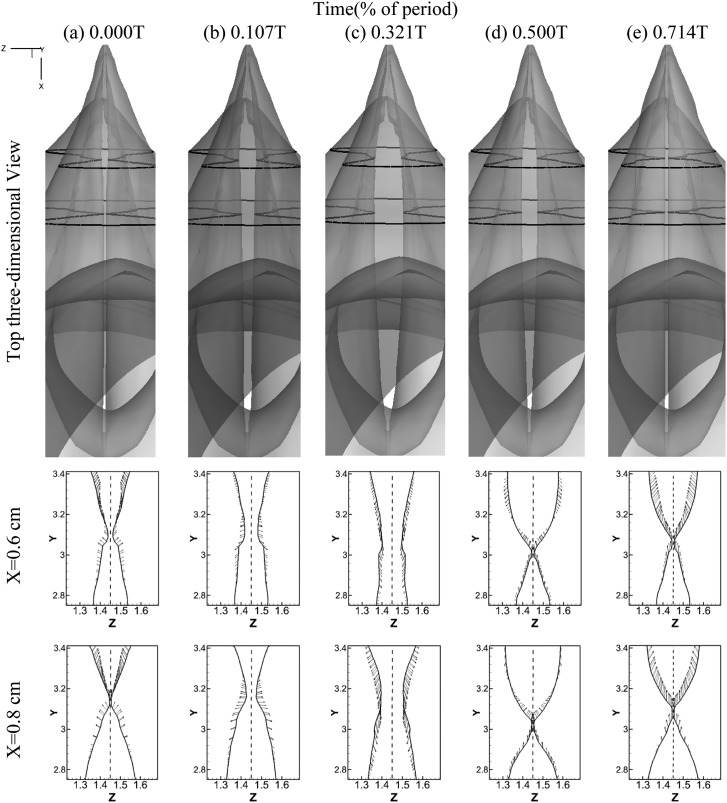
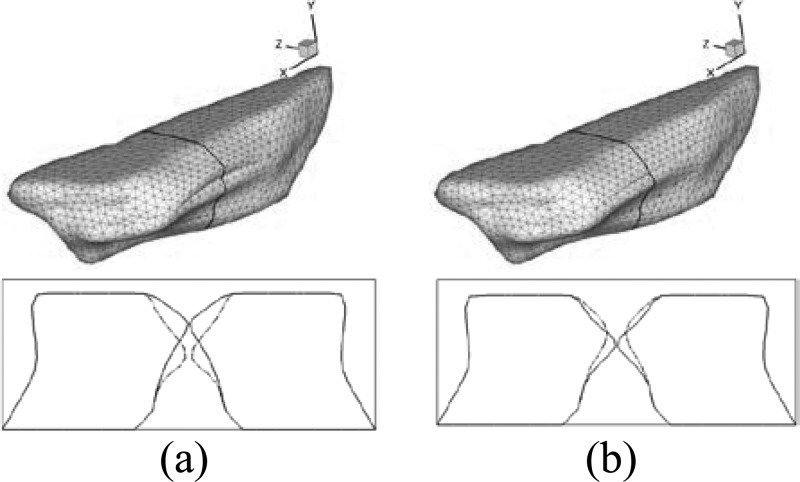
Figure 3 shows the simulated VF vibration pattern at five different time instants during one vibration cycle. The VFs are located between X = 0.162 cm to X = 1.65 cm in the longitudinal direction. One three-dimensional top view of the lumen surface and two two-dimensional front views of the VF configurations of cross sections at X = 0.6 cm and X = 0.8 cm are presented to illustrate the detailed VF motion. In the three-dimensional views, the airway lumen surfaces are set to be transparent to show the glottis. The two black lines indicate the locations of the two cross-sections at X = 0.6 cm and X = 0.8 cm.
Figure 3.
Glottal configurations at 5 different time instants during one vibration cycle. The first raw shows the top 3D view of glottis. The configurations of glottis at two cross sections x = 0.6 cm and x = 0.8 cm, respectively, are shown in the second and third raw. The locations of these planes are indicated by the black lines superimposed on the 3D view.
Several important features are observed. First, two dimensional views reveal alternative convergent and divergent glottal shape throughout the cycle. From 0.0T to 0.3T, the two VFs start to open from beneath and form a convergent shaped glottis in the inferior-superior direction. We define the period from 0.0T to 0.3T as the glottal opening phase in the rest of the paper. At about 0.3T, the VFs reach the maximum opening location and present a nearly straight passage. From 0.3T to 0.6T, they start to close from the beneath again and form a divergent glottal passage in the inferior-superior direction. We define the period from 0.3T to 0.6T as the glottal closing phase and the period from 0.6T to 1.0T as the glottal closed phase. The convergent/divergent glottal shape is a very specific vibration pattern associated with human phonation, and it is believed to be an efficient way to transfer flow energy to the VFs to main a sustained vibration (Titze, 2000). We have found that even with the asymmetric longitudinal configuration of the VFs, the convergent/divergent glottis is still formed in phase along the longitudinal direction for the whole VF.
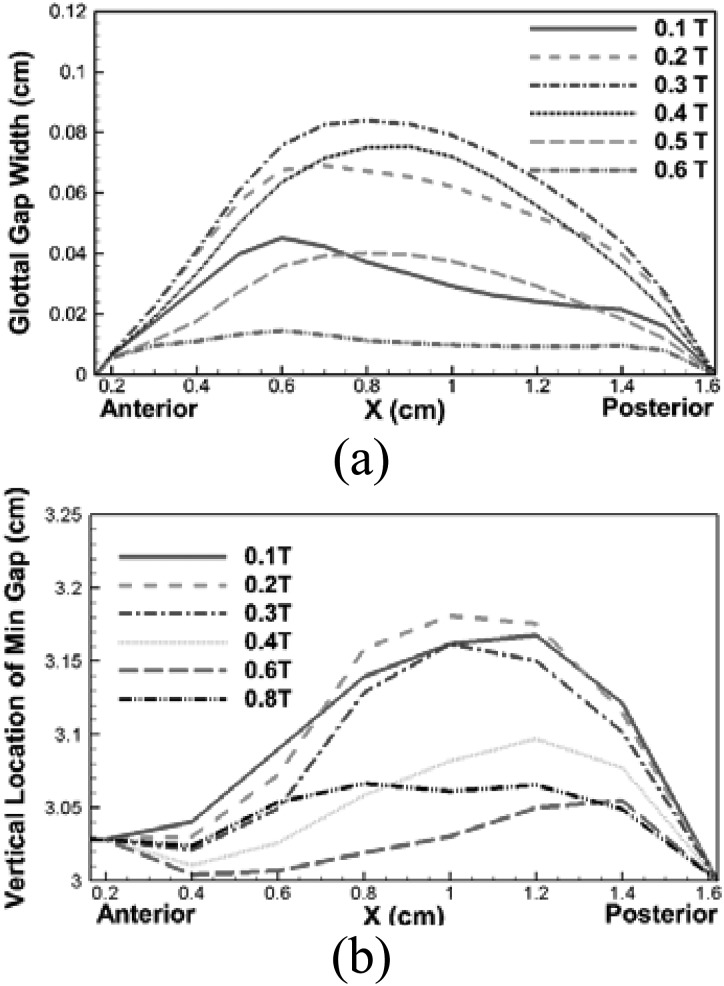
Second, the three-dimensional top view of the airway lumen reveals a strong asymmetry of the glottal gap width in the longitudinal direction. At the beginning of the cycle, the VFs start to separate from the anterior end so that a wider gap is seen at the anterior side (0.0T–0.1T). During late opening, the medial and posterior portions quickly catch up with the anterior portion. At about 0.3T, when the two VFs reach the maximum opening position, the glottis appears more symmetric in the longitudinal direction, although the gap width on the posterior side is still slightly smaller than the anterior side. This slight asymmetry remains during the closing phase. To clearly visualize and analyze this asymmetry, we computed the phase-averaged glottal gap width along the longitudinal direction of the VFs at six phases when the glottis was open [see Fig. 4a]. The glottal gap width is defined here as the minimum distance between the two VFs within a plane of X = constant. It can be observed that at the beginning of the cycle (0–0.2T), the VFs start to open from the anterior and the maximum glottal gap width occurs in the plane of X = 0.6 cm. During this phase, the glottis presents an asymmetric lens shape in the corresponding three-dimensional top views in Fig. 3b. During the late opening phase (0.2T–0.3T), the glottal gap width increases very little at the anterior and posterior portion due to constraint effects, while, on the other hand, it increases fastest at the middle portion due to strong inertial effects. At the end of the opening phase (0.3T), the glottal gap width at the middle portion exceeds the anterior part and the whole glottis present a more symmetric lens shape in the anterior-posterior direction in the corresponding three-dimensional views in Fig. 3c. The maximum gap width, which is 0.084 cm at this instant, occurs at the plane of X = 0.8 cm, indicating that a slight asymmetry in glottal gap width is still present in the longitudinal direction. In contrast to the opening phase, glottal gap width is more symmetric in the subsequent closing phase. The largest glottal gap width always remains at X = 0.8 cm until the glottis is fully closed. The causes of this asymmetric glottal shape will be discussed in the next section along with pressure distributions. It is important to note that this type of anterior-posterior asymmetric motion pattern has never been captured in previous computational studies with simplified geometric models, but however, has been reported by an in vivo study using high speed videokymography (îSvec and Schutte, 1996). It suggests that the unique three-dimensional anterior-posterior asymmetric configurations of the laryngeal airway and VFs play an important role in determining VF motions.
Figure 4.
(Color online) (a) Phase averaged glottal gap width along the entire VF in the longitudinal direction at six phases during glottal open phase. (b) Phase averaged vertical (inferior-superior) glottal location along the entire VF in the longitudinal direction at eight phases during one vibration cycle.
The third observed important feature is the asymmetric vertical (inferior-superior) position of the minimal glottal gap in longitudinal direction. Figure 4b shows the phase averaged vertical position of the minimal glottal gap along the longitudinal direction of the VF at eight phases during one vibration cycle. Overall, the posterior portion exhibits a higher equilibrium position than the anterior portion. The amplitude of the vertical displacement, computed as the maximum difference in vertical position of the minimal glottal gap within a vibration cycle, is largest near X = 1 cm with a value of 0.15 cm, and it decreases monotonically toward the anterior and posterior ends. The highest location of the minimal glottal gap occurs near X = 1 cm at t = 0.2T. The vertical position of the minimal glottal gap is closely correlated to the VF up/down motion. The entire VF moves up quickly at the beginning of the cycle (0.1T) with the highest rate at the middle portion. Both anterior and posterior portions reach their highest locations at t = 0.1T. Then they start to slowly move downward while the middle portion continuously moves up and reaches its highest location at t = 0.2 T. After that, the entire VF moves downward simultaneously although the glottis is still in the opening phase (0.2T–0.3T). During this phase (0.1T–0.3T), the downward motion of the VF is very slow which is caused by the lateral movement of the VF which flattens the glottal passageway and moves the vertical location of minimal glottal gap downward. In the subsequent closing phase (0.3–0.6T), the VF rapidly moves downward and reaches its lowest location when the glottis is fully closed (t = 0.6T). During the early glottal closed phase (0.6T–0.8T), the VF starts to move upward again. It should be noticed that during the late closing phase and early glottal closed phase (0.4T–0.8T), the posterior end does not present as much downward movement as the anterior end so it remains much higher during that period [Fig. 4b]. In the late glottal closed phase (0.8T–1.0T), the middle portion of glottis again moves fastest and has the highest location.
The computed VF deformation allows for a detailed analysis of the vibratory pattern. Here we employ proper orthogonal decomposition (POD) analysis to extract the most energetic empirical Eigen-modes. The POD analysis has been carried out over seven vibration cycles which contains 205 equally spaced snapshots of VF configurations. The detailed procedure for computing POD modes can be found in Zheng et al. (2011b). Figure 5 shows the two most energetic vibration modes from the resulting motion which contain 88% of the total energy. The rest of the energy is distributed into other higher-order modes which will not be shown here. The first row of Fig. 5 shows the three-dimensional view of Eigen modes at two extreme positions, and the second row shows the corresponding two-dimensional VF configurations at the mid-point. The first Eigen mode represents a mucosal type motion which forms divergent/convergent shape of passage and composes a majority of the up/down motion. It contains 68.56% of the total energy. The second mode primarily represents an medial-later motion which is responsible for glottal opening and closing. It contains 18.51% of the total energy. Through the spectral analysis of the resulting time history of modal coefficients, these empirical modes are found to vibrate at the same frequency, 194.7 Hz, which is also the fundamental phonatory frequency. This is a clear manifestation of 1:1 mode entrainment which has been found in past studies (Berry et al., 1994; Berry et al., 2001).
Figure 5.
(Color online) Two extreme phases of the most energetic two empirical Eigen functions of VF motion. The first row is the three-dimensional view and the two colors represent two extreme phases of each mode. The second row is the corresponding medial profiles at the plane indicated by the black line in the first row; (a) mode-1 (69.56%), (b) mode-2 (18.51%).
Glottal pressure distribution
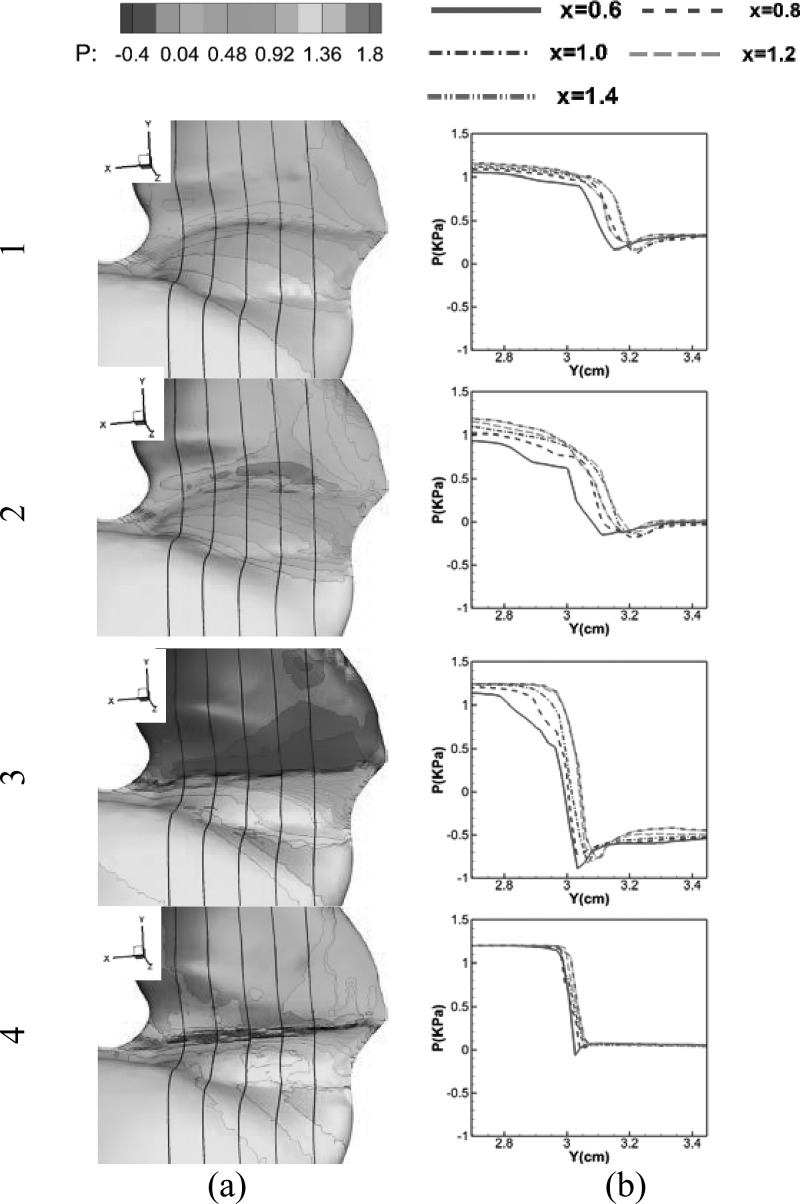
The complex VF vibration pattern is driven by the aerodynamic forces exerted by the glottal flow on the VF surfaces. The temporal and spatial distribution of aerodynamic pressure along with the material properties of the VF tissues, and the spatial constraints determine the VF vibration pattern. Figure 6 shows the surface pressure distributions at four different time instants during one vibration cycle. Figure 6a shows the surface pressure contours on one side of the larynx, and Fig. 6b plots the surface pressures versus vertical location at five anterior-posterior planes where X = 0.6, 0.8, 1.0, 1.2, 1.4 cm are indicated by the solid black lines on the three-dimensional surfaces in Fig. 6a, respectively. Anterior-posterior subglottal pressure asymmetry can be clearly observed through the whole vibration cycle. In general, the subglottal pressure increases from the anterior to posterior throughout the cycle. This pressure variation is mainly due to the subglottal angle variation along the anterior-posterior direction. Figure 7e plots the glottal configuration on the corresponding five planes at the beginning of the cycle. It clearly shows that the subglottal angle increases from the anterior to posterior end. Continuity of the flow, thus, implies a higher local flow velocity at the anterior end. Assuming the same pressure at the glottal inlet, it is concluded that the glottal pressure is lower at the anterior end. As shown in Fig. 6b, this anterior-posterior subglottal pressure difference increases as the glottal velocity increases. The anterior-posterior subglottal difference reaches a maximum value at the maximum opening phase [Fig. 6] and reduces close to 0 when the glottis is closed [Fig. 6].
Figure 6.
(Color online) Glottal surface pressure at four different time instants: (1) 0.107T, (2) 0.321T, (3) 0.5 T, and (4) 0.714T; (a) surface pressure contour, (b) glottal pressure distribution at five planes X = 0.6, 0.8, 1.0, 1.2, and 1.4 cm, respectively.
Figure 7.
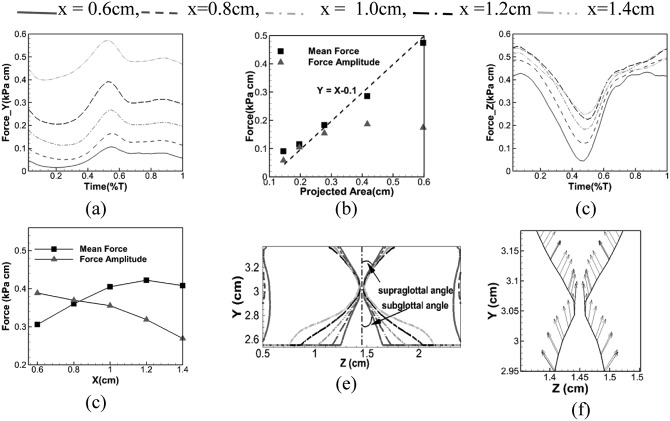
(Color online) Forces and configurations at five planes X = 0.6, 0.8, 1.0, 1.2, and 1.4 cm: (a) phase averaged vertical force, (c) phase averaged lateral force, (b) mean and amplitude of vertical force relative to projected area, (d) mean and amplitude of lateral force relative to location, (e) glottal configuration, (f) glottal surface velocity at the X = 0.8 cm plane at the beginning of one vibration cycle. The projected area in (b) is calculated by projecting the subglottal surface area of the vocal fold onto the XZ plane (horizontal plane).
As flow travels through the glottis, the intra-glottal pressure quickly decreases and reaches its minimum value at the minimum glottal area. After that, pressure starts to recover due to the area expansion. As shown in Fig. 6b, this behavior is consistent along the anterior-posterior direction, and the minimum pressure values do not show a large variation.
In contrast to subglottal pressure, supraglottal pressure only shows a little anterior-posterior variation during the glottal closing phase while it is uniform the along anterior-posterior direction throughout most of the cycle. It suggests that supraglottal pressure is not strongly affected by the subglottal flow condition.
VF dynamics is directly determined by the aerodynamic force which is mainly the combined effect of surface pressures and glottal configurations. In order to assess this effect, the surface force per unit length is calculated at the five vertical planes (as in Fig. 6) by integrating the surface pressure along the tissue surface lines from y = 2.7 cm to y = 3.4 cm. The surface force is a vector with the vertical component and lateral component (y and z components), representing the vertical and lateral forces, respectively, acting on the airway surface. Figures 7a, 7c show the time history of phase averaged vertical (Y) and lateral (Z) forces at the five vertical planes. As seen in Fig. 7a, the vertical force in general decreases from posterior to anterior. This anterior-posterior asymmetry is contributed by two asymmetries: Surface pressure asymmetry and subglottal angle asymmetry. As discussed earlier in Fig. 7e, the subglottal angle increases from the anterior to posterior while the supraglottal angle remains almost same. This geometric difference produces a larger projected area in the XZ plane at the posterior end, which is also the effective loading area of the vertical force. This larger projected area in the XZ plane, along with higher subglottal pressure at the posterior end as discussed above, produces a larger vertical force posterior. This explains why the posterior end is elevated to a higher equilibrium position than the anterior end. To further quantify the effects of the projected area on the vertical force, we plot the projected area versus both the time-averaged and the amplitude of the vertical force on five vertical planes in Fig. 7b. It is interesting to note that the averaged vertical force almost linearly scales with the projected area with a slope of 1 while the amplitude of the force does not. This is a clear indication that the averaged vertical force is mainly determined by the projected area while the amplitude of the force is affected by both projected area and the surface pressure. The vertical force amplitude is larger close to the posterior end, producing an anterior-posteriorly asymmetric vertical motion with the maximum vertical displacement occurring close to the posterior end (X = 1 cm).
The lateral force in Fig. 7c is similar to the vertical force in that it generally decreases from the posterior end to the anterior end throughout the cycle. However, in the lateral direction, the projected forcing area is the same due to the same height of the glottis. Therefore, the observed anterior-posterior asymmetric lateral force distribution is purely caused by the asymmetric surface pressure distribution. Figure 7d shows the mean and amplitudes of lateral force at each longitudinal plane. In general, the mean lateral force increases toward the posterior while amplitude decreases. Thus, the anterior side is expected to have an equilibrium position closer to the center line and the larger vibration amplitude. With this combination, the glottal opening, however, could be either larger or smaller on this side, and it is also affected by the anterior-posterior constraints. To explore the cause of glottal opening asymmetry, we further examined the surface velocity of the glottis at the beginning of the cycle. Figure 7f shows the glottal wall velocity at X = 0.8 cm plane at the beginning of glottal opening. It is interesting to notice a strong inward motion produced at the superior end during the glottal opening phase. We have examined the entire dataset and found this motion is consistent during the glottal opening phase since the first cycle. This inward motion is produced by the upward vertical motion due to the material incompressibility, and it delays the glottal opening. Thus, the larger the vertical displacement is, the stronger the inward motion will occur at the superior end. It will take a longer time for the glottis to open. This explains why the anterior end opens first since the vertical motion is smaller. Thus, we hypothesize that early glottal opening asymmetry is caused by the vertical and lateral motion coupling due to the material incompressibility.
Dynamics of the glottal jet
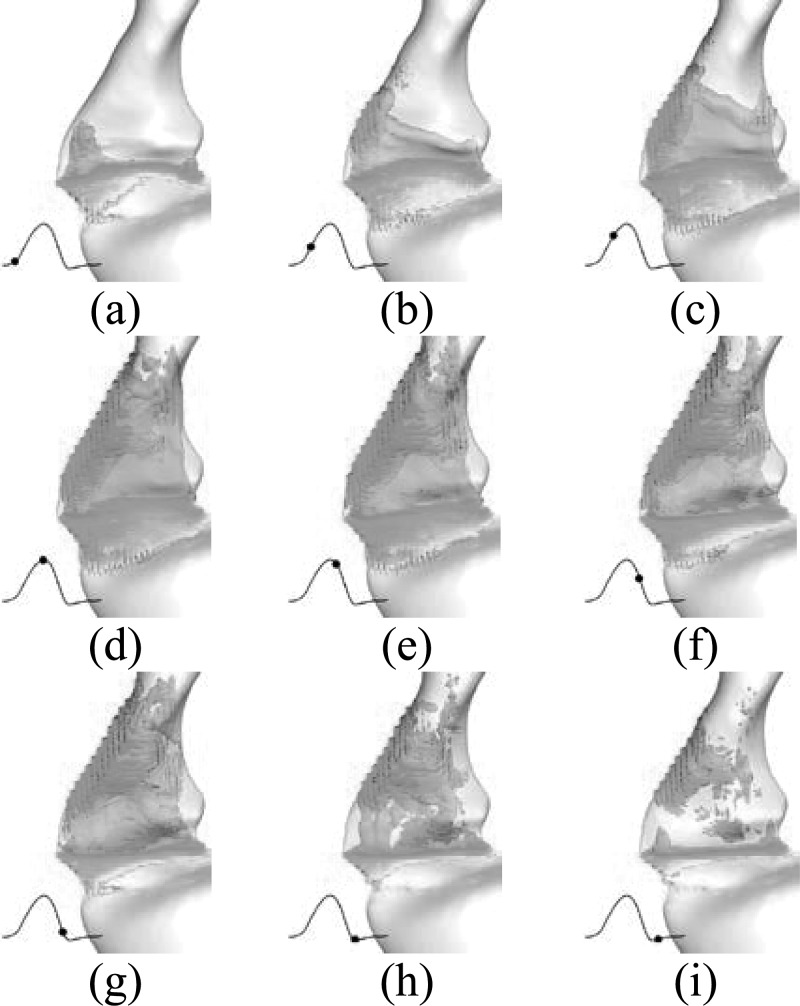
The glottal flow exhibits a variety of interesting phenomena such as jet instability, flow transition, etc., all of which have implications for phonation and the quality of voice. Direct numerical simulation of glottal flow provides the opportunity to perform a detailed analysis of the spatial and temporal features of the flow. Figure 8 shows the iso-surface of vorticity magnitude colored by the pressure contour at nine time instants during one vibration cycle. The corresponding time instant of each subfigure is indicated by the black dot on the volume flow rate superimposed at the left corner. At the beginning of the cycle [Fig. 8a], a glottal jet emanates from the anterior end first due to the earlier opening at this end. As the glottis further opens, the column of the glottal jet at middle and posterior portions increases quickly [Fig. 8b]. It is interesting to observe that the front of the glottal jet is well aligned with the direction of the supraglottal tract during the entire opening phase. At about 0.15T [Fig. 8b], the anterior jet impacts the anterior laryngeal wall, interacts with the wall boundary layer, and forms a local secondary flow separation. This flow separation further expands downstream as glottal flow is accelerating and folds over toward the posterior end during the late opening [Fig. 8c]. Similarly, the posterior glottal jet is also found to start to interact with the posterior laryngeal wall and forms another local flow separation at a little later time. This posterior vortex structures due to the separation folds over in the anterior direction during the following opening phase [Fig. 8d]. At the maximum opening time instant [Fig. 8e], these two vortex structures are almost connected with each other. At this instant, the glottal jet reaches the epiglottis and starts to break down to small-scale structures at the head. During the subsequent closing phase, the glottal jet is further destabilized, although mostly on posterior side, into complex vortex structures composed of small vortices, while the anterior part of the glottal jet remains relatively stable and decelerates gradually. This flow pattern remains until the glottis is fully closed. Then at the beginning of the glottal closed phase, anterior flow is quickly destabilized and dissipated. This temporal glottal flow evolution remains almost the same from cycle to cycle throughout the entire simulation.
Figure 8.
(Color online) Time evolution of the vortical structure (shown by the iso-surface of total vorticity) during one vibration cycle. (a–i) Correspond to nine time-instants. The volume flow rate is superimposed at the left corner of each subfigure and the black dot indicates the corresponding time instant.
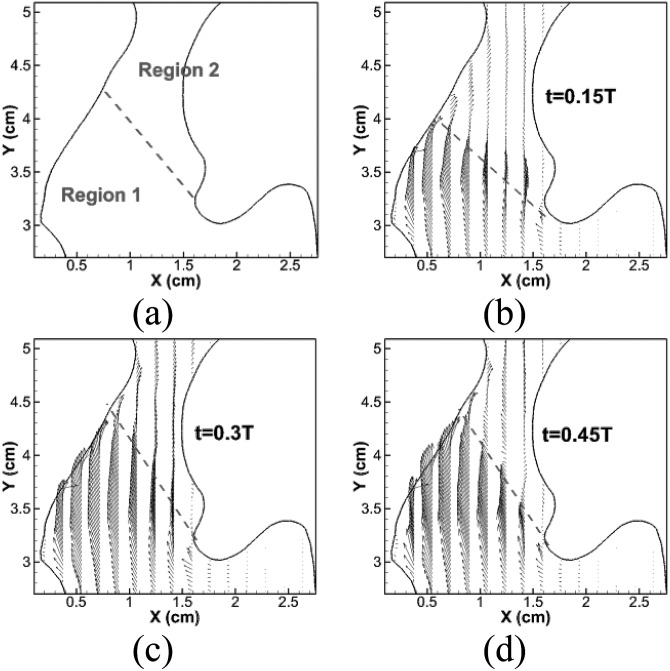
The above observations reveal several interesting flow features which are different from the glottal flow patterns captured in simplified larynx models in previous studies. First, there are clearly two regions inside the supraglottal space where distinct flow behaviors are present. These two regions are schematically shown in Fig. 9. Region 1 is the space between the glottis and the anterior laryngeal wall. Region 2 is the rest of the supraglottal space. To visualize flow behaviors, we compute the phase averaged velocity vector field at the center plane at t = 0.15T, 0.3T, and 0.45T and plot them in Figs. 9b, 9c, 9d. Throughout the glottal opening phase, the kernel of the glottal jet is always located in Region 1. Glottal jet velocity is much higher and the flow direction remains almost uniform inside Region 1. Because of the high speed and strong wall confinement in both anterior and lateral directions, the jet is highly stable and almost retains its original configuration until the end of glottal opening in Region 1. In Region 2, the flow speed is, however, much smaller, and flow directions are less uniform even during the flow increasing phase. This phenomenon is the direct result of the momentum loss when the flow turns at the interface of Regions 1 and 2 in order to exit past the epiglottis. Because of the low speed and non-uniform direction, the glottal flow is less stable in Region 2, so that flow instability first develops inside this region at the maximum opening time instant. Also, it is more prominent in this region during the following glottal closing phase. Thus, in Region 1, flow is mainly characterized by a highly stable jet which remains uniform spatially through the glottal opening phase, while, in Region 2, flow is characterized by the flow direction changing during the flow increasing phase and jet destabilization during the flow decreasing phase. These flow behaviors result from the realistic lumen configuration in which the glottal jet is not vertical and the anterior laryngeal wall produces a strong stream-wise confinement.
Figure 9.
(Color online) (a) Schematic of two flow regions; (b–d) phase-averaged velocity vector fields at lateral center plane at t = 0.15T, 0.3T, and 0.45T, respectively. Velocity vectors are shown on every other two points.
The second finding in our simulation is that the glottal jet is nearly symmetric in the lateral direction, and there is no strong jet deflection observed during the whole cycle. Whether the glottal jet is symmetric or not is a longstanding question in phonation community which can be traced back to the 1980s (Teager and Teager, 1983). Recently, through both numerical (Luo et al., 2008; Tao et al., 2007; Xue et al., 2012; Zheng et al., 2009; Zheng et al., 2011a) and experimental studies (Erath and Plesniak, 2006; Neaubauer and Zhang, 2007; Triep et al., 2005), the glottal jet has been found to be highly asymmetric in the lateral direction inside the simplified straight larynx model and the direction of the jet deflection is stochastic in nature (Erath and Plesniak, 2006; Zheng et al., 2011b). It also has been shown that this jet deflection could have non-negligible effects on the acoustic field (Suh and Frankel, 2007, Zheng et al., 2009). Through our recent numerical analysis in the simplified larynx model (Zheng et al., 2011a; Zheng et al., 2011b), we were able to attribute this jet deflection/asymmetry to the effects of the supra-glottal vortex structure rather than intrinsic intra-glottal “Coanda effects.” However, it should be pointed out that the actual link between jet deflection and sound production is still debated (Erath et al., 2011; Hirschberg, 2013).
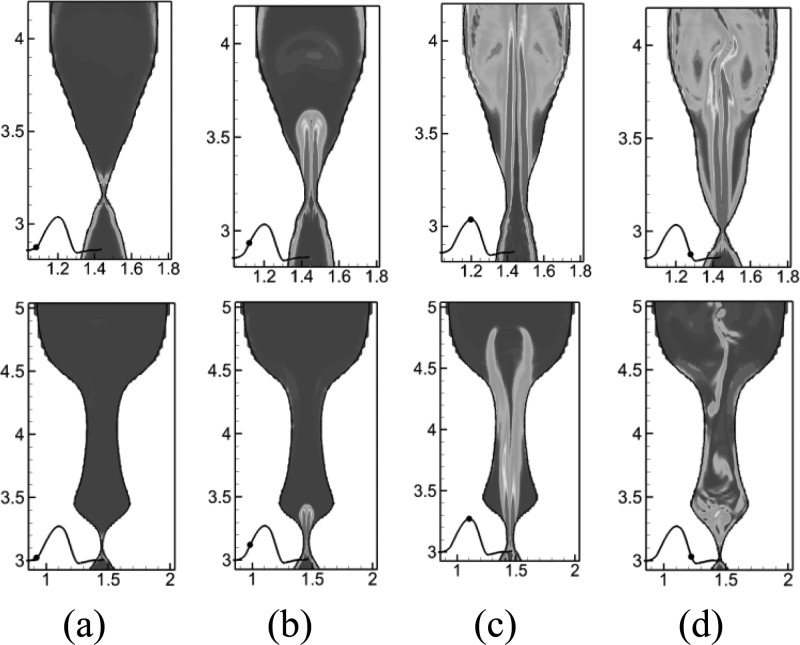
In the current simulation, however, it is interesting to observe that there is no strong jet deflection through the entire cycle. Figure 10 shows total vorticity contours at two planes X = 0.84 cm (mid-longitudinal plane) and X = 1.47 cm (posterior end) at four time instants during one vibration cycle, which are indicated by the black dot on the volume flow rate waveform. On X = 0.84 cm, the glottal jet remains completely symmetric during the glottal opening phase. Slight asymmetry first appears at the front head of the glottal jet at the time instant of maximum volume flow rate. It then becomes stronger during the glottal closing phase, while, however, the majority of the glottal jet still remains straight. This contrasts with previous observations in simplified models that the glottal jet becomes asymmetric at the beginning of the opening stage due to the effects of the remaining supra-glottal vortex structure from the previous cycle. Given the fact that the Reynolds number and overall geometric dimensions (length, glottal gap width, etc.) in the current study are highly similar to previous studies, the difference in flow behavior should be attributed to the realistic lumen shape. The glottal configurations at X = 0.84 cm present several major differences from our previous simplified models: (a) the supra-glottal angle is around 20°, which is much smaller than the one in the simplified model which is close to 90°. This small supra-glottal angle provides a mild gradual expansion, avoiding sudden flow expansion which occurred in simplified models and caused jet instability; (b) the overall expansion rate is much smaller in the current model. The expansion increases along the vertical direction inside the supraglottal space. The averaged expansion ratio from the glottis to Z = 3.4 cm is around 2 at the plane of X = 0.84 cm in the current model, while it is about 20 in the simplified model (Luo et al., 2008, Zheng et al., 2011b) The small expansion ratio indicates a stronger lateral confinement which greatly stabilizes the jet; (c) the current configuration has a streamwise confinement from the anterior laryngeal wall. Flow changes direction after it impacts on the anterior laryngeal wall. The disturbance further downstream will not be able to directly propagate back to the glottis. To summarize, the glottal jet is stable with little deflections in the realistic configuration due to the smaller superior glottal angle, stronger lateral wall confinement, and flow direction change. Thus, previous discussions on jet deflections in simplified models should be interpreted carefully. On the other hand, this symmetric jet also supports our previous hypothesis that the jet asymmetry is caused by the supra-glottal vortex structure rather than an intrinsic “Coanda effect” which would occur despite the supra-glottal configuration.
Figure 10.
(Color online) Contours of total vorticity at four different time instants during one vibration cycle at two different plane: first row X = 0.84 cm, second raw X = 1.47 cm. (a) 0.05T, (b) 0.125T, (c) 0.3T, and (d) 0.55T.
However, a slight jet deflection is observed at the posterior end. Figure 10b shows the total vorticity contours at X = 1.47 cm (posterior end) at four different time instants. The glottal jet remains symmetric during the glottal opening phase. At the instant of maximum volume flow rate, the jet trajectory is slightly distorted and attached to one of false VFs. During the glottal closing phase, the flow is destabilized quickly and develops complex vortex structures. This jet destabilization is mainly due to the small velocity in the posterior end, larger superior glottal space as well as lack of anterior laryngeal wall confinement.
In the past, the majority of phonation studies employed a straight lumen in the vertical direction as well as a sudden flow expansion at superior end. These simplifications produce highly different glottal jet dynamics compared to the realistic model, such as strong jet deflections. Our results imply that the realistic geometric configuration plays a crucial role in glottal flow dynamics and future studies on modeling glottal flow should recognize these effects.
CONCLUSIONS
A direct numerical simulation of flow-structure interaction has been carried out in a subject-specific larynx model to study human phonation under physiological conditions. The resulting glottal flow and waveform are found to be within the normal physiological range. The simulation captures the convergent-divergent vibratory pattern of the VFs and confirms 1:1 mode entrainment of the two most energetic modes of VF motion. Through the numerical simulation, the effects of realistic geometry on VF dynamics and glottal flow have been extensively examined. It is found that the asymmetric anterior-posterior laryngeal configuration produces strong anterior-posterior asymmetries in both vocal fold vibration and glottal flow which has not been captured in simplified models.
With the realistic shape, the subglottal pressure increases from the anterior to posterior throughout the cycle. This pressure variation is mainly due to the subglottal angle variation in the anterior-posterior direction. The subglottal angle increases from the anterior to posterior end. The continuity of the flow and the Bernoulli Effect, thus, implies a higher/lower local flow velocity and lower/higher flow pressure at the anterior/posterior. The VF vibration also presents a strong longitudinal asymmetry in both lateral and vertical directions. A greater vertical motion is observed close to the posterior end due to higher surface pressures and larger projected areas at this end. Because of material incompressibility, the strong vertical motion produces an inward motion at the superior surface of the VF which delays the glottal opening. Thus, the anterior end opens earlier than the posterior end.
The glottal flow presents distinct behaviors in two different supra-glottal regions: the kernel jet region and unstable jet region. In the kernel jet region, which is the space between the anterior laryngeal wall and the glottis, flow is characterized by a stable high speed jet with a uniform flow direction. In the unstable jet region, which is the rest of the space in the supraglottal region, flow is much slower and less stable. In this region, flow behavior is manifested by a direction change during the glottal opening and jet destabilization during the glottal closing phase. With the realistic configuration, it is found that the glottal jet is nearly symmetric in the lateral direction, and there is no strong jet deflection observed in previous simplified models. This symmetric jet is mainly maintained by a gradual glottal expansion, stronger confinement, and stream-wise flow direction change.
At this point, it is important to list the limitations of this study: (a) constraints are applied at both the anterior and posterior ends as well as superior surface of the vocal fold (shown in Fig. 1) which artificially increase the fundamental frequency; (b) the CT scan cannot capture the profile of the inner layers. We approximated the internal configuration based on the histological data. This could have an impact on the vocal fold dynamics; (c) muscle activation is not modeled in the current study. The in-plane vocal fold vibration is modeled by artificially increasing the longitudinal Young's modulus; (d) the Reynolds number is an order of magnitude smaller than the real phonatory Reynolds number; (e) when the glottis is fully closed, there is a two-grid size gap which causes a small amount of flow leakage; and (f) a linear stress-strain relationship is adopted in our study which will not be true during the contact.
The key contributions of the current study are the following: (a) the flow-structure interaction modeling of human phonation is conducted in a subject-specific larynx model; (b) the effects of realistic geometry on VF vibrations and glottal flow are extensively examined for the first time. It is found that the asymmetric anterior-posterior laryngeal configuration produces strong anterior-posterior asymmetries in both vocal fold vibration and glottal flow.
ACKNOWLEDGMENTS
The project described was supported by Grant Number ROlDC007125 from the National Institute on Deafness and Other Communication Disorders (NIDCD). The content is solely the responsibility of the authors and does not necessarily represent the official views of the NIDCD or the NIH.
References
- Alipour, F., Berry, D. A., and Titze, I. R. (2000). “ A finite-element model of vocal-fold vibration,” J. Acoust. Soc. Am. 108, 3003–3012. 10.1121/1.1324678 [DOI] [PubMed] [Google Scholar]
- Becker, S., Kniesburges, S., Muller, S., Delgado, A., Link, G., Kalternbacher, M., and Dollinger, M. (2009). “ Flow-structure-acoustic interaction in a human voice model,” J. Acoust. Soc. Am. 125(3), 1351–1361. 10.1121/1.3068444 [DOI] [PubMed] [Google Scholar]
- Berry, D. A., Herzel, H., Titze, I. R., and Krischer, K. (1994). “ Interpretation of biomechanical simulations of normal and chaotic vocal fold oscillations with empirical eigenfunctions,” J. Acoust. Soc. Am. 95(6), 3595–3604. 10.1121/1.409875 [DOI] [PubMed] [Google Scholar]
- Berry, D. A., Montequin, D. W., and Tayama, N. (2001). “ High-speed digital imaging of the medial surface of the vocal folds,” J. Acoust. Soc. Am. 110(5), 2539–2547. 10.1121/1.1408947 [DOI] [PubMed] [Google Scholar]
- Cook, D. D., Nauman, E., and Mongeau, L. (2008). “ Reducing the number of vocal fold mechanical tissue properties: Evaluation of the incompressibility and planar displacement assumptions,” J. Acoust. Soc. Am. 124(6), 3888–3896. 10.1121/1.2996300 [DOI] [PMC free article] [PubMed] [Google Scholar]
- Duncan, G., Zhai, G., and Scherer, R. (2006). “ Modeling coupled aerodynamics and vocal fold dynamics using immersed boundary methods,” J. Acoust. Soc. Am. 120(5), 2859–2871. 10.1121/1.2354069 [DOI] [PubMed] [Google Scholar]
- Erath, B. D., Peterson, S. D., Zañartu, M., Wodicka, G. R., and Plesniak, M. W. (2011). “ A theoretical model of the pressure field arising from asymmetric intraglottal flows applied to a two-mass model of the vocal folds,” J. Acoust. Soc. Am. 130(1), 389–403. 10.1121/1.3586785 [DOI] [PubMed] [Google Scholar]
- Erath, B. D., and Plesniak, M. W. (2006). “ An investigation of bimodal jet trajectory in flow through scaled models of the human vocal tract,” Exp. Fluids 40, 683–696. 10.1007/s00348-006-0106-0 [DOI] [Google Scholar]
- Farley, J., and Thomson, S. L. (2011). “ Acquisition of detailed laryngeal flow measurements in geometrically realistic models,” J. Acoust. Soc. Am. 130(2), EL82–EL86. 10.1121/1.3609125 [DOI] [PMC free article] [PubMed] [Google Scholar]
- Flanagan, J. F., and Landgraf, L. L. (1968). “ Self-oscillating source for vocal-tract synthesizers,” IEEE Trans. Audio Electroacoust. 16(1), 57–64. 10.1109/TAU.1968.1161949 [DOI] [Google Scholar]
- Hertegard, S., Gauffin, J., and Karlsson, I. (1992). “ Physiological correlates of the inverse filtered flow waveform,” J. Voice. 6(3), 224–234. 10.1016/S0892-1997(05)80147-X [DOI] [Google Scholar]
- Hirano, M., Kurita, S., and Nakashima, T. (1981). “ The structure of the vocal folds,” in Vocal Fold Physiology (University of Tokyo Press, Tokyo, Japan: ), pp. 33–41. [Google Scholar]
- Hirschberg, A. (2013). “ Comments on ‘A theoretical model of the pressure field arising from asymmetric intraglottal flows applied to a two-mass model of the vocal folds’,” J. Acoust. Soc. Am. 134(1), 9–12. 10.1121/1.4807816 [DOI] [PubMed] [Google Scholar]
- Ishizaka, K., and Flanagan, J. L. (1972). “ Synthesis of voiced sound from a two mass model of the vocal cords,” Bell System Tech. J. 51, 1233–1268. 10.1002/j.1538-7305.1972.tb02651.x [DOI] [Google Scholar]
- îSidlof, P., Horacek, J., and Ridky, V. (2013). “ Parallel CFD simulation of flow in a 3D model of vibrating human vocal folds,” Comput. Fluids 80, 290–300. 10.1016/j.compfluid.2012.02.005 [DOI] [Google Scholar]
- îSvec, J. G., and Schutte, H. K. (1996). “ Videokymography: High-speed line scanning of vocal fold vibration,” J. Voice 10(2), 201–205. 10.1016/S0892-1997(96)80047-6 [DOI] [PubMed] [Google Scholar]
- Lamar, M. D., Qi, Y., and Xin, J. (2003). “ Modeling vocal fold motion with a hydrodynamic semicontinuum model,” J. Acoust. Soc. Am. 114(1), 455–464. 10.1121/1.1577547 [DOI] [PubMed] [Google Scholar]
- Link, G., Kaltenbacher, M., Breuer, M., and Döllinger, M. (2009). “ A 2D finite-element scheme for fluid-solid-acoustic interactions and its application to human phonation,” Comput. Methods Appl. Mech. Eng. 198(41–44), 3321–3334. 10.1016/j.cma.2009.06.009 [DOI] [Google Scholar]
- Luo, H., Mittal, R., Zheng, X., Bielamowicz, S., Walsh, R. J., and Hahn, J. K. (2008). “ An immersed-boundary method for flow-structure interaction in biological systems with application to phonation,” J. Comput. Phys. 227, 9303–9332. 10.1016/j.jcp.2008.05.001 [DOI] [PMC free article] [PubMed] [Google Scholar]
- Mittal, R., Erath, B. D., and Plesniak, M. W. (2013). “ Fluid dynamics of human phonation and speech,” Annu. Rev. Fluid Mech. 45, 437–467. 10.1146/annurev-fluid-011212-140636 [DOI] [Google Scholar]
- Mittal, R., and Iaccarino, G. (2005). “ Immersed boundary methods,” Annu. Rev. Fluid Mech. 37, 239–261. 10.1146/annurev.fluid.37.061903.175743 [DOI] [Google Scholar]
- Neubauer, J., and Zhang, Z. (2007). “ Coherent structures of the near field flow in a self-oscillating physical model of the vocal folds,” J. Acoust. Soc. Am. 121, 1102–1110. 10.1121/1.2409488 [DOI] [PubMed] [Google Scholar]
- Rosa, M. O., and Pereira, J. C. (2003). “ A contribution to simulating a three-dimensional larynx model using the finite element method,” J. Acoust. Soc. Am. 114, 2893–2905. 10.1121/1.1619981 [DOI] [PubMed] [Google Scholar]
- Story, B. H., and Titze, I. R. (1995). “ Voice simulation with a body-cover model of the vocal folds,” J. Acoust. Soc. Am. 97(2), 1249–1260. 10.1121/1.412234 [DOI] [PubMed] [Google Scholar]
- Suh, J., and Frankel, S. H. (2007). “ Numerical simulation of turbulence transition and sound radiation for flow through a rigid glottal model,” J. Acoust. Soc. Am. 121, 3728–3739. 10.1121/1.2723646 [DOI] [PubMed] [Google Scholar]
- Tao, C., Zhang, Y., Hottinger, D. G., and Jiang, J. J. (2007). “ Asymmetric airflow and vibration induced by the Coanda effect in a symmetric of the vocal folds,” J. Acoust. Soc. Am. 122(4), 2270–2278. 10.1121/1.2773960 [DOI] [PubMed] [Google Scholar]
- Teager, H., and Teager, S. (1983). “ Active fluid dynamic voice production models, or is there a unicorn in the garden?” in Vocal fold Physiology: Biomechanics, Acoustics, and Phonatory Control, edited by Titze I. R. and Scherer R. C. (Denver Center for the Performing Arts, Denver, CO: ) 387–401. [Google Scholar]
- Titze, I. R. (1973). “ The human vocal cords: A mathematical model part I,” Phonetica 28, 129–170. 10.1159/000259453 [DOI] [PubMed] [Google Scholar]
- Titze, I. R. (2000). Principles of Vice Production (National Center for Voice and Speech, Iowa, City, IA: ), 354 pp. [Google Scholar]
- Triep, M., and Brücker, C. (2010). “ Three dimensional nature of the glottal jet,” J. Acoust. Soc. Am. 127(3), 1537–1547. 10.1121/1.3299202 [DOI] [PubMed] [Google Scholar]
- Triep, M., Brücker, C., and Schroder, W. (2005). “ High-speed PIV measurements of the flow downstream of a dynamic mechanical of the human vocal folds,” Exp. Fluids 39, 232–245. 10.1007/s00348-005-1015-3 [DOI] [Google Scholar]
- Xue, Q., Mittal, R., Zheng, X., and Bielamowicz, S. (2011). “ Sensitivity of vocal-fold vibratory modes to their three-layer structure: Implication for computational modeling of phonation,” J. Acoust. Soc. Am. 130(2), 965–976. 10.1121/1.3605529 [DOI] [PMC free article] [PubMed] [Google Scholar]
- Xue, Q., Mittal, R., Zheng, X., and Bielamowicz, S. (2012). “ Computational modeling of phonatory dynamics in a tubular three-dimensional model of the human larynx,” J. Acoust. Soc. Am. 132(3), 1602–1613. 10.1121/1.4740485 [DOI] [PMC free article] [PubMed] [Google Scholar]
- Zemlin, W. R. (1988). Speech and Hearing Science: Anatomy and Physiology, 3rd ed. (Prentice Hall, Englewood Cliffs, NJ: ), p. 159. [Google Scholar]
- Zemilin, W. R. (1998). Speech and Hearing Science Anatomy and Physiology (Prentice hall; Englewood Cliffs, NJ: ). [Google Scholar]
- Zhang, Z., Neubauer, J., and Berry, D. A. (2007). “ Physical mechanisms of phonation onset: A linear stability analysis of an aeroelastic continuum model of phonation,” J. Acoust. Soc. Am. 122(4), 2279–2296. 10.1121/1.2773949 [DOI] [PubMed] [Google Scholar]
- Zhang, C., Zhao, W., Frankel, S. H., and Mongeau, L. (2002). “ Computational aeroacoustics of phonation, part II: Effects of flow parameters and ventricular folds,” J. Acoust. Soc. Am. 112, 2147–2154. 10.1121/1.1506694 [DOI] [PubMed] [Google Scholar]
- Zheng, X., Bielamowicz. S., Luo, H., and Mittal, R. (2009). “ A computational study of the effect of false vocal folds on glottal flow and vocal fold vibration during phonation,” Ann. Biomed. Eng. 37(3), 625–642. 10.1007/s10439-008-9630-9 [DOI] [PMC free article] [PubMed] [Google Scholar]
- Zheng, X., Mittal, R., and Bielamowicz, S. (2011a). “ A computational study of asymmetric glottal jet deflection during phonation,” J. Acoust. Soc. Am. 129(4), 2133–2143. 10.1121/1.3544490 [DOI] [PMC free article] [PubMed] [Google Scholar]
- Zheng, X., Mittal, R., Xue, Q., and Bielamowicz, S. (2011b). “ Direct numerical simulation of glottal jet and vocal fold dynamics in a three dimensional laryngeal model,” J. Acoust. Soc. Am. 130(1), 404–415. 10.1121/1.3592216 [DOI] [PMC free article] [PubMed] [Google Scholar]
- Zheng, X., Xue, Q., Mittal, R., and Bielamowicz, S. (2010). “ A coupled sharp-interface immersed-boundary-finite-element method for flow-structure interaction with application to human phonation,” J. Biomech. Eng. 132(11), 111003. 10.1115/1.4002587 [DOI] [PMC free article] [PubMed] [Google Scholar]


