Abstract
The purpose of this study was to determine the extent to which cochlear implant (CI) rate discrimination can be improved through training. Six adult CI users took part in a study that included 32 h of training and assessment on rate discrimination measures. Rate difference limens (DLs) were measured from 110 to 3520 Hz in octave steps using 500 ms biphasic pulse trains; the target and standard stimuli were loudness-balanced with the target always at an adaptively lower rate. DLs were measured at four electrode positions corresponding to basal, mid-basal, mid-apical, and apical locations. Procedural variations were implemented to determine if rate discrimination was impacted by random variations in stimulus amplitude or by amplitude modulation. DLs improved by more than a factor of 2 across subjects, electrodes, and standard rates. Factor analysis indicated that the effect of training was comparable for all electrodes and standard rates tested. Neither level roving nor amplitude modulation had a significant effect on rate DLs. In conclusion, the results demonstrate that training can significantly improve CI rate discrimination on a psychophysical task.
INTRODUCTION
Pitch can be conveyed to cochlear implant (CI) users through localized place of stimulation along the auditory nerve and by temporal characteristics of the stimulus waveform. Presently, sound processing strategies use place coding of pitch by stimulating more apically located electrodes with the energy envelope from progressively lower frequency components of sound (Loizou, 1999). Present strategies do not accurately encode temporal pitch, even below 300 Hz, due to channel saturation and strategy artifacts. Strategies have been developed to deliver higher rate temporal information (e.g., van Hoesel and Tyler, 2003; Arnoldner et al., 2007), but these strategies have not yielded significant benefits. It is possible that these strategies need to be refined to encode temporal information more precisely, but it is also possible that implant recipients do not have the capacity to perceive such higher rate temporal cues.
It has been demonstrated by others that increasing stimulation rate produces an increase in perceived pitch, but discrimination performance is generally poor above 300 Hz (e.g., Tong et al., 1982; Shannon, 1983; Tong and Clark, 1985; Townshend et al., 1987; McDermott and McKay, 1997; McKay et al., 2000; Zeng, 2002; Carlyon et al., 2010). There have, however, been a few reports of rate discrimination abilities above 300 Hz. Landsberger and McKay (2005) reported data from six CI users that demonstrated that, while subjects exhibited poor discrimination in the range of 300–1500 Hz, subjects could discriminate between rates above 1500 Hz. They observed, however, that subjects did not always label the perceptual changes as pitch changes. Kong and Carlyon (2010) reported data from two CI users who could discriminate pitch changes up to 800 Hz. They noted that these two subjects exhibited temporal pitch reversals at higher rates in that increases in stimulation rate could elicit a lower pitch percept.
Studies of physiology have shown that the auditory nerve can respond synchronously to electrical stimulation above 1000 Hz (Hartmann et al., 1984; van den Honert and Stypulkowski, 1984; Javel et al., 1987; Javel, 1990; Dynes and Delgutte, 1992); however, it has also been shown that phase-locking is impaired in the auditory nerves of long-term deafened cats (Shepherd and Javel, 1997; Shepherd et al., 2004). In CI users, it is possible that the preceding deafness and the trauma of implantation diminish cochlear status and, consequently, the phase-locking ability of the auditory nerve.
Another possibility is that the auditory system requires an alignment of temporal and place coding to deliver a strong temporal pitch percept. Oxenham et al. (2004) demonstrated the importance of tonotopic representation of temporal encoding using transposed stimuli to present the temporal information of low frequency sinusoids to locations in the cochlea tuned to high frequencies. They found that subjects could not extract the fundamental frequency from multiple low-frequency components presented in this manner, and concluded that alignment of temporal and place encoding is crucial for pitch perception. In addition, recent work by Middlebrooks and Snyder (2009) indicates an auditory pathway specialized for high temporal acuity. Tapping into this specialized pathway may require stimulation of apical nerve fibers which could be done through deep insertion of cochlear arrays or through the use of penetrating intraneural arrays.
Taken together, these reports indicate a perceptual saturation point near 300 Hz above which it becomes difficult to elicit a pitch percept using temporal encoding. The physiological data indicate that the temporal information necessary to make such judgments is present in healthy mammalian physiology, but deteriorates with cochlear damage. With regards to improving hearing for CI users, the observed saturation point might be an insurmountable obstacle. However, it is also possible that such rate-based pitch is a weak percept in normal hearing and may require auditory training to improve CI rate discrimination. If true, then careful encoding and focused training of this “weak” temporal pitch cue might yield perceptual benefits.
This article reports CI rate discrimination performance for six subjects who took part in 32 h of auditory training and assessment. Results were analyzed to determine the extent to which training improves rate discrimination on a basic psychophysical task. Procedural variations were used to determine how rate discrimination was impacted by level roving and by amplitude modulation of the stimuli.
METHODS
Subjects
A total of six adult CI users participated in this study. Subjects provided informed consent on their first visit to the laboratory and were paid for their participation. Relevant information about the subjects is provided in Table TABLE I..
TABLE I.
Subject information.
| Subject | Sex | Ear tested | Etiology | Age at onset of hearing loss/deafness | Age at implantation (years) | Age at time of testing | Implant use (years) | Implant model | Stimulation mode |
|---|---|---|---|---|---|---|---|---|---|
| C1 | M | L | Meningitis | 12-sudden | 13 | 37 | 24 | N22 | BP + 1 |
| C2 | M | R | Noise Induced | 50s-progressive | 71 | 74 | 3 | Freedom | BP + 1 |
| C3 | M | R | Unknown | Birth-sudden | 3 | 23 | 20 | N22 | BP + 2 |
| C4 | M | L | Noise Induced | 50s-progressive | 65 | 81 | 16 | N22 | BP + 3 |
| ME1 | F | L | Unknown | Birth-progressive | 42 | 49 | 7 | PULSAR | Monopolar |
| C5 | F | L | Unknown | Birth-progressive | 21 | 22 | 0.5 | N5 | BP + 2 |
Psychophysical procedures
An initial session was devoted to mapping and loudness balancing of stimuli. The following eight test sessions were conducted with two sessions per week over four weeks. Test sessions 1–7 were devoted to training and assessment of constant level stimuli. Test session 8 was devoted to procedural variations that assessed the effects of level roving and of amplitude modulation.
During the mapping session, subjects' audibility thresholds and maximum comfort levels were measured for a 500 ms, 3520 Hz, biphasic pulse train for four electrode positions corresponding to apical, mid-apical, mid-basal, and basal locations along the electrode array. For Cochlear Corporation CI users, these electrode positions (numbered base to apex) were 1, 8, 15, and 22. Subject C3 could not be comfortably stimulated on electrode 1, so was tested on electrode 3. These subjects were stimulated using a bipolar mode (see Table TABLE I.) with a basal return electrode (except for the most basal electrode which used an apical return electrode). The narrowest bipolar mode that allowed subjects to be tested comfortably with rates between 110 and 3520 Hz and with all phase durations less than 100 μs was selected. Bipolar mode was used when testing subjects with Cochlear Corporation devices as the earlier N22 implants do not support monopolar stimulation. Subject ME1 was a MED-EL implant recipient and was tested on electrodes 1, 4, 9, and 12 using a monopolar stimulation mode. Custom interfaces were used to present stimuli to the Cochlear Corporation (House Ear Institute Nucleus Research Interface: Shannon et al., 1990) subjects and to the MED-EL (Research Interface Box 2, Department of Ion Physics and Applied Physics at the University of Innsbruck, Innsbruck, Austria) subject.
An equal-loudness contour was measured as a function of stimulation rate for each test electrode using phase duration as the controlled variable. This equal-loudness contour was measured using a graphical user interface with seven sliders each controlling a different stimulation rate from 55 to 3520 Hz in octave steps. After adjusting the slider, the subject would hear a 400 ms pulse train the rate of which corresponded to the slider number and the phase duration corresponding to the slider height. Subjects were instructed to adjust all seven sliders to values that were equally loud but comfortable. The resulting values were fit with a 4th-order polynomial which was used in all subsequent procedures to balance loudness.
During test sessions 1–7, the morning period (10 a.m. to 12 p.m.) was devoted to training progressively higher rate discriminations. The training procedure was a two-interval, two-alternative, forced-choice task in which for a given run the rate difference between the standard and target intervals was held constant. The standard stimulus was a 500 ms biphasic pulse train that was linearly ramped on/off using 20 ms rise/fall times. The rate of the standard and target stimuli were adaptive variables and were simultaneously increased (or decreased) by 10% based on a 2-up 1-down (i.e., two correct answers for a 10% increase) decision rule. The target stimulus was the same as the standard except for a lower stimulation rate. The value for this rate difference was [1/2] octaves () during the initial training session; however, subjects could generally work through the procedure from 500 to 3520 Hz using this difference by the second or third training session. Consequently, the rate difference used in subsequent training sessions was gradually decreased, typically stopping at a two semitone () difference. This procedure was implemented using 32 reversals to allow the subject time to work into a range in which they experienced difficulty, and to hold them there, thus providing practice in that range. The four electrode positions (apical, mid-apical, mid-basal, and basal) were trained in random order for equal amounts of time. Feedback as to whether the target interval was correctly identified was always given.
Also during test sessions 1–7, the afternoon period (1 p.m. to 3 p.m.) was devoted to a repeated assessment of rate discrimination using a 2-interval, 2-alternative, forced-choice procedure. The standard stimulus was a 500 ms biphasic pulse train that was linearly ramped on/off using 20 ms rise/fall times. The rate of the standard stimulus was held constant for a given run. The target stimulus was the same as the standard but had an adaptively lower stimulation rate. The initial value of this rate difference was 1-octave (100%) and was decreased (or increased) by 1/ (or ) based on a 2-down 1-up decision rule. The standard stimulation rates tested were 110, 220, 440, 880, 1760, and 3520 Hz. These rates were assessed on each of the four electrode positions yielding a total of 24 conditions. This procedure was implemented using 16 reversals and the rate DL for each condition is reported as the logarithmic average of the last eight reversals. Feedback as to whether the target interval was correctly identified was always given.
During test session 8, the assessment procedure described in the previous paragraph was repeated using stimulus modifications to assess the effects of level roving and of amplitude modulation. For the level roving investigation, the assessment procedure was repeated but randomly varying the standard and target stimulus levels independently for each presentation. For subjects with Cochlear Corporation implants, the amplitudes of the pulse trains were randomized within a range of 12 clinical units1 with the top of this range corresponding to the subjects' comfort levels. For the MED-EL subject, the amplitudes were randomized within a 100 μA range. This randomization was implemented using a uniform distribution.
For the amplitude modulation investigation, the assessment procedure was repeated using a sinusoidal modulator with a 110 Hz frequency and 100% depth (linearly multiplied between audibility thresholds and comfort levels). The task remained the same in that subjects were asked to judge which of the two stimuli was lower in pitch, and that the adaptive variable was the difference between the underlying pulse train carriers. As aliasing between this modulator and the carrier would occur for lower stimulation rates, only standard rates of 880, 1760, and 3520 Hz were tested. This method was included to determine if the presence of the modulator, and its presumably more dominant temporal pitch cue, would affect rate discrimination for the higher-rate carrier.
RESULTS
Loudness balancing
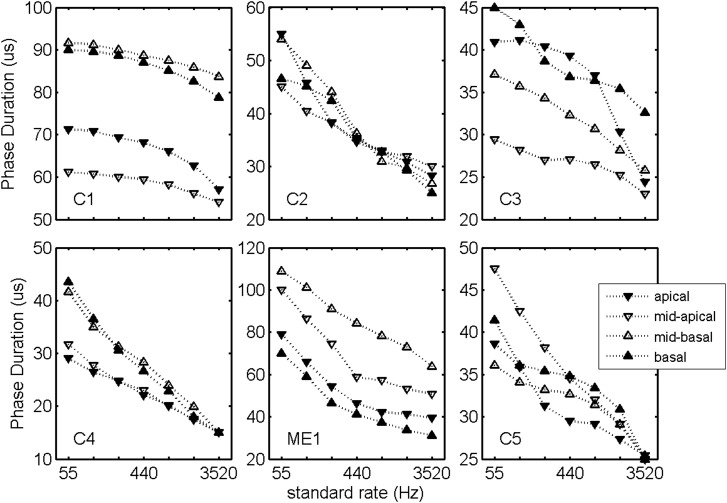
Figure 1 presents the loudness-balanced phase duration versus stimulation rate curves for the tested electrodes. The subjective criterion was to set the phase levels to a loud, but comfortable, level. These loudness-balanced curves were fit using 4th-order polynomials and used to adjust stimulation rate for all subsequent rate discrimination procedures.
Figure 1.
Phase duration plotted as a function of stimulation rate. Phase durations were selected by subjects using a graphic equalizer under the instructions to set the resulting loudness to be loud but comfortable.
Rate discrimination training
The data collected during test sessions 1–7 included rate DLs from six subjects, seven sessions, four electrode positions, and six standard rates. An analysis of variance (ANOVA), including two-factor interactions, was computed based on the logarithm of rate DLs using subject as a random blocking factor and using session, electrode position, and standard rate as fixed factors. Micheyl et al. (2006) provide a rationale for using logarithmic transforms on frequency discrimination thresholds.
Subject was not significant [F(2, 726) = 25.5, p = 0.156] with corresponding geometric means: 9.9% (C1), 13.7% (C2), 13.3% (C3), 9.4% (C4), 18.0% (ME1), and 13.6% (C5). Session was significant [F(6, 726) = 6.1, p < 0.001] with geometric means (in session order): 20.7%, 19.0%, 11.8%, 11.4%, 10.2%, 10.6%, and 9.1%. Electrode position was not significant [F(3, 726) = 1.4, p = 0.274] with corresponding geometric means (ordered apex to base): 12.1%, 10.8%, 14.4%, and 13.6%. Standard rate was significant [F(4, 726) = 27.1, p < 0.0001] with corresponding geometric means (from 110 to 3520 Hz): 4.9%, 6.2%, 13.5%, 23.4%, 31.1%, and 24.5%.
That session was significant and that group means improved from 20.7% to 9.1% over the course of seven sessions is a primary finding of this study as it indicates that subjects could, on average, reduce their DLs on this specific psychophysical task by more than a factor of 2 through directed training. The interaction between session and electrode position was not significant [F(18,726) = 0.6, p = 0.90], nor was the interaction between session and standard rate tested [F(30,726) = 1.3, p = 0.13].
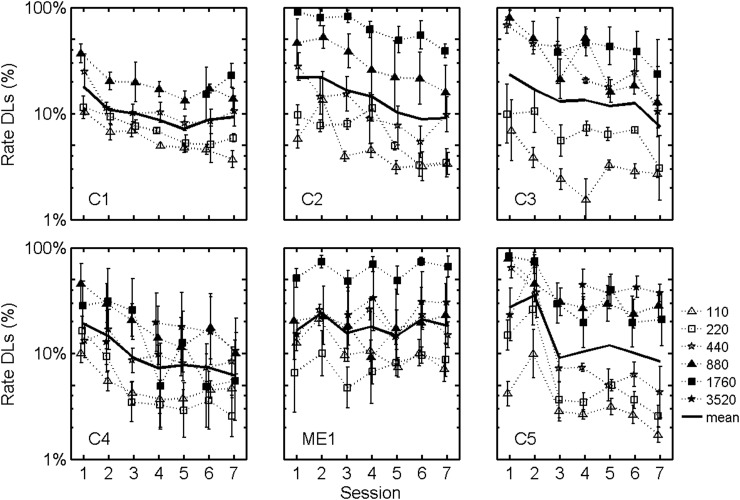
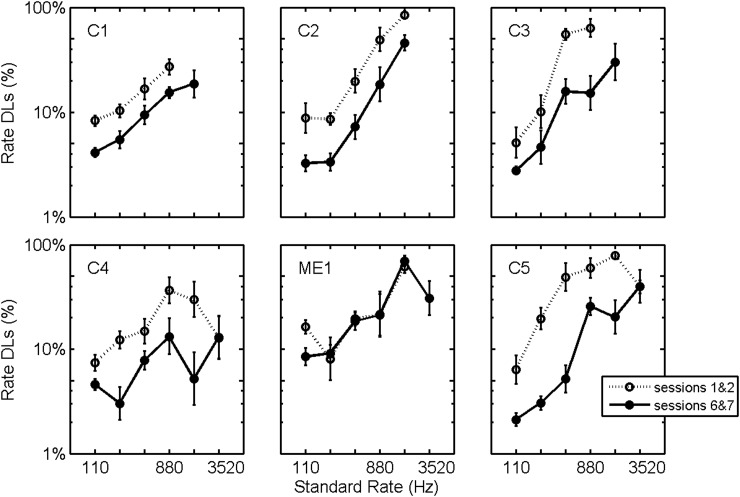
The interaction between session and subject, however, was significant [F(30,726) = 2.43, p < 0.0001]. Figure 2 illustrates this effect with plots of average rate DLs versus test session for each subject. The solid line plots the geometric mean across electrodes and rates for the observed rate DLs. To further illustrate the effects of training, Fig. 3 presents rate DLs for each subject averaged across electrode, rate, and either across the first two test sessions (dotted line) or across the last two test sessions (solid line). On average, the improvement in rate discrimination was approximately a factor of 2, except for subject ME1.
Figure 2.
Rate DLs plotted as a function of test session for each standard rate tested. Individual symbols plot logarithmic averages across electrodes. Solid black lines plot logarithmic averages across electrodes and standard rates. Error bars plot standard errors of the means.
Figure 3.
Rate DLs plotted as a function of standard stimulation rate. DLs are logarithmic averages across electrodes, standard rates, and either across test sessions 1 and 2 (dotted line) or across test sessions 6 and 7 (solid lines). Error bars plot standard errors of the means.
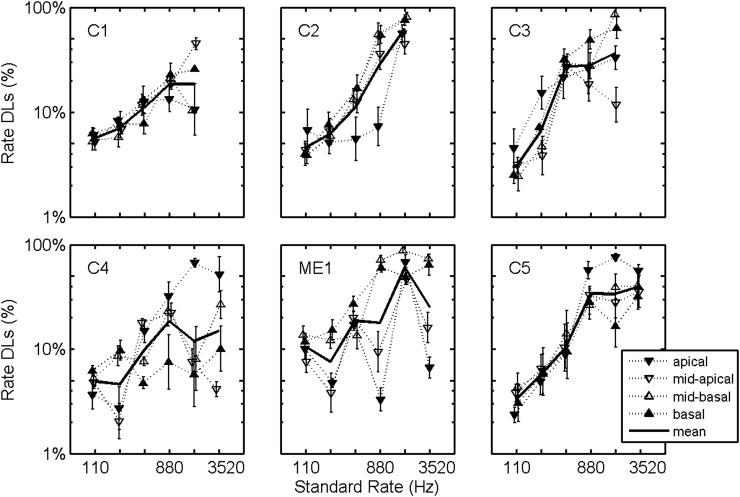
The finding that rate discrimination was not significantly affected by electrode position is consistent with the findings of Baumann and Nobbe (2004), but inconsistent with the findings of Macherey et al. (2011). An important effect to consider is the large across-subject variability and the interaction between subject and electrode position. Specifically, the computed ANOVA indicated a significant interaction between subject and electrode position [F(15,726) = 7.7, p < 0.001]. This interaction is illustrated in Fig. 4 as average difference limens are plotted for each subject for each electrode position. There are significant subject-specific trends; for example, subject C4 performed best on the most basally located electrode. Interestingly, subject C4 was the only subject profoundly deafened at birth.
Figure 4.
Rate DLs as a function of standard stimulation rate with electrode trends plotted. Individual symbols plot logarithmic averages across rates and test sessions 1–7. Solid lines plot corresponding logarithmic averages across electrodes, rates, and test sessions 1–7. Error bars plot standard errors of the means.
Effect of level roving
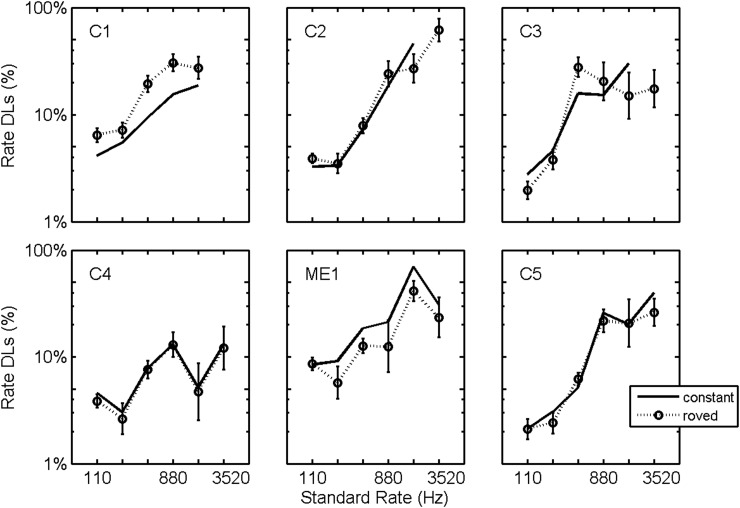
During test session 8, subjects' rate DLs were assessed using the same procedure as during the previous sessions, but using stimuli that were roved in level (roved independently for each standard and target presentation). An ANOVA was computed based on the logarithm of rate DLs using subject as a random blocking factor and using electrode position, standard rate, and roving as fixed factors. The non-roved data used in this analysis was from test sessions 6 and 7.
Roving was not a significant factor [F(1,458) = 0.03, p = 0.86], nor was the interaction between roving and electrode position [F(3,458) = 0.44, p = 0.72] or between roving and standard rate [F(5,458) = 1.2, p = 0.31]. The interaction between roving and subject was found to be significant [F(5,458) = 3.1, p = 0.01] which is illustrated in Fig. 5. On average, the observed DLs are comparable for the roved and non-roved data, but subject C1 performed worse on the roved conditions and subject ME1 performed better on the roved conditions.
Figure 5.
Effect of level roving. Rate DLs plotted as a function of standard stimulation rate for constant level (replotted from Fig. 3) and for roved level (dotted lines) stimuli. Plotted DLs are logarithmic averages across electrodes. Error bars plot standard errors of the means.
Effect of amplitude modulation
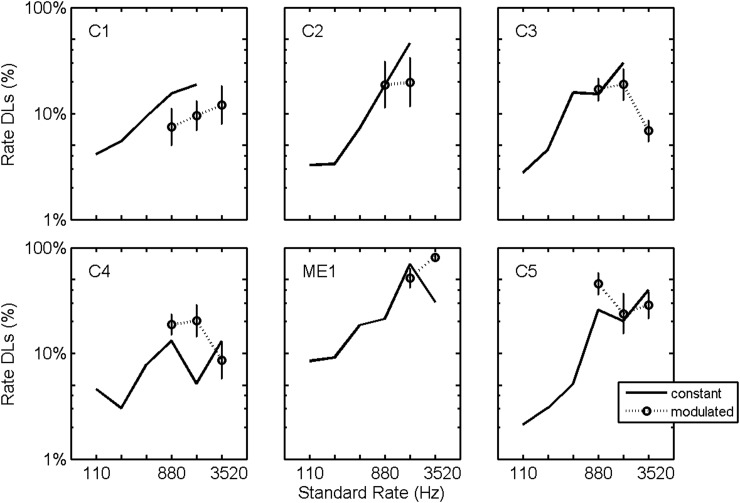
Also during test session 8, subjects' rate DLs were assessed using stimuli that were sinusoidally amplitude modulated. An ANOVA was computed based on the logarithm of rate DLs using subject as a random blocking factor and using electrode position, standard rate, and modulation as fixed factors. The non-modulated data used in this analysis was from test sessions 6 and 7.
Modulation was not significant [F(1,156) = 0.24, p = 0.64], nor was the interaction between modulation and electrode position [F(3,156) = 0.75, p = 0.19] or between modulation and standard rate [F(2,156) = 0.81, p = 0.18]. The interaction between modulation and subject was found to be significant [F(5,156) = 2.6, p = 0.025] which is illustrated in Fig. 6 which plots rate DLs for each subject averaged over electrode and standard rate. On average, the observed DLs are comparable for the modulated and constant-level data, but with subject specific trends. For example, subject C1 performed better on the modulated conditions and subject C4 performed worse on the modulated conditions.
Figure 6.
Effect of sinusoidal amplitude modulation. Rate DLs plotted as a function of standard stimulation rate for constant level (replotted from Fig. 3) and for sinusoidally amplitude modulated (dotted lines) stimuli. Plotted DLs are logarithmic averages across electrodes. Error bars plot standard errors of the means.
DISCUSSION
The results of this study demonstrate that training can improve CI rate discrimination on a basic psychophysical task. With 32 h of training, average rate DLs improved by more than a factor of 2 across subjects, electrodes, and standard rates tested. These results might indicate a latent ability of CI users to extract more information out of stimulation rate cues. However, to establish that argument, studies must be completed that combine auditory training with signal processing solutions. The data from the present study only indicate that discrimination measured by a specific psychophysical task can be improved through training on that task. Furthermore, the study did not include measures to assess the extent to which discrimination gains can be attributed to true perceptual learning as opposed to procedural learning.
While the results demonstrate that training can improve rate discrimination on a basic psychophysical task, enthusiasm should be tempered with a comparison to normal-hearing pitch perception. As a reference, frequency DLs in normal-hearing listeners are generally less than 1% for pure tones between 250 and 4000 Hz (Sek and Moore, 1995; Micheyl et al., 2012). Perhaps a more appropriate comparison is to normal-hearing rate discrimination of bandpass filtered pulse trains, where DLs at low rates are on the order of 4% to 8%, but deteriorating above 300 Hz (Deeks and Carlyon, 2004; Deeks et al., 2013). In contrast, after 32 h of training, the best performing subject in the present study had rate DLs between 5% and 10% for rates above 880 Hz. The most promising data from the present study with regards to the utility of rate encoding of pitch above 500 Hz is that of subject C4 (see Fig. 4) who was able to achieve rate DLs around 2%–5% on two test electrodes at rates of 1760 Hz. While these results demonstrate that training improves CI rate discrimination on a particular psychophysical task, it is unclear whether DLs for these higher rates would ever approach DLs observed in normal-hearing listeners on comparable frequency discrimination tasks. On the other hand, the data presented here indicate that stimulation rate discrimination can be improved for rates less than 400 Hz. Five of the six subjects obtained rate DLs, averaged across electrodes, less than 5% for test rates of 110 and 220 Hz.
In general, the results from the present study coincide with previous studies, but indicate the importance of training when assessing CI rate discrimination. Zeng (2002) found CI rate DLs between 5% and 20% for 100 Hz standard rates. In comparison, average DLs for 110 Hz standard rates in the present study fell within this range for the initial two test sessions; however, average DLs improved, with the best performing subjects (C3 and C5) achieving DLs of 3% and 2%, respectively, by the final test sessions (see Fig. 3). Similarly, Zeng reported DLs at 400 Hz of approximately 25% which coincides with the measured range for the present study for 440 Hz standard rates which ranged between 15% and 50% for the initial sessions, but improved by the final test sessions, with the best performing subject (C5) obtaining an average rate DL of 5%.
Interestingly, our results indicated that level roving of stimuli did not significantly affect discrimination. Previous studies have demonstrated that small differences in level can have a substantial effect on pitch judgments (Shannon, 1983; Townshend et al., 1987; McKay and McDermott, 1998; Arnoldner et al., 2006; Carlyon et al., 2010). The level roving range used in the present study (12 clinical units for Cochlear Corporation CI users and 100 μA for the MED-EL CI user) was sufficiently large compared to level effects observed by others (e.g., Baumann and Nobbe, 2004; Carlyon et al., 2010). One explanation for this robust behavior in the present study is that the prolonged training allowed subjects to perceptually segregate pitch resulting from neural temporal coding in contrast to neural place coding, and that the former may be more robust to level roving.
With respect to the qualitative aspect of the sound, all subjects referred to the pitch associated with higher stimulation rates to be “buzzy” or “brassy”; they indicated that to be successful at increasingly higher stimulation rates they often had to ignore a more high-frequency pure-tonal aspect of the sound and to concentrate on the buzzy quality. All subjects reported that this buzzy quality conveyed pitch, albeit with a buzzy rather than pure-tone quality and that they were completing the task based on a subjective pitch quality. It is possible that these qualitative aspects of their perception correspond to temporal and place coding of pitch and that further training and/or improved signal processing may lead to a synergistic presentation of these different aspects of pitch perception.
Alternatively, it is possible that this buzzy percept is not caused by auditory nerve phase-locking, but by other neural cues such as greater adaptation at higher stimulation rates, changes in the spread of neural excitation with changing rate (McKay and McDermott, 1999), and changes in the amount of neural bursting (Shepherd and Javel, 1997). It is possible that these cues might also explain the results obtained with the subject ME1 tested in monopolar mode who did not improve discrimination through training, since the monopolar mode might produce fewer incidental place cues that co-vary with rate. However, subject ME1 could clearly perform the task at higher rates with DLs of 10% at 3520 Hz when tested on apical electrodes; so whatever neural cue is required for such discrimination is clearly available for that subject.
Regardless of the physiological mechanism that allows for improved rate discrimination, all subjects reported a pitch attributed with increasing rates and demonstrated some ability to use this percept to form discriminations for stimulation rates as high as 3520 Hz.
ACKNOWLEDGMENTS
This research was partially supported by NIH Grants Nos. DC010524-02 and DC001526.
Footnotes
For the Freedom and N5 recipients, the conversion from clinical units to micro-amperes is . For the N22 recipients, the approximate conversion from clinical units to micro-amperes is .
References
- Arnoldner, C., Kaider, A., and Hamzavi, J. (2006). “The role of intensity upon pitch perception in cochlear implant recipients,” Laryngoscope 116, 1760–1765. 10.1097/01.mlg.0000228214.02606.42 [DOI] [PubMed] [Google Scholar]
- Arnoldner, C., Riss, D., Brunner, M., Durisin, M., Baumgartner, W.-D., and Hamzavi, J.-S. (2007). “Speech and music perception with the new fine structure speech coding strategy: preliminary results,” Acta Oto-Laryngol. 127(12), 1298–1303. 10.1080/00016480701275261 [DOI] [PubMed] [Google Scholar]
- Baumann, U., and Nobbe, A. (2004). “Pulse rate discrimination with deeply inserted electrode arrays,” Hear. Res. 196, 49–57. 10.1016/j.heares.2004.06.008 [DOI] [PubMed] [Google Scholar]
- Carlyon, R. P., Deeks, J. M., and McKay, C. M. (2010). “The upper limit of temporal pitch for cochlear-implant listeners: stimulus duration, conditioner pulses, and the number of electrodes stimulated,” J. Acoust. Soc. Am. 127(3), 1469–1478. 10.1121/1.3291981 [DOI] [PubMed] [Google Scholar]
- Deeks, J. M., and Carlyon, R. P. (2004). “Simulations of cochlear implant hearing using filtered harmonic complexes: Implications for concurrent sound segregation,” J. Acoust. Soc. Am. 115, 1736–1746. 10.1121/1.1675814 [DOI] [PubMed] [Google Scholar]
- Deeks, J. M., Gockel, H. E., and Carlyon, R. P. (2013). “Further investigations of complex pitch perception in the absence of a place-rate match,” J. Acoust. Soc. Am. 133, 377–388. 10.1121/1.4770254 [DOI] [PubMed] [Google Scholar]
- Dynes, S. B., and Delgutte, B. (1992). “Phase-locking of auditory-nerve discharges to sinusoidal electric stimulation of the cochlea,” Hear. Res. 58(1), 79–90. 10.1016/0378-5955(92)90011-B [DOI] [PubMed] [Google Scholar]
- Hartmann, R., Topp, G., and Klinke, R. (1984). “Discharge patterns of cat primary auditory fibers with electrical stimulation of the cochlea,” Hear. Res. 13(1), 47–62. 10.1016/0378-5955(84)90094-7 [DOI] [PubMed] [Google Scholar]
- Javel, E. (1990). “Acoustic and electric encoding of temporal information,” in Cochlear Implants. Models of the Electrically Stimulated Ear, edited by Miller J. M. and Spellman F. A. (Springer Verlag, New York: ). [Google Scholar]
- Javel, E., Tong, Y. C., Shepherd, R. K., and Clark, G. M. (1987). “Responses of cat auditory nerve fibers to biphasic electrical current pulses,” Ann. Otol. Rhinol. Laryngol. Suppl. 128, 26–30. [Google Scholar]
- Kong, Y.-Y., and Carlyon, R. P. (2010). “Temporal pitch perception at high rates in cochlear implants,” J. Acoust. Soc. Am. 127(5), 3114–3123. 10.1121/1.3372713 [DOI] [PubMed] [Google Scholar]
- Landsberger, D. M., and McKay, C. M. (2005). “Perceptual differences between low and high rates of stimulation on single electrodes for cochlear implantees,” J. Acoust. Soc. Am. 117(1), 319. 10.1121/1.1830672 [DOI] [PubMed] [Google Scholar]
- Loizou, P. (1999). “Introduction to cochlear implants,” IEEE Eng. Med. Bio. Ma. 18(1), 32–42. 10.1109/51.740962 [DOI] [PubMed] [Google Scholar]
- Macherey, O., Deeks, J. M., and Carlyon, R. P. (2011). “Extending the limits of place and temporal pitch perception in cochlear implant users,” JARO 12, 233–251. 10.1007/s10162-010-0248-x [DOI] [PMC free article] [PubMed] [Google Scholar]
- McDermott, H. J., and McKay, C. M. (1997). “Musical pitch perception with electrical stimulation of the cochlea,” J. Acoust. Soc. Am. 101(3), 1622–1631. 10.1121/1.418177 [DOI] [PubMed] [Google Scholar]
- McKay, C. M., and McDermott, H. J. (1998). “Loudness perception with pulsatile electrical stimulation: The effect of interpulse intervals,” J. Acoust. Soc. Am. 104, 1061–1074. 10.1121/1.423316 [DOI] [PubMed] [Google Scholar]
- McKay, C. M., and McDermott, H. J. (1999). “The perceptual effects of current pulse duration in electrical stimulation of the cochlea,” J. Acoust. Soc. Am. 106, 998–1009. 10.1121/1.428052 [DOI] [PubMed] [Google Scholar]
- McKay, C. M., McDermott, H. J., and Carlyon, R. P. (2000). “Place and temporal cues in pitch perception: are they truly independent?” ARLO 1(September), 25–30. 10.1121/1.1318742 [DOI] [Google Scholar]
- Micheyl, C., Delhommeau, K., Perrot, X., and Oxenham, A. J. (2006). “Influence of musical and psychoacoustical training on pitch discrimination,” Hear. Res. 219(1–2), 36–47. 10.1016/j.heares.2006.05.004 [DOI] [PubMed] [Google Scholar]
- Micheyl, C., Xiao, L., and Oxenham, A. J. (2012). “Characterizing the dependence of pure-tone frequency difference limens on frequency, duration, and level,” Hear. Res. 292(1–2), 1–13. 10.1016/j.heares.2012.07.004 [DOI] [PMC free article] [PubMed] [Google Scholar]
- Middlebrooks, J., and Snyder, R. (2009). “Enhanced transmission of temporal fine structure using penetrating auditory nerve electrodes,” in Association for Research in Otolaryngology, 32nd Midwinter Research Meeting, Baltimore, MD.
- Oxenham, A. V., Bernstein, J. G. W., and Penagos, H. (2004). “Correct tonotopic representation is necessary for complex pitch perception,” Proc. Natl. Acad. Sci. U.S.A. 101, 1421–1425. 10.1073/pnas.0306958101 [DOI] [PMC free article] [PubMed] [Google Scholar]
- Sek, A., and Moore, B. C. J. (1995). “Frequency discrimination as a function of frequency, measured in several ways,” J. Acoust. Soc. Am. 97(4), 2479–2486. 10.1121/1.411968 [DOI] [PubMed] [Google Scholar]
- Shannon, R. V. (1983). “Multichannel electrical stimulation of the auditory nerve in man. I. Basic psychophysics,” Hear. Res. 11(2), 157–189. 10.1016/0378-5955(83)90077-1 [DOI] [PubMed] [Google Scholar]
- Shannon, R. V., Adams, D. D., Ferrel, R. L., Palumbo, R. L., and Grandgenett, M. (1990). “A computer interface for psychophysical and speech research with the Nucleus cochlear implant,” J. Acoust. Soc. Am. 87(2), 905–907. 10.1121/1.398902 [DOI] [PubMed] [Google Scholar]
- Shepherd, R. K., and Javel, E. (1997). “Electrical stimulation of the auditory nerve. I. Correlation of physiological responses with cochlear status,” Hear. Res. 108, 112–144. 10.1016/S0378-5955(97)00046-4 [DOI] [PubMed] [Google Scholar]
- Shepherd, R. K., Roberts, L. A., and Paolini, A. G. (2004). “Long-term sensorineural hearing loss induces functional changes in the rat auditory nerve,” Eur. J. Neurosci. 20, 3131–3140. 10.1111/j.1460-9568.2004.03809.x [DOI] [PubMed] [Google Scholar]
- Tong, Y. C., and Clark, G. M. (1985). “Absolute identification of electric pulse rates and electrode positions by cochlear implant patients,” J. Acoust. Soc. Am. 77(5), 1881–1888. 10.1121/1.391939 [DOI] [PubMed] [Google Scholar]
- Tong, Y. C., Clark, G. M., Blamey, P. J., Busby, P. A., and Dowell, R. C. (1982). “Psychophysical studies for two multiple-channel cochlear implant patients,” J. Acoust. Soc. Am. 71(1), 153–160. 10.1121/1.387342 [DOI] [PubMed] [Google Scholar]
- Townshend, B., Cotter, N., Van Compernolle, D., and White, R. L. (1987). “Pitch perception by cochlear implant subjects,” J. Acoust. Soc. Am. 82(1), 106–115. 10.1121/1.395554 [DOI] [PubMed] [Google Scholar]
- van den Honert, C., and Stypulkowski, P. H. (1984). “Physiological properties of the electrically stimulated auditory nerve. II. Single fiber recordings,” Hear. Res. 14(3), 225–243. 10.1016/0378-5955(84)90052-2 [DOI] [PubMed] [Google Scholar]
- van Hoesel, R. J. M., and Tyler, R. S. (2003). “Speech perception, localization, and lateralization with bilateral cochlear implants,” J. Acoust. Soc. Am. 113(3), 1617. 10.1121/1.1539520 [DOI] [PubMed] [Google Scholar]
- Zeng, F. G. (2002). “Temporal pitch in electric hearing,” Hear. Res. 174(1–2), 101–106. 10.1016/S0378-5955(02)00644-5 [DOI] [PubMed] [Google Scholar]


