

Abstract
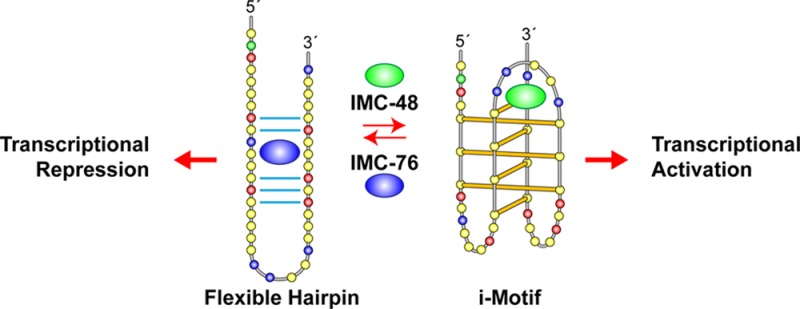
It is generally accepted that DNA predominantly exists in duplex form in cells. However, under torsional stress imposed by active transcription, DNA can assume nonduplex structures. The BCL2 promoter region forms two different secondary DNA structures on opposite strands called the G-quadruplex and the i-motif. The i-motif is a highly dynamic structure that exists in equilibrium with a flexible hairpin species. Here we identify a pregnanol derivative and a class of piperidine derivatives that differentially modulate gene expression by stabilizing either the i-motif or the flexible hairpin species. Stabilization of the i-motif structure results in significant upregulation of the BCL2 gene and associated protein expression; in contrast, stabilization of the flexible hairpin species lowers BCL2 levels. The BCL2 levels reduced by the hairpin-binding compound led to chemosensitization to etoposide in both in vitro and in vivo models. Furthermore, we show antagonism between the two classes of compounds in solution and in cells. For the first time, our results demonstrate the principle of small molecule targeting of i-motif structures in vitro and in vivo to modulate gene expression.
Introduction
DNA secondary structures, such as G-quadruplexes, are proposed to play important roles in cellular processes, including transcription.1 Bioinformatics studies have revealed that G-quadruplex DNA secondary structure–forming sequences are concentrated near transcriptional start sites in the promoter2 and 5′-UTR elements3 as well as in telomeric regions.4 These structures have the potential to form during nuclear processes, such as transcription, when local unwinding of duplex DNA produces negative supercoiling and associated torsional stress.5,6 Specifically, G-quadruplexes are proposed to act as molecular switches that turn transcription on or off.7−9 Consistent with this role as a transcriptional regulatory element, G-quadruplexes within the c-MYC,9c-KIT,10KRAS,11VEGF,12PDGFA,13PDGFR-β,14HIF-1α,15c-MYB,16 and hTERT(17) promoter regions have served as molecular targets for altering gene expression. Recently, Quarfloxin, a first-in-class G-quadruplex-interactive agent, has advanced to clinical trials.8,18 The ability of DNA secondary structures to serve as molecular switches likely involves interaction with transcriptional proteins; NM23-H2/nucleoside diphosphate kinase B19,20 and nucleolin21 recognize and interact with the MYC G-quadruplex to alter transcription. The formation of such DNA secondary structures and their potential role as cis-regulatory elements have been reviewed.7,22,23 Transcriptional repression studies have so far focused on the G-quadruplex as a target.22 In this contribution we demonstrate that the i-motif exists in equilibrium with an unfolded species and that the relative populations of the two species determine the extent of transcriptional activation. Identification of a group of piperidine derivatives and a steroid that bind preferentially to either the i-motif or its unfolded form allows for the external manipulation of the two species populations to modulate gene expression. The antagonism observed between the steroid and the piperidine derivatives in both ex vivo and in vitro experiments emphasizes the importance of this dynamic equilibrium. This contribution provides, as far as we know, the first evidence for control of gene transcription by small molecules that target two alternatively folded forms of DNA in dynamic equilibrium. We also identify a new chemical strategy for therapeutic intervention based on shifting the equilibrium populations of DNA conformational isomers.
The i-motif structure was first characterized in 1993,24 but a potential role in transcriptional regulation has been proposed only recently.6,25−28 Unlike the G-quadruplexes found in promoters that are stable under physiological conditions in single-stranded templates, i-motifs are far more dynamic and only stable at acidic pHs, because the cytosine–cytosine (C–C+) base pair building block requires a hemiprotonated species (Figure 1). Significantly, DNA, but not RNA, can form i-motifs because in DNA there is close contact between the deoxyribose sugars in the narrow groove that can give rise to favorable van der Waals energies.29 Under negative supercoiling conditions, i-motifs can form from duplex DNA and occur even in the absence of a G-quadruplex on the opposite strand.6 Indeed, recently the i-motif and G-quadruplex were found to be mutually exclusive in the insulin-linked polymorphic region.30 Molecular crowding conditions mimicked by single-walled carbon nanotubes have been shown to induce telomeric i-motifs even at pH 8.0.31 Finally, these species exist in a mixture of dynamic structures around their transitional states based on NMR, fluorescence resonance energy transfer (FRET), and differential scanning calorimetry studies.27,32−34 They were found to differ either in the intercalation topology of the C–C+ base pairs or by the coexistence of a partially folded form with the i-motif. At neutral pH the partially folded form can coexist with the single-stranded form.27 We have classified i-motifs found in the natural promoter sequences as class I or II i-motifs, with class I being more stable because of stabilizing interactions in their longer loop regions.26 A recent Tm study on a wider range of presumed promoter i-motifs found this to be generally true, with a single exception, the c-kit C-rich sequence.25
Figure 1.

Diagram of the BCL2 gene promoter region with the GC-rich element located directly upstream of the P1 promoter. The C-rich i-motif-forming sequence is shown with the complementary G-rich quadruplex-forming sequence. Three and one-half sets of two intercalated hemiprotonated cytosine+–cytosine base pairs form the i-motif structure, and three-stacked G-tetrads form the G-quadruplex. The bases in bold correspond to the bases involved in base pairing within each of the structures. Here and in subsequent figures, the yellow, green, red, and blue circles represent the deoxynucleotides cytosine, adenine, guanine, and thymine, respectively.
Evasion of apoptosis, a hallmark of cancer, due to overexpression of BCL2 (B-cell lymphoma gene-2, a pro-survival oncoprotein) has been linked to the development of cancer chemoresistance,35 particularly for those of lymphocytic origin.36−39 Targeting of BCL2 to increase chemotherapeutic efficacy has been explored with approaches ranging from disruption of BCL2 protein–protein interactions with small molecules, such as ABT-236, ABT-737, and ABT-199, to siRNA-mediated knockdown of mRNA transcript levels with Genasense.40,41 As an alternative, this study targets BCL2 transcription directly through interaction of small molecules with a putative cis-regulatory element within the BCL2 promoter region, namely, a partially unfolded i-motif that we call a flexible hairpin.
Directly upstream (∼25 bases) from the BCL2 P1 promoter is a GC-rich element known to form G-quadruplex and i-motif structures (Figure 1). Previous in vitro studies using synthetic oligomers have demonstrated that the BCL2 G-rich promoter element forms three different G-quadruplexes; the major one exhibits a mixed parallel/antiparallel structure.42,43 We have previously demonstrated that the complementary C-rich sequence forms a stable i-motif structure with a high transitional pH of 6.6,28 likely due to stabilizing interactions in the central loop. Here we show that the BCL2 i-motif is highly dynamic, and we demonstrate that the dynamic equilibrium between the putative hairpin and the i-motif can be targeted through binding of a cholestane to the flexible hairpin or a pregnanol derivative that binds to the central loop of the i-motif. These two steroids have opposite effects on BCL2 gene expression. The cholestane derivative, which stabilizes the flexible hairpin, results in repression of BCL2 expression in breast cancer and lymphoma cell lines. This BCL2 repression leads to chemosensitization of lymphoma to etoposide and significant reduction in tumor growth in a Granta-519 lymphoma model in SCID mice.
Results and Discussion
Identification of BCL2 i-Motif- and Hairpin-Interactive Compounds
While G-quadruplexes in cellular DNA are known small-molecule targets, and the in vivo existence of these structures has been authenticated,44 no parallel role for the potential i-motifs on the opposite strand has yet been documented. To address this possibility, we screened for small molecules that could bind to the i-motif or an alternative unfolded form of this secondary structure.
A FRET high-throughput screening assay with a FAM-labeled 5′-end and BHQ1 3′-end BCL2 i-motif promoter sequence (Figure 2A) was used to identify interactive small molecules from the NCI Diversity Set I (1990 compounds) (Supplemental Table 1). This screening assay led to the discovery of BCL2 i-motif–interactive small molecules that either stabilized or destabilized the structure, as indicated by a decrease or increase in fluorescence intensity, respectively (Figure 2B). A compound that decreased fluorescence by about 50% or increased fluorescence by at least 250% was considered a potential “hit.” This cutoff provided an overall i-motif-interactive potential hit rate of 0.7% (14/1990), with 0.5% for i-motif-destabilizing compounds (9/1990), and 0.3% for stabilizing compounds (5/1990). A cholestane derivative, compound NSC 138948 (IMC-48), decreased the FRET signal by about 50% (Figure 2B, left panel), while a pregnanol derivative carrying a benzoxazinyl substituent at C20, NSC 59276 (IMC-76) (Figure 2B, right panel), increased the BCL2 i-motif probe fluorescence by 270%, and these compounds were selected for further characterization. This led to a secondary screening of an additional 14 steroidal compounds from ChemDiv, all of which either increased the FRET intensity or had no effect (eight of the compounds that increased the FRET intensity are shown in Supplemental Table 2). None of these steroidal compounds decreased the FRET signal like compound IMC-48. IMC-48 was selected for its BCL2 i-motif–stabilizing effect. The changes in DNA conformation by IMC-76 and IMC-48 as detected by FRET were confirmed using another probe with FAM and TAMRA instead of BHQ1 by fluorometer spectra analysis (Supplemental Figure 1). In order to evaluate the selectivity of IMC-48 and IMC-76 for the BCL2 i-motif in comparison to other DNA forms, the relative fluorescence intensity was determined alongside a mutant BCL2 i-motif, the i-motifs from the MYC and VEGF promoters, and the corresponding BCL2 G-quadruplex and duplex elements with FAM- and TAMRA-labeled oligomers (Figure 2C and Supplemental Figure 1). The MYC and VEGF i-motifs where chosen because these structures have been reported in the literature.6,45 For both IMC-48 and IMC-76 there was a dose-dependent effect on only the BCL2- and VEGF-promoter i-motifs. However, the calculated Kd values showed that the binding of both IMC-48 and IMC-76 to the BCL2 i-motif was much stronger than that to the VEGF i-motif (Figure 2D). The difference in IMC-48- and IMC-76-induced changes in fluorescence intensity between the experiments shown in Figure 2B,C is due to the different degree of quenching between BHQ1 (strong quencher) and TAMRA (no quenching). In subsequent experiments, IMC-48 and IMC-76 were used as contrasting compounds in parallel ex vivo and in vitro assays to demonstrate a correlation between the differential effects on FRET and the modulation of BCL2 transcription through small molecule interaction with either the i-motif or the equilibrating flexible hairpin.
Figure 2.

Identification and validation of BCL2 i-motif–interactive compounds. (A) Principle of the FRET high-throughput screening assay used to identify compound IMC-76 (right) that destabilizes or unfolds the i-motif and IMC-48 (left) that stabilizes or facilitates the folding. (B) Representative results of high-throughput screening with the NCI Diversity Library. The BCL2 i-motif (1 μM) labeled with FAM and BHQ1 at the 5′- and 3′-ends, respectively, was used for compound screening (5 μM) at pH 5.8. (C) Selectivity of IMC-48 (pH 6.6, left) and IMC-76 (pH 5.9, right) for the BCL2 i-motif (wild-type) over the i-motif mutant, c-MYC i-motif, VEGF i-motif, BCL2 duplex, and BCL2 G-quadruplex probes. Probes were labeled with FAM at the 5′-end and TAMRA at the 3′-end. Fluorescence intensity at 520 nm was normalized to the DMSO (0 equiv) to obtain the relative fluorescence. (D) Comparison of Kd values of IMC-48 (left) and IMC-76 (right) for the BCL2 and VEGF i-motifs, showing that both compounds have higher affinity for the BCL2 i-motif than for the VEGF i-motif.
Comparative 1D NMR of the Imino Region of the BCL2 i-Motif and Its Equilibrating Flexible Hairpin Species Shows That IMC-48 and IMC-76 Redistribute the Populations of the Two Species in Opposite Directions
The 1D NMR of the imino region of the BCL2 i-motif and its equilibrating species are shown in Figure 3A. Significantly, at the transition pH 6.6, species corresponding to a duplex/hairpin and an i-motif were both clearly observed by 1H NMR (Figure 3A, traces 1 and 2). Two clear sets of imino proton signals are observed at around 13 and 15–16 ppm at pH 6.6 at 3 °C (Figure 3A, trace 2). The imino proton peaks at 15–16 ppm are characteristic of the hemiprotonated C–C+ base pairs in an i-motif and indicate the formation of a BCL2 i-motif, while the imino protons at 13 ppm are characteristic of Watson–Crick base pairs in a duplex or hairpin conformation. Thus the duplex/hairpin species appear to be in dynamic equilibrium with the BCL2 i-motif. Two different temperatures were used: a clearer signal of the hairpin conformation can be observed at low temperature, whereas i-motif signals are sharper at high temperature.
Figure 3.
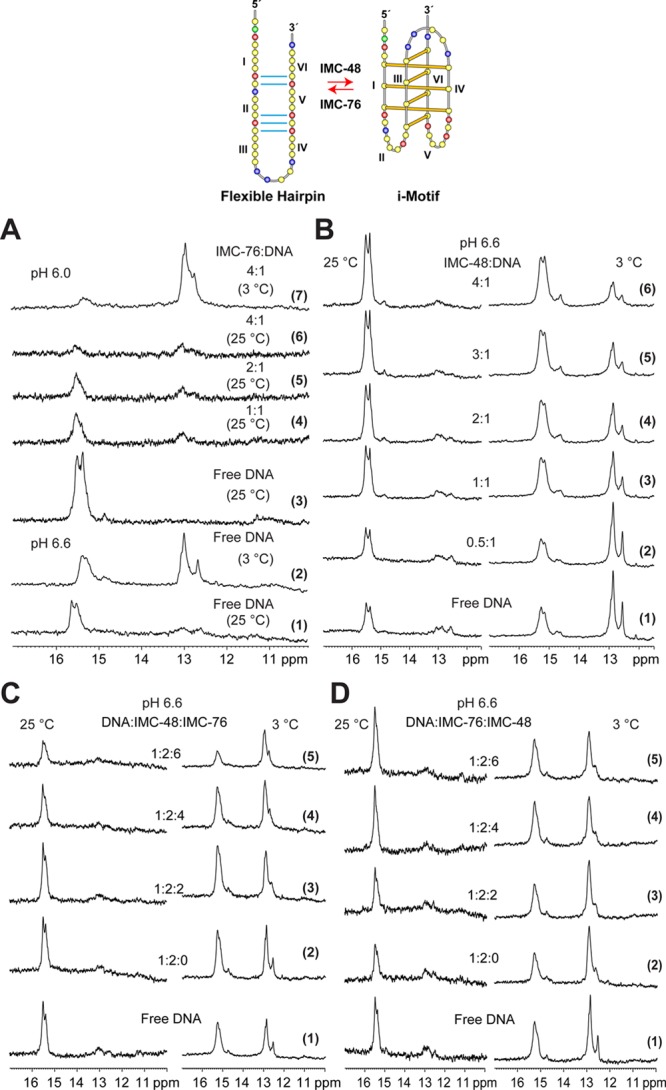
Identification of the two equilibrating species from the BCL2 C-rich strand and effect of IMC-48 and IMC-76 individually and in combination on the population dynamics by NMR. The top panel shows the GC base-pairing (blue lines) of the flexible hairpin (left) and the folding pattern of the i-motif (right). The C-runs are numbered I–VI. (A) The imino proton region of the 1D 1H NMR spectra of free BCL2 i-motif DNA and its titration with different equivalents of IMC-76. Spectra 1 and 2 are free DNA at pH 6.6, 25, and 3 °C, respectively. Spectra 3–7 are recorded at pH 6.0 for free DNA, 1:1, 2:1, and 4:1 IMC-76:DNA complexes at 25 °C, respectively, and for the 4:1 IMC-76:DNA complex again at 3 °C. (B) The imino proton region of the 1D 1H NMR spectra of free BCL2 i-motif DNA and its titration with different equivalents (0.5, 1, 2, 3, and 4) of IMC-48 at pH 6.6, 25 °C (left) and 3 °C (right). (C) The imino proton region of the 1D 1H NMR spectra of free BCL2 i-motif DNA and its complexes with 2 equiv of IMC-48 and different equivalents of IMC-76 at pH 6.6, 25 °C (left) and 3 °C (right). Spectrum 1 is for free DNA; spectra 2–5 are for 1:2 DNA:IMC-48 complexes titrated with increasing amounts of IMC-76, at 0, 2, 4, and 6 equiv, respectively. (D) The imino proton region of the 1D 1H NMR spectra of free BCL2 i-motif DNA and its complexes with 2 equiv of IMC-76 and different equivalents of IMC-48 at pH 6.6, 25 °C (left) and 3 °C (right). Spectrum 1 is for free DNA; spectra 2–5 are for 1:2 DNA:IMC-76 complexes titrated with increasing amounts of IMC-76, at 0, 2, 4, and 6 equiv, respectively.
To directly assess how IMC-76 and IMC-48 affect the i-motif structure, a 1D NMR of the imino region was examined following incremental addition of each of the compounds (Figure 3A,B). Apparent destabilization of the BCL2 i-motif by IMC-76 was observed by NMR; even at pH 6.0, which favors i-motif formation, addition of IMC-76 clearly shifted the equilibrium to the hairpin species (Figure 3A). We call this species a flexible hairpin because direct unfolding of the i-motif from the central loop results in the formation of five Watson–Crick base pairs surrounding an open region, which we propose may be the binding site for IMC-76 (Figure 3, top). NMR titration data showed that at 1 equiv of IMC-76 the BCL2 i-motif signature peaks at ∼15.5 ppm decreased markedly; at 4 equiv they almost completely disappeared (Figure 3A, traces 6 and 7). On the other hand, the flexible hairpin species increased upon IMC-76 addition (Figure 3A, traces 3–6) and is clearly observed at 3 °C (Figure 3A, trace 7). Remarkably, the flexible hairpin species (signature peaks at ∼13 ppm) appeared to be more predominantly populated in the presence of IMC-76 at pH 6.0 (Figure 3A, trace 7) than in the absence of IMC-76 at the transition pH 6.6 (Figure 3A, trace 2). Thus IMC-76 appeared to redistribute the population from the i-motif to the flexible hairpin by stabilizing the population that forms this species (Figure 3A, traces 3–6).
A comparison of NMR traces 2 and 7 in Figure 3A, determined at 3 °C, showed that binding of IMC-76 to the DNA produced very little disruption of the existing hairpin but further populated the flexible hairpin species at the expense of the i-motif, as does increasing the pH from 6.0 to 6.6. IMC-76 has a structural resemblance to a steroidal diamine, which has been shown to bind to unstacked base pairs and stabilize the poly(dA·dT) duplex.46 We propose that IMC-76 binds in the non-Watson–Crick base-paired regions of the flexible hairpin adjacent to the GC bases because they have greater flexibility than the GC base-paired regions. IMC-76 is a lipophilic molecule with limited functionality for H-bonding. Accordingly, there is an entropic cost to keeping it as an isolated molecule in water related to the increased ordering of the water molecules around a species to which they cannot H-bond. Thus, just as in intercalative binding to duplex DNA, binding to the flexible hairpin can minimize the need for contact with water, providing the driving force to support the observed binding. The finding (Figure 3A, trace 7) that the complex has relatively well-resolved 1H NMR signals at ∼13 ppm suggests a well-defined IMC-76–flexible hairpin structure.
In contrast, addition of IMC-48 causes a shift of the equilibrium from the flexible hairpin to the i-motif structure (Figure 3B). NMR titration data at 3 and 25 °C showed that, at the transition pH 6.6, with the incremental addition of IMC-48, the BCL2 i-motif signature peaks at ∼15.5 ppm clearly increased as compared to the flexible hairpin species whose imino proton peaks are between 12 and 13 ppm (Figure 3B, traces 2–6). Again, the i-motif signals are sharper at the higher temperature of 25 °C (Figure 3B, left). Thus IMC-48 appears to redistribute the population from the flexible duplex to the i-motif by stabilizing the i-motif population.
IMC-48 and IMC-76 Show Antagonism by Shifting the Equilibrium between the BCL2 i-Motif and the Flexible Hairpin Structure
NMR competition titration experiments between IMC-48 and IMC-76 were carried out by using a fixed equivalence of IMC-48 and an increasing equivalence of IMC-76 (Figure 3C) or vice versa (Figure 3D) at 25 and 3 °C. The imino proton region shows a clear shift in the equilibrium from the i-motif to the flexible hairpin structure with the incremental addition of IMC-76 to the 2:1 complex of IMC-48 and BCL2 DNA (Figure 3C, traces 2–5). IMC-76 thus clearly shifts the equilibrium to the flexible duplex species, even in the presence of 2 equiv of IMC-48. Conversely, the equilibrium is shifted from the flexible hairpin structure to the i-motif with the incremental addition of IMC-48 to the 2:1 complex of IMC-76 and BCL2 DNA (Figure 3D, traces 2–5); however, the shift in population to the i-motif species induced by IMC-48 (Figure 3D, trace 5) is not as significant as the shift in population to the flexible duplex species induced by IMC-76 (Figure 3C, trace 5). This result suggests that IMC-76 has a stronger effect in redistributing the populations of the two species toward the flexible duplex form. It is noted that the flexible duplex structure is observed only at low temperature, i.e., 3 °C, due to the higher exchange rate with solvent of the imino protons in the flexible duplex form. Therefore, our NMR data clearly demonstrate that IMC-76 and IMC-48 are antagonists to each other in shifting the equilibrium between the BCL2 i-motif and the flexible hairpin structures. Single-molecule experiments in a recently published paper have corroborated this finding.47
Characterization of the Interaction of IMC-48 with the BCL2 i-Motif That Leads to Stabilization of the Structure
Having established by 1D NMR that IMC-76 interacts with the flexible hairpin and IMC-48 interacts with the i-motif, we then set out to further chemically define the binding of these compounds to the two different species. Circular dichroism (CD) analysis was initially carried out to determine the effect of IMC-48 and IMC-76 on the melting points of the BCL2 i-motif. Since the CD signatures for the i-motif and hairpin are very similar, only very small changes were seen upon addition of 1 and 2 equiv of each compound (Supplemental Figure 2). However, the changes were as anticipated: IMC-48 increased the melting point by about 1 °C, whereas IMC-76 decreased it by about 0.5 °C. In addition, IMC-76 and IMC-48 changed the molecular ellipticity in opposite directions: IMC-48 increased the molecular ellipticity, whereas IMC-76 decreased it. Overall, these results suggest that while IMC-48 stabilized the i-motif, IMC-76 bound to an alternative species that was in equilibrium with the i-motif, as previously demonstrated by NMR. The disruption of the i-motif structure by IMC-76 was further confirmed by bromine footprinting, which showed complete loss of protection of the C–C+ base pairs (Figure 4A).
Figure 4.
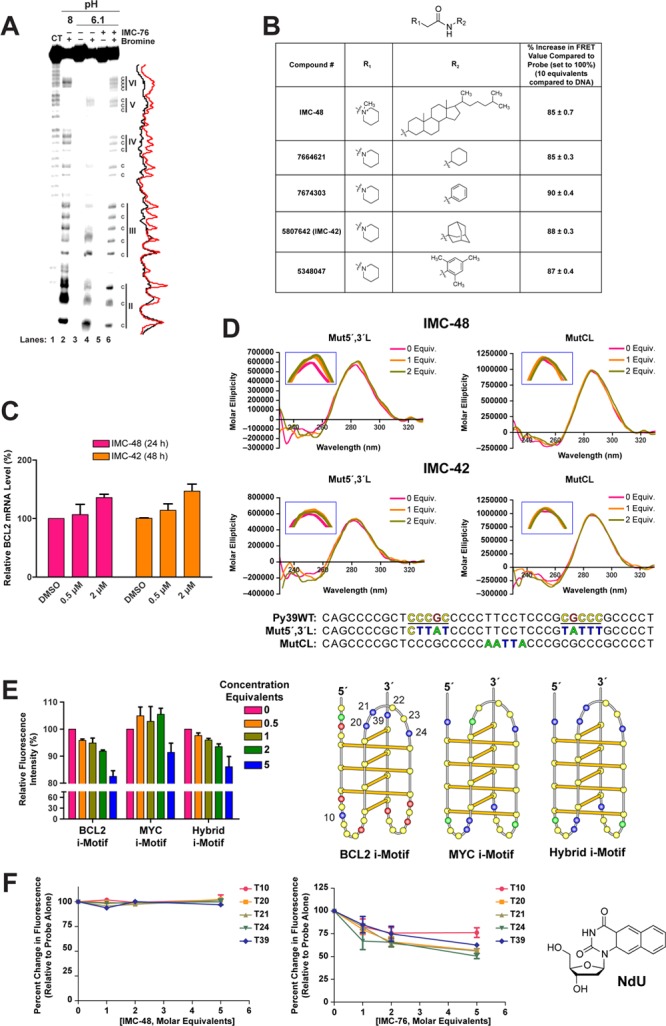
Interaction of IMC-48 and IMC-76 with the BCL2 i-motif. (A) Bromine footprint PAGE analysis of the BCL2 i-motif with and without IMC-76. (B) Chart showing the structures of the pyrimidine mimics in comparison to IMC-48. The comparative FRET and changes in fluorescence are also shown for these compounds relative to IMC-48. (C) BCL2 mRNA levels in BJAB cells in the presence of IMC-48 (left) for 24 h and IMC-42 (right) for 48 h relative to GAPDH. (D) CD spectra of the BCL2 lateral (Mut5′,3′L) and central (MutCL) loop mutant i-motifs with IMC-48 (top) or IMC-42 (bottom). The inset boxes show magnified versions of the region around 280 nm. (E) Results of comparison of binding of IMC-48 to the BCL2, MYC, and BCL2/MYC hybrid i-motifs using the FRET assay performed at pH 6.6 (10 mM Na cacodylate) (left panel). Right panel shows the sequences in the BCL2, MYC, and hybrid i-motifs. In the hybrid i-motif, the central loop sequence of the MYC i-motif was replaced by the central loop sequence of BCL2 i-motif. (F) Left panels shows the percent change in fluorescence emission from the thymine analog substitutions at thymine positions 10, 20, 21, 24, and 39 in the absence or presence of increasing concentrations of IMC-48 (left) and IMC-76 (right). Right panel shows the structure of the fluorescent nucleoside naphthodeoxyuridine (NdU). (E) The BCL2 i-motif folding pattern showing the thymines 10, 20–24, and 39 labeled with NdU.
Since IMC-48 was the only steroid-like compound found by screening the NCI and ChemDiv libraries that appeared to bind to the i-motif, we questioned whether it was the steroid nucleus or a substituent that was responsible for the recognition and binding to the BCL2 i-motif (other nonsteroidal compounds were found to bind to the i-motif, as shown in Figure 2B). The major structural difference between the IMC-76-type compounds and IMC-48 was the positively charged piperidine nucleus that is linked through an amide to the C3 position of the cholestane derivative. Four additional compounds were acquired from ChemBridge that mimicked this C3 substituent (Figure 4B), and these were tested alongside IMC-48 initially in a FRET-based assay. The FRET results using FAM and TAMRA shown in Figure 4B revealed that all four of these compounds produced about the same reduction (10–15%) in FRET value as IMC-48 (15%). We also tested whether one of these compounds (IMC-42 in Figure 4B) that reduced the FRET value also increased BCL2 expression in MCF-7 cells. The results (Figure 4C) show that both IMC-48 and IMC-42 were of equal potency in increasing BCL2 gene expression, but the time course for increasing BCL2 was longer (48 h) for IMC-42 than IMC-48 (24 h). This is not unexpected since IMC-48 is a steroid and is likely to be actively taken up by the cells. The complete effects of IMC-48 and IMC-76 on BCL2 expression are shown in Figure 5B,C).
Figure 5.

BCL2 downregulation and chemosensitization in lymphoma cell lines. (A) Basal BCL2 mRNA levels (left) (*P < 0.0001) and protein expression (right). (B,C) BCL2 mRNA levels in B95.8 (upper), GRANTA-519 (middle), and BJAB (lower) cells in the presence of IMC-76 (B) or IMC-48 (C) (*P < 0.05). (D) Percent caspase-3 activity of B95.8 (upper), GRANTA-519, (middle), and BJAB (lower) cells with IMC-76, etoposide, and ABT-737 relative to untreated (set to 100%) (*P ≤ 0.04). (E) Percent caspase-3 activity of GRANTA-519 cells with IMC-76 and IMC-48 with and without cyclophosphamide (Cytoxan) (*P ≤ 0.04). Significance determined by two-tailed Student’s t-test.
Having established that the piperidine substituent at C3 is likely responsible for the stabilization of the BCL2 i-motif, we next considered where the binding site might be on the i-motif. It seems likely that binding occurs within one of the two lateral loops or in the central loop, as we previously demonstrated that thymines at positions 20, 21, and 24 in the central loop of the i-motif are involved in stacking interactions and may be part of a capping structure that stabilizes the i-motif.28 In further support of the capping structure providing stability to the i-motif, mutations made to bases within the central loop (thymines T20, T21, and T24, and cytosines C22 and C23) produced a less stable i-motif structure (ΔTm = −6 to −8 °C) as compared to that formed by the wild-type sequence (Supplemental Figure 3). This led us to consider whether this loop might be the likely binding site of IMC-48. To test this possibility we used two different mutant i-motifs in which we either mutated both lateral loops (Mut5′,3′L) or the central loop (MutCL). CD measurements showed that while binding of IMC-48 and IMC-42 to the lateral loop mutant i-motifs still increased the molecular ellipticity and shifted the CD maxima to a higher wavelength similar to the wild-type sequence (Supplemental Figure 2), there was no effect on the i-motif with mutations in the central loop (Figure 4D with insets). In addition, we also exchanged the central loops of the BCL2 and MYC i-motifs within each i-motif-forming sequence while retaining the wild-type lateral loop recognition sites for hnRNP LL and hnRNP K, respectively.48 This gives rise to a hybrid i-motif with a BCL2 central loop and MYC lateral loops (Figure 4E). If the central loop sequence is the binding site for IMC-48, then the hybrid i-motif will retain the properties of the wild-type BCL2, while the wild-type MYC will not be affected by addition of this compound. As expected, using the FRET assay we observed that the hybrid i-motif containing the BCL2 central loop retained the binding properties of the wild-type BCL2, but there was a much lower interaction of IMC-48 and the MYC i-motif. However, at the highest concentration tested (5 equiv.) there appears to be some nonspecific binding to the MYC i-motif (Figure 4E, left). These data further implicate the central loop as the binding site for IMC-48 and IMC-42.
To determine the contrasting effects of IMC-48 and IMC-76 on the i-motif structure, a fluorescent nucleoside naphthodeoxyuridine (NdU) (Figure 4F) was used as a probe by substituting for thymines at positions 10, 20, 21, 24, or 39 (numbering in Figure 4E, and sequences in Supplemental Table 1). When IMC-48 was titrated into the i-motif, no significant effects were seen on the fluorescence of any of the NdU-labeled i-motif molecules, leading us to conclude that no significant disruption of the central loop structure occurred. We speculate that the positively charged piperidine ring interacts with a phosphate on the backbone of i-motif DNA and the small ring structure binds in the central loop through stacking interactions to further stabilize the structure and increase the population of this species. In sharp contrast to this result, when IMC-76 was added to all four of the NdU-labeled i-motif species, a significant reduction in fluorescence was observed consistent with a less constrained species, as would be expected with the proposed flexible hairpin species previously identified by NMR.
IMC-48 and IMC-76 Produced Opposite Effects on BCL2 Gene Expression
We assessed the biological effect of the BCL2 i-motif–interactive compounds in three lymphoma cell lines that differentially express BCL2: (1) Epstein–Barr Virus (EBV)–negative parental Burkitt’s lymphoma cells (BJAB), which express little to no BCL2; (2) EBV-infected parental cells (B95.8), which express significantly higher levels of BCL2 and display apoptotic resistance to etoposide;49 and (3) EBV-positive GRANTA-519 mantle cells, which express similar levels of BCL2 to B95.8 cells (Figure 5A). Cells were treated with increasing concentrations of IMC-48 and IMC-76 for 24 h based on the IC50 values to avoid cytotoxicity (Supplemental Figure 4 and Table 3). IMC-76 significantly reduced BCL2 mRNA levels at 0.25 and 0.5 μM in the B95.8 cells by 56% (P = 0.04) and 54% (P = 0.001) (Figure 5B, upper) and to a lesser extent in the GRANTA-519 cells by 23% (P = 0.02) and 33% (P = 0.02) (Figure 5B, middle). BCL2 expression in BJAB cells was unaffected by IMC-76 (Figure 5B, lower) since the basal levels of BCL2 expression are negligible. Downregulation of BCL2 expression was also observed at the protein level (Supplemental Figure 5). In contrast, treatment with IMC-48, the i-motif-interactive compound, resulted in the upregulation of BCL2 gene expression in BJAB cells, with a 220% (P = 0.04) increase at 2 μM, but no significant dose-dependent effect was observed in GRANTA-519 and B95.8 cells (Figure 5C, lower, middle, and upper, respectively). A moderate increase in BCL2 mRNA (65%, P = 0.02) was observed for GRANTA-519 only at the 1 μM dose (Figure 5C, middle). This BCL2 activation in BJAB cells by IMC-48 also occurred at the protein level (Supplemental Figure 5). Results similar to those found in the lymphoma cell lines were found for IMC-76 in breast cancer cell lines that either overexpressed BCL2 or had basal levels of BCL2 (Supplemental Figure 6 and Table 3).
To determine the selectivity of IMC-48 and IMC-76 for targeting BCL2 mRNA transcription, we evaluated their effect on MYC and VEGF mRNA levels in parallel with our previously observed selectivity using FRET as shown in Figure 2C. The results (Supplemental Figure 7) demonstrate that there is no significant effect on these two other genes, which also contain i-motifs in their promoter elements.6,45
IMC-76 Causes Chemosensitization to Etoposide and Cyclophosphamide That Is Inhibited by IMC-48 in Vitro
Repression of BCL2 through transcriptional modulation by IMC-76 should also result in chemosensitization of the etoposide-resistant lymphoma cell line B95.8. The B95.8 cells exhibited resistance to apoptosis following treatment with etoposide alone; however, upon cotreatment with IMC-76 (0.25 μM), caspase-3 activity was significantly increased (2.5-fold, P = 0.03) in B95.8 cells (Figure 5D, upper). A BH-3 mimetic from Abbott Laboratories, ABT-737 (0.25 μM), was used in parallel as a positive control and demonstrated similar chemosensitizing effects (2.2-fold increase, P = 0.03) in the B95.8 cell line (Figure 5D, upper). Similar effects were observed with combination treatment of etoposide with IMC-76 (2.5 fold increase, P = 0.04) or ABT-737 (2.2 fold increase, P = 0.04) in the GRANTA-519 cell line (Figure 5D, middle). There was no significant effect on apoptotic induction by etoposide on the sensitive BJAB parental cell line with IMC-76 or ABT-737 treatment (Figure 5D, lower). It is also important to note that IMC-76 and ABT-737 single treatment, as well as the DMSO vehicle control, did not induce apoptosis relative to untreated controls.
This chemosensitization effect of IMC-76 was also observed using another standard chemotherapy agent, cyclophosphamide (Cytoxan), in the GRANTA-519-resistant lymphoma cell line. Similar to the chemosensitization to etoposide, IMC-76, when combined with cyclophosphamide, induced a significant increase in caspase-3 activity (1.9-fold increase, P = 0.01) compared to cyclophosphamide alone (Figure 5E). To support the antagonistic effect observed on BCL2 expression at the gene and protein levels as well as the shift in DNA secondary structure species equilibrium that occurs in the presence of both IMC-76 and IMC-48, we also treated the cells with IMC-48 alone and with IMC-76 in the presence of Cytoxan. As expected, IMC-48 treatment with Cytoxan did not significantly (P = 0.72) induce caspase-3 activity since this compound stabilizes the i-motif leading to an increase in BCL2 expression (Figure 5E). The differential effect of these two opposing compounds on increasing Cytoxan-induced apoptosis was significant (P = 0.04). When the cells were treated with both compounds concurrently with Cytoxan at a 1:1 ratio, the apoptosis-inducing effect of IMC-76 was diminished by the presence of IMC-48 (P = 0.04) and the caspase-3 activity resembled that of basal levels (Figure 5E). This further demonstrates the antagonistic nature of these two compounds in interacting with the BCL2 i-motif.
IMC-76 Induces Chemosensitivity to Etoposide in a Resistant Lymphoma SCID Mouse Model
In a maximum-tolerated dose study, we evaluated the in vivo efficacy of IMC-76 to downregulate BCL2 expression in severe combined immunodeficient (SCID) GRANTA-519 lymphoma xenograft mice that were treated at fractionated doses of 6, 8, and 10 mg/kg for five days (N = 3). When averaged, the two responsive mice from the 6 and 8 mg/kg treatment group displayed a 20% decrease in BCL2 mRNA levels, while a greater decrease of 48% was found in the 10 mg/kg mice (Figure 6A, left). The BCL2 protein expression was evaluated by Western blot analysis, and a representative blot using lysate from one mouse within each group showing a decrease in BCL2 is shown in Figure 6A, right. A follow-up combination study with the GRANTA-519 xenograft SCID mice (N = 12) revealed that cotreatment of 10 mg/kg IMC-76 and etoposide significantly reduced the tumor burden when compared to etoposide alone (Figure 6B, left). A significant 65% growth inhibition (P = 0.0001) was observed for lymphoid tumors that received concurrent treatment of IMC-76 and etoposide 12 days post last drug administration, while neither monotherapy of etoposide (30%) nor IMC-76 (14%) resulted in a significant reduction in tumor growth. There was no significant weight loss in mice treated with IMC-76 alone or in combination with etoposide (Figure 6B, right).
Figure 6.

BCL2 downregulation and chemosensitization in lymphoma in vivo. (A) BCL2 mRNA levels (left) and BCL2 protein expression (right) of excised GRANTA-519 lymphoid tumors from mice. (B) Tumor burden of GRANTA-519 xenograft mice (left) and mean mouse weight (right).
Conclusion
Our contribution shows that the intrinsic dynamic state of the i-motif and its associated equilibrating flexible hairpin is similar in many respects to the dynamic nature of RNA. As one might anticipate, ligands that bind preferentially to one or another of these equilibrium forms cause a repopulation of the two species. Furthermore, our cellular results with IMC-48 and IMC-76 strongly suggest that this redistribution of two equilibrating DNA species leads to contrasting transcriptional consequences on BCL2 expression. This implicates the potential involvement of proteins, which would also recognize and bind selectively to the i-motif and the flexible hairpin to control gene transcription, similar to the observed effects of IMC-48 and IMC-76. In the companion manuscript,48 a transcriptional factor named hnRNP LL is indeed shown to recognize the BCL2 i-motif and activate transcription. The binding of this protein to the i-motif provides the mechanism for the contrasting effects of IMC-48 and IMC-76. Therefore, taken together these observations make the dynamic equilibrium of the noncanonical DNA structure an attractive target for small molecule control of gene expression.
Materials and Methods
Compounds
The NCI Diversity Set of compounds was obtained from the National Cancer Institute, National Health Developmental Therapeutics Program (Bethesda, MD). Etoposide was purchased from Sigma-Aldrich (St. Louis, MO). Abbott Laboratories (Abbott Park, IL) kindly provided ABT-737. All compounds were dissolved in 100% DMSO to obtain a 10 mM stock concentration based on the molecular weight of each compound.
FRET Assay
For the high-throughput screening, the BCL2 i-motif FRET probe was synthesized by Biosearch (Novato, CA) with a 5′-end FAM-fluorophore and a 3′-end black hole quencher, and for the selectivity test, probes with FAM and TAMRA at each end were synthesized by Eurofins MWG Operon (Huntsville, AL). The sequences are provided in Supplemental Table 1. Probes were prepared and fluorescence was measured as previously described.28 For the high-throughput screen, the BCL2 i-motif probe (1 μM) was incubated with compounds from the NCI Diversity Set (5 μM) at pH 5.8 (50 mM Na cacodylate buffer). Samples were prepared in single wells of the 96-well plate, according to the NCI predetermined plate setup. Interactive compounds were validated by FRET analyses with BCL2 i-motif mutant, MYC i-motif, VEGF i-motif, and BCL2 duplex and G-quadruplex probes with FAM and TAMRA at each end. For the BCL2 duplex, the G-rich probe of BCL2 was annealed with nonlabeled BCL2 i-motif–forming DNA at pH 7.0. The BCL2 G-quadruplex probe was induced by annealing at pH 7.0 with 100 mM KCl. The i-motif-forming probes were diluted to 1 μM at pH 5.9 for IMC-76 and pH 6.3 (10 mM Na cacodylate) for IMC-48. For IMC-48 mimic compounds (Chembridge, San Diego, CA), the BCL2 i-motif probe (1 μM) at pH 6.3 was heated for 5 min at 95 °C and cooled on ice. For the concentration-dependent FRET assay, an equal volume of different concentrations of the compound was added to probes, and the fluorescence intensity at 520 nm was measured by BioTek Synergy HT. DMSO served as a control. The data were corrected with the signal of compounds at the same buffer and normalized to the DMSO to obtain the relative fluorescence intensity. Kd values were determined by binding curve fitting using GraphPad Prism software. To confirm the change at 520 nm induced by conformational change of the oligomer, a PTI (Photon Technology International Inc., Birmingham, NJ) fluorometer was used to measure the spectra between 500 and 700 nm including 520 and 580 nm of emission wavelength of FAM and TAMRA, respectively.
Circular Dichroism
CD analyses were conducted on a Jasco-810 spectropolarimeter (Jasco, Easton, MD) using a quartz cell of 1 mm optical path length, as previously described.28 The BCL2 i-motif–forming oligomers were synthesized by Eurofins MWG Operon or Biosearch Technologies. The BCL2 wild-type oligomer was diluted to a 5 μM strand concentration and incubated with 1 and 2 equiv of IMC-76 and IMC-48 in 10 mM Na cacodylate buffer (pH 6.3) and 50 mM buffer (pH 6.6), respectively. The BCL2 mutants (Mut5′,3′L and MutCL) at 50 mM Na cacodylate (pH 6.3) were heated at 95 °C for 5 min and slowly cooled to room temperature. IMC-48 and IMC-42 were incubated with the oligomers for 20 min prior to CD analysis. The instrument was set to gather spectral data over a wavelength range of 230–330 nm with a scanning speed of 100 nm/min and a response time of 1 s. All spectra were recorded in triplicate, averaged, baseline-corrected for signal contributions from buffers, and smoothed out. Molar ellipticities for melting curves were recorded at 286 nm (the λ of the maximum molar ellipticity). CD spectra were baseline corrected by subtracting a buffer alone or a buffer with compound.
NMR Studies
The DNA oligonucleotide was purchased from Eurofins MWG Operon. The final NMR samples were prepared in 10%/90% D2O/H2O solution at pH 6.0 and 6.6. The concentration of DNA samples was 0.3 mM. The stock solutions of IMC-76 and IMC-48 were dissolved in d6-DMSO. One-dimensional 1H NMR titration experiments were performed on a Bruker DRX-600 MHz spectrometer at temperatures of 25 and 3 °C. The WATERGATE technique was used to suppress the water signal in the 1H NMR experiment.
Naphthodeoxyuridine Fluorescence Assay
The fluorescent thymidine substitute (NdU phosphoramidite) was prepared and incorporated into oligonucleotides as previously described (sequences provided in Supplemental Table 1).50 Strand concentrations were calculated, and fluorescence measurements were conducted as previously described.50 The extinction coefficient used for the NdU was 49 800 M–1 cm–1. The extinction coefficients for each oligomer (T10, T20, T21, T24, and T39) were 328 680 M–1 cm–1. Each probe was placed in a 50 mM Na cacodylate buffer (pH 6.3) at a strand concentration of 10 μM in the absence or presence of compound at increasing molar concentration equivalents. The samples were incubated at 95 °C for 5 min and allowed to cool to room temperature (25 °C) to allow for i-motif formation. The excitation and emission wavelengths were set at 250 and 440 nm, respectively. End point fluorescence or quenching was plotted as the average percent change in fluorescence relative to probe alone of the triplicate wells after correction for background.
Bromine Footprinting
The bromine footprinting assay protocol was adapted from a previously established procedure.51 Briefly, a BCL2 i-motif wild-type oligonucleotide was 5′-end-labeled with [γ-32P] ATP, purified, and incubated with or without IMC-76 (15 μM) in a 50 mM Na cacodylate buffer (pH 6.1). The samples were incubated with molecular Br2 formed in situ by mixing an equal molar concentration (50 mM) of KBr with KHSO5 for 20 min and terminated by the addition of 60 μL of a 0.6 M sodium acetate and calf thymus DNA (10 mg/mL) solution. Any unreacted Br2 was removed in subsequent ethanol precipitation steps. After ethanol precipitation, the DNA pellet was dried and resuspended in 30 μL of a 100 mM piperidine. Samples were heated at 90 °C for 20 min to induce bromination-specific strand cleavage, dried, and resuspended with alkaline sequencing gel loading dye. The bromination-specific strand cleavage was visualized on a sequencing gel (20% PAGE with 7 M urea). A pyrimidine-specific reaction was performed using hydrazine to generate a cytosine-sequencing marker.
Cell Culture
MCF-7, MDA-MB-231, and GRANTA-519 cell lines were purchased from the American Type Culture Collection (Manassas, VA). The MCF-7 tamoxifen-resistant (MCF-7/TAMR) cell line was obtained from the University of Arizona Experimental Mouse Shared Service (Tucson, AZ). BJAB and B95.8 cell lines were provided by Drs. Maria Masucci and Siamak Kamranvar (Karolinska Institute, Stockholm, Sweden). All cell lines were cultured in 10% FBS, 5% penicillin/streptomycin-supplemented RPMI. MCF-7/TAMR cells were also cultured in the presence of tamoxifen. Cells were assessed for viability (>90%) by trypan blue exclusion prior to use for experimental purposes. All cell culture experiments were conducted at 24 h unless otherwise stated. The University of Arizona Genetics Core, using a forensic-style 15 autosomal STR loci including 13 CODIS DNA markers and Amelogenin, last authenticated the BJAB and B95.8 cell lines on August 6, 2010. The GRANTA-519 cell lines were authenticated using a more recent STR analysis including nine autosomal STR loci, Amelogenin, and a mouse-specific locus on July 16, 2012.
Real-Time RT-PCR
Cells were harvested following 24 h treatment with IMC-76 (0.125, 0.25, 0.5 μM), IMC-48 (0.25, 0.5, 1, 2 μM) and 48 h with IMC-42 (0.5, 2 μM). Cells untreated and treated with DMSO vehicle control were used to determine basal BCL2 expression levels. Total RNA was isolated with a Qiagen RNeasy Kit (Valencia, CA) according to the manufacturer’s protocol. Reverse transcription was performed using the QuantiTect reverse transcription kit (Qiagen) or PrimeScript RT Kit with gDNA Eraser (Takara) as per the manufacturer’s protocol. Real-time PCR was conducted using Rotor-Gene Q (Qiagen) or MyCycler (Bio-Rad). Ct values were normalized to either β-actin or GAPDH and compared to the untreated controls. TaqMan probes were used for BCL2 (Hs00153350 or Hs00608023), VEGF (Hs00900055_m1), c-myc (Hs00153408_m1) and GAPDH (Hs02758991) PCR amplification. Samples analyzed with β-actin as a reference gene used the following primer pair: FWD, CTGGAACGGT GAAGGTGACA and REV, AAGGGACTTCCTGTAACAACGCA. For IMC-42 (0.5, 2 μM), real-time PCR was performed using Rotor-Gene Q (Qiagen).
Western Blot Analysis
Expression of BCL2 protein was examined in cell lines at basal levels or following 24 h treatment with IMC-76 or IMC-48. Untreated and DMSO-treated cells were used as controls. Protein lysates were obtained by incubation with RIPA buffer (50 mM Tris-HCl [pH 7.4], 150 mM NaCl, 1% NP40, 0.25% Na deoxycholate, 1 mM PMSF, 1× Roche complete mini protease inhibitor cocktail) followed by sonication and centrifugation at 14 000 rpm for 10 min at 4 °C. Protein concentrations were determined by the BSA assay (Pierce, Rockford, IL). Protein bands were resolved on a precast 10% sodium dodecyl sulfate polyacrylamide gel (Bio-Rad, Hercules, CA) from 40 μg total protein. Protein was then transferred to a polyvinylidene difluoride membrane using the iBlot system for the recommended voltage and time (Invitrogen, Grand Island, NY). Membranes were incubated overnight at 4 °C with monoclonal antibodies targeting BCL2 (Cell Signaling, Dancers, MA) and β-actin (Abcam, Cambridge, MA), which were used at a dilution of 1:1000 and 1:5000, respectively. Fluorescent secondary antibodies (IgG DyLight 800 or 680 conjugated from Thermo Scientific, Rockford, IL) were used, and blots were visualized using the Odyssey Li-Cor Fluorescent Imaging System.
MTS Cytotoxicity Assay
The IC50 values of the compounds for each cell line (MCF-7, MCF-7/TAMR, MDA-MB-231, BJAB, B95.8, and GRANTA-519) were determined by the MTS colorimetric assay as per the manufacturer’s specifications (Promega, Madison, WI).
Caspase-3 Activity Assay
Caspase-3 activity was evaluated using the ApoAlert Caspase-3 Plate Assay as per the manufacturer’s specifications (Clontech, Mountain View, CA).
In Vivo Xenograft Studies
In vivo studies were performed by the University of Arizona Experimental Mouse Shared Service according to the American Association for Laboratory Animal Care guidelines under protocols approved by the University of Arizona Institutional Animal Care and Use Committee and those published by the National Institutes of Health (NIH publication no. 85-23, revised 1985). Every month mice were screened by ELISA serology for mycoplasma, mouse hepatitis virus, pinworms, and Sendai virus. Cells were tested for mycoplasma and viability (>95%) prior to injection (10 × 106 cells/100 μL sterile saline). SCID mice for the MTD study (four groups of N = 3) and the combination study (four groups of N = 12) were injected with GRANTA-519 mantle lymphoma cells subcutaneously in the left flank. IMC-76 and/or etoposide were administered by intraperitoneal injection every day for a total of five days. As tumors developed, SC tumors were measured for tumor volume estimation (cm3 or mm3) in accordance with the formula a2 × b/2, where a equals the smallest diameter and b is the largest diameter. Tumors were only allowed to reach 2000 mm3. The Grubbs’ or maximum normed residual test was used to detect outliers in each treatment group. One outlier was found and excluded from statistical analyses. Significant differences in AUC values were determined using one-way ANOVA.
Statistical Analysis
Statistical significance (P < 0.05) was evaluated using a two-tailed Student’s t-test except for the in vivo study as previously described.52 Data are presented as mean ± standard error from three independent experiments.
Acknowledgments
This research was supported by grants from the National Institutes of Health (GM085585-01 (LHH), GM085585-02S1 (LHH), CA153821 (LHH), T32CA09213 (SLK), GM083117 (SMH). We thank Drs. Maria Masucci and Siamak Kamranvar from the Karolinska Institutet (Stockholm, Sweden) for supplying us with the BJAB and B95.8 cell lines and Abbott Laboratories for providing us with ABT-737. We also thank Dr. David Bishop for his significant contribution to the preparation and editing of the final version of the text and figures displayed in the article.
Supporting Information Available
Sequences, structures, FRET values, fluorescence spectra, CD spectra, cytotoxic potencies, Western blot analyses, mRNA levels, and uncut examples of Western blot gels. This information is available free of charge via the Internet at http://pubs.acs.org.
Author Contributions
† These authors contributed equally.
The authors declare the following competing financial interest(s): The corresponding author and Vijay Gokhale have a financial interest in TetraGene, a biotech company involved in development of drugs that target G-quadruplexes and i-motifs.
Funding Statement
National Institutes of Health, United States
Supplementary Material
References
- Bochman M. L.; Paeschke K.; Zakian V. A. Nat. Rev. Genet. 2012, 13, 770. [DOI] [PMC free article] [PubMed] [Google Scholar]
- Huppert J. L.; Bugaut A.; Kumari S.; Balasubramanian S. Nucleic Acids Res. 2008, 36, 6260. [DOI] [PMC free article] [PubMed] [Google Scholar]
- Huppert J. L.; Balasubramanian S. Nucleic Acids Res. 2005, 33, 2908. [DOI] [PMC free article] [PubMed] [Google Scholar]
- Neidle S. FEBS J. 2010, 277, 1118. [DOI] [PubMed] [Google Scholar]
- Kouzine F.; Gupta A.; Baranello L.; Wojtowicz D.; Ben-Aissa K.; Liu J.; Przytycka T. M.; Levens D. Nat. Struct. Mol. Biol. 2013, 20, 396. [DOI] [PMC free article] [PubMed] [Google Scholar]
- Sun D.; Hurley L. H. J. Med. Chem. 2009, 52, 2863. [DOI] [PMC free article] [PubMed] [Google Scholar]
- Brooks T. A.; Hurley L. H. Nat. Rev. Cancer 2009, 9, 849. [DOI] [PubMed] [Google Scholar]
- Brooks T. A.; Hurley L. H. Genes Cancer 2010, 1, 641. [DOI] [PMC free article] [PubMed] [Google Scholar]
- Siddiqui-Jain A.; Grand C. L.; Bearss D. J.; Hurley L. H. Proc. Natl. Acad. Sci. U.S.A. 2002, 99, 11593. [DOI] [PMC free article] [PubMed] [Google Scholar]
- Bejugam M.; Sewitz S.; Shirude P. S.; Rodriguez R.; Shahid R.; Balasubramanian S. J. Am. Chem. Soc. 2007, 129, 12926. [DOI] [PMC free article] [PubMed] [Google Scholar]
- Cogoi S.; Xodo L. E. Nucleic Acids Res. 2006, 34, 2536. [DOI] [PMC free article] [PubMed] [Google Scholar]
- Sun D.; Liu W. J.; Guo K.; Rusche J. J.; Ebbinghaus S.; Gokhale V.; Hurley L. H. Mol. Cancer Ther. 2008, 7, 880. [DOI] [PMC free article] [PubMed] [Google Scholar]
- Qin Y.; Rezler E. M.; Gokhale V.; Sun D.; Hurley L. H. Nucleic Acids Res. 2007, 35, 7698. [DOI] [PMC free article] [PubMed] [Google Scholar]
- Qin Y.; Fortin J. S.; Tye D.; Gleason-Guzman M.; Brooks T. A.; Hurley L. H. Biochemistry 2010, 49, 4208. [DOI] [PMC free article] [PubMed] [Google Scholar]
- De Armond R.; Wood S.; Sun D.; Hurley L. H.; Ebbinghaus S. W. Biochemistry 2005, 44, 16341. [DOI] [PubMed] [Google Scholar]
- Miyazaki T.; Pan Y.; Joshi K.; Purohit D.; Hu B.; Demir H.; Mazumder S.; Okabe S.; Yamori T.; Viapiano M.; Shin-ya K.; Seimiya H.; Nakano I. Clin. Cancer. Res. 2012, 18, 1268. [DOI] [PMC free article] [PubMed] [Google Scholar]
- Palumbo S. L.; Ebbinghaus S. W.; Hurley L. H. J. Am. Chem. Soc. 2009, 131, 10878. [DOI] [PMC free article] [PubMed] [Google Scholar]
- Drygin D.; Siddiqui-Jain A.; O’Brien S.; Schwaebe M.; Lin A.; Bliesath J.; Ho C. B.; Proffitt C.; Trent K.; Whitten J. P.; Lim J. K.; Von Hoff D.; Anderes K.; Rice W. G. Cancer Res. 2009, 69, 7653. [DOI] [PubMed] [Google Scholar]
- Dexheimer T. S.; Carey S. S.; Zuohe S.; Gokhale V. M.; Hu X.; Murata L. B.; Maes E. M.; Weichsel A.; Sun D.; Meuillet E. J.; Montfort W. R.; Hurley L. H. Mol. Cancer Ther. 2009, 8, 1363. [DOI] [PMC free article] [PubMed] [Google Scholar]
- Thakur R. K.; Kumar P.; Halder K.; Verma A.; Kar A.; Parent J. L.; Basundra R.; Kumar A.; Chowdhury S. Nucleic Acids Res. 2009, 37, 172. [DOI] [PMC free article] [PubMed] [Google Scholar]
- González V.; Guo K.; Hurley L.; Sun D. J. Biol. Chem. 2009, 284, 23622. [DOI] [PMC free article] [PubMed] [Google Scholar]
- Balasubramanian S.; Hurley L. H.; Neidle S. Nat. Rev. Drug Discovery 2011, 10, 261. [DOI] [PMC free article] [PubMed] [Google Scholar]
- Qin Y.; Hurley L. H. Biochimie 2008, 90, 1149. [DOI] [PMC free article] [PubMed] [Google Scholar]
- Gehring K.; Leroy J.-L.; Guéron M. Nature 1993, 363, 561. [DOI] [PubMed] [Google Scholar]
- Brazier J. A.; Shah A.; Brown G. D. Chem. Commun. (Cambridge, U. K.) 2012, 48, 10739. [DOI] [PubMed] [Google Scholar]
- Brooks T. A.; Kendrick S.; Hurley L. FEBS J. 2010, 277, 3459. [DOI] [PMC free article] [PubMed] [Google Scholar]
- Choi J.; Kim S.; Tachikawa T.; Fujitsuka M.; Majima T. J. Am. Chem. Soc. 2011, 133, 16146. [DOI] [PubMed] [Google Scholar]
- Kendrick S.; Akiyama Y.; Hecht S. M.; Hurley L. H. J. Am. Chem. Soc. 2009, 131, 17667. [DOI] [PMC free article] [PubMed] [Google Scholar]
- Collin D.; Gehring K. J. Am. Chem. Soc. 1998, 120, 4069. [Google Scholar]
- Yu Z.; Gaerig V.; Cui Y.; Kang H.; Gokhale V.; Zhao Y.; Hurley L. H.; Mao H. J. Am. Chem. Soc. 2012, 134, 5157. [DOI] [PMC free article] [PubMed] [Google Scholar]
- Li X.; Peng Y.; Ren J.; Qu X. Proc. Natl. Acad. Sci. U.S.A. 2006, 103, 19658. [DOI] [PMC free article] [PubMed] [Google Scholar]
- Dettler J. M.; Buscaglia R.; Cui J.; Cashman D.; Blynn M.; Lewis E. A. Biophys. J. 2010, 99, 561. [DOI] [PMC free article] [PubMed] [Google Scholar]
- Dhakal S.; Schonhoft J. D.; Koirala D.; Yu Z.; Basu S.; Mao H. J. Am. Chem. Soc. 2010, 132, 8991. [DOI] [PMC free article] [PubMed] [Google Scholar]
- Lieblein A. L.; Buck J.; Schlepckow K.; Fürtig B.; Schwalbe H. Angew. Chem., Int. Ed. 2012, 51, 250. [DOI] [PubMed] [Google Scholar]
- Reed J. C.; Miyashita T.; Takayama S.; Wang H.-G.; Sato T.; Krajewski S.; Aimè-Sempè C.; Bodrug S.; Kitada S.; Hanada M. J. Cell. Biochem. 1996, 60, 23. [DOI] [PubMed] [Google Scholar]
- Reed J. C.; Kitada S.; Takayama S.; Miyashita T. Ann. Oncol. 1994, 5, S61. [DOI] [PubMed] [Google Scholar]
- Schmitt C. A.; Lowe S. W. Blood Cells, Mol., Dis. 2001, 27, 206. [DOI] [PubMed] [Google Scholar]
- Tracey L.; Pérez-Rosado A.; Artiga M. J.; Camacho F. I.; Rodríguez A.; Martínez N.; Ruiz-Ballesteros E.; Mollejo M.; Martinez B.; Cuadros M.; Garcia J. F.; Lawler M.; Piris M. Á. J. Pathol. 2005, 206, 123. [DOI] [PubMed] [Google Scholar]
- Vaux D. L.; Cory S.; Adams J. M. Nature 1988, 335, 440. [DOI] [PubMed] [Google Scholar]
- Fulda S.; Galluzzi L.; Kroemer G. Nat. Rev. Drug Discovery 2010, 9, 447. [DOI] [PubMed] [Google Scholar]
- Reed J. C.; Pellecchia M. Blood 2005, 106, 408. [DOI] [PubMed] [Google Scholar]
- Dai J.; Chen D.; Jones R. A.; Hurley L. H.; Yang D. Nucleic Acids Res. 2006, 34, 5133. [DOI] [PMC free article] [PubMed] [Google Scholar]
- Dexheimer T. S.; Sun D.; Fry M.; Hurley L. H. In Quadruplex Nucleic Acids; Neidle S., Ed.; RSC Publishing: Cambridge, 2006, p 180. [Google Scholar]
- Biffi G.; Tannahill D.; McCafferty J.; Balasubramanian S. Nat. Chem. 2013, 5, 182. [DOI] [PMC free article] [PubMed] [Google Scholar]
- Guo K.; Gokhale V.; Hurley L. H.; Sun D. Nucleic Acids Res. 2008, 36, 4598. [DOI] [PMC free article] [PubMed] [Google Scholar]
- Patel D. J.; Canuel L. L. Proc. Natl. Acad. Sci. U.S.A. 1979, 76, 24. [DOI] [PMC free article] [PubMed] [Google Scholar]
- Cui Y.; Koirala D.; Kang H.; Dhakal S.; Yangyuoru P.; Hurley L. H.; Mao H. Nucleic Acids Res. 2014, 10.1093/nar/gku185. [DOI] [PMC free article] [PubMed] [Google Scholar]
- Kang H.-J.; Kendrick S.; Hecht S. M.; Hurley L. H.. J. Am. Chem. Soc. 2014; DOI: 10.021/ja4109352. [DOI] [PMC free article] [PubMed] [Google Scholar]
- Blood A.; Edwards C. J.; Ishii H. H.; Pat B. K.; Bryson G.; Sculley T. B.; Gobe G. C. Arch. Virol. 2004, 149, 289. [DOI] [PubMed] [Google Scholar]
- Akiyama Y.; Ma Q.; Edgar E.; Laikhter A.; Hecht S. M. Org. Lett. 2008, 10, 2127. [DOI] [PubMed] [Google Scholar]
- Ross S. A.; Burrows C. J. Nucleic Acids Res. 1996, 24, 5062. [DOI] [PMC free article] [PubMed] [Google Scholar]
- Flavell D. J. Hematol. Oncol. 1996, 14, 67. [DOI] [PubMed] [Google Scholar]
Associated Data
This section collects any data citations, data availability statements, or supplementary materials included in this article.