
Figure 3.
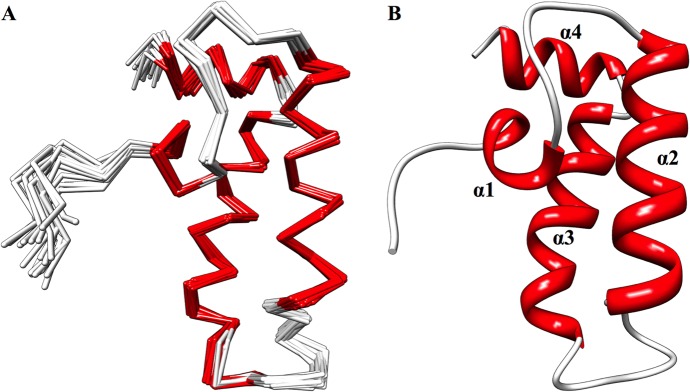
(A) Overlay of the backbone trace of the 20 lowest-energy, water-refined structures. (B) Ribbon representation of the average structure generated from the average atomic coordinates of the 20 lowest-energy, water-refined structures, followed by water refinement of the average structure. Both structures are colored according to secondary structure: red for α-helix and white for loop.