Abstract
Purpose: Monte Carlo methods were used to generate lightly filtered high resolution x-ray spectra spanning from 20 kV to 640 kV.
Methods: X-ray spectra were simulated for a conventional tungsten anode. The Monte Carlo N-Particle eXtended radiation transport code (MCNPX 2.6.0) was used to produce 35 spectra over the tube potential range from 20 kV to 640 kV, and cubic spline interpolation procedures were used to create piecewise polynomials characterizing the photon fluence per energy bin as a function of x-ray tube potential. Using these basis spectra and the cubic spline interpolation, 621 spectra were generated at 1 kV intervals from 20 to 640 kV. The tungsten anode spectral model using interpolating cubic splines (TASMICS) produces minimally filtered (0.8 mm Be) x-ray spectra with 1 keV energy resolution. The TASMICS spectra were compared mathematically with other, previously reported spectra.
Results: Using paired t-test analyses, no statistically significant difference (i.e., p > 0.05) was observed between compared spectra over energy bins above 1% of peak bremsstrahlung fluence. For all energy bins, the correlation of determination (R2) demonstrated good correlation for all spectral comparisons. The mean overall difference (MOD) and mean absolute difference (MAD) were computed over energy bins (above 1% of peak bremsstrahlung fluence) and over all the kV permutations compared. MOD and MAD comparisons with previously reported spectra were 2.7% and 9.7%, respectively (TASMIP), 0.1% and 12.0%, respectively [R. Birch and M. Marshall, “Computation of bremsstrahlung x-ray spectra and comparison with spectra measured with a Ge(Li) detector,” Phys. Med. Biol. 24, 505–517 (1979)], 0.4% and 8.1%, respectively (Poludniowski), and 0.4% and 8.1%, respectively (AAPM TG 195). The effective energy of TASMICS spectra with 2.5 mm of added Al filtration ranged from 17 keV (at 20 kV) to 138 keV (at 640 kV); with 0.2 mm of added Cu filtration the effective energy was 9 keV at 20 kV and 169 keV at 640 kV.
Conclusions: Ranging from 20 kV to 640 kV, 621 x-ray spectra were produced and are available at 1 kV tube potential intervals. The spectra are tabulated at 1 keV intervals. TASMICS spectra were shown to be largely equivalent to published spectral models and are available in spreadsheet format for interested users by emailing the corresponding author (JMB).
Keywords: x-ray spectral model, tungsten anode, Monte Carlo, diagnostic radiology, mammography, orthovoltage radiation therapy
INTRODUCTION
X-ray spectral models are useful in a number of clinical and research applications in medical physics and other x-ray fields as well. X-ray spectra are necessary in the numerical evaluation of image quality, and for computation of x-ray dose in mammography, radiography, fluoroscopy, and computed tomography (CT). Beyond medical physics, x-ray systems are used in airport security for scanning passengers, carry-on luggage, and cargo. X-ray systems (CT and projection imaging systems) are useful in nondestructive testing applications, and in many of these applications the x-ray tube potentials extend beyond the typical ∼140 kV maximum that is used in diagnostic imaging. Examples of nondestructive testing include pipeline evaluation, munitions testing, mechanical parts evaluation, soil core analyses, and airframe structural analysis. X-ray systems are also used for sterilization, for example, in blood irradiation systems and mail handling.
There have been a number of attempts to develop analytical or computer-based models going back to Kramer in 1923.1 Previous work in our laboratory led to the introduction of the tungsten anode spectral model using interpolating polynomials (TASMIP),2 which has enjoyed widespread use since its development in 1997. Despite its utility, the TASMIP model has several limitations: (1) The model was derived from measured x-ray spectra which were binned to 2 keV intervals, and therefore has relatively low energy resolution; (2) The model was derived from measured x-ray spectra for CT, which were already filtered significantly—this prevents the generation of x-ray spectra with substantially less inherent filtration; (3) Two versions of TASMIP were reported, and these addressed tube potentials from 20 to 42 kV (minimally filtered),3 and from 30 to 140 kV (filtered with ∼1.6 mm Al).2 Today, dual energy mammography and tomosynthesis applications are using tungsten anode spectra up to 49 kV with exotic filters (Ag, Pd, etc.), and the two previous TASMIP models do not serve these new imaging applications. The TASMICS spectra fill this gap; (4) The data provided by TASMICS are readily available in spreadsheet format, providing easy access to scientists without requiring computer programming; and finally (5) the maximum tube potential for the TASMIP model was 140 kV, and in many applications outside of medical imaging, higher potential spectral models provided here will likely be useful.4, 5, 6
The limitations of the TASMIP model have provided inertia for the development of a new spectral model that has higher energy resolution, is capable of producing essentially unfiltered spectra, and extends considerably the range of tube potentials for available spectra. This new model is the topic of this investigation.
METHODS
MCNPX simulation geometry and data processing
Tungsten anode x-ray spectra were simulated using the Monte Carlo N-Particle eXtended radiation transport code (MCNPX 2.6.0).7 A conventional x-ray tube design was used for the simulation geometry, including a tungsten/rhenium anode, an electron source and a 0.8 mm thick beryllium exit window. The electron source was defined in MCNPX as a two-dimensional ∼9.8 mm × 1.0 mm planar source with uniform weighting in the y-z plane [Fig. 1a]. The long axis of the source was placed parallel to the z-axis and located 10 mm away from the anode, projecting an actual focal spot size of 10 mm × 1.0 mm on the anode, with an effective focal spot size of ∼2.0 mm × 1.0 mm as viewed from the imaging (x-y) plane [Figs. 1b, 1c]. For the scope of this study, a constant potential for accelerating source electrons from cathode to anode was simulated corresponding to a constant potential generator (zero-voltage ripple).2 A wedge macrobody specification in MCNPX was used to define the anode composed of tungsten (95% by weight) and rhenium (5% by weight) at an angle of 12° with respect to the z-axis. TASMIP,2 which was based upon seminal laboratory measurements performed by Fewell et al. in the early 1980s,8 utilized an anode composed of tungsten (90% by weight) and rhenium (10% by weight). Given that modern tungsten anode compositions vary in the amount of rhenium, depending on manufacturer/model and specific application, the present choice of rhenium (5% by weight) is simply the average of the TASMIP composition and no rhenium. The tungsten anode and electron source were enclosed together on five sides by a 1.0 mm thick MCNPX-defined cell. The remaining side of the anode/electron source enclosure contained a 0.8 mm thick beryllium exit window and was placed parallel to the x-y plane, see Fig. 1a. Photon and electron importance was set to zero for the five 1.0 mm thick sides of the anode/electron source enclosure so that all radiation not travelling through the beryllium exit window was no longer transported, reducing computational time.
Figure 1.
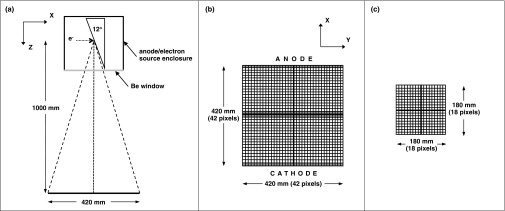
(a) Two-dimensional representation of geometry used in Monte Carlo simulation for modeling x-ray tube. The diagram includes the tungsten anode, electron, source, anode/source enclosure, beryllium window and x-ray tube field of view. (b) A schematic of the 420 mm × 420 mm simulated imaging grid, with a 10 mm × 10 mm, pixel resolution, showing orientation of anode-cathode axis and gray regions used for heel effect analysis. (c) A schematic of the 180 mm × 180 mm scoring plane used for, generating TASMICS spectra and for comparison with previously reported spectra. Diagrams not drawn to scale.
Simulating the process of x-ray production requires tracking a large number of electrons as they interact with the target, producing bremsstrahlung and fluorescence x-rays. Both photon and electron transport were tracked for this simulation (mode: P, E). Physical parameters can be biased in MCNPX using two cards (PHYS:E and PHYS:P) to improve the computational efficiency of electron and photon transport by simplifying some of the physics that is not of importance for the given simulation energy range. Coherent scattering is highly peaked in the forward direction and could become undersampled in the simulations resulting in adverse effects on both the tally and variance.9 Consequently, coherent scattering was turned off on the PHYS:P card. In addition, the upper limit for electron energy tracking was set to the monoenergetic electron source energy. As the x-ray tube potential of each simulation was increased, a low energy electron cut-off was implemented to reduce computation time. The influence that these parameter biases have on the simulated spectra were investigated and determined to be negligible.
Spatial and energy distributions of the bremsstrahlung and characteristic photons exiting the x-ray tube were determined using a point detector (F5) tally. The F5 tally is a semideterministic estimate of the fluence (photons/cm2) at a point in space.10 The point detector can be considered a next event estimator of the flux at a point in space as if the next event were a particular trajectory directed to the detector point without further collision.9 Both the attenuation and solid angle effect of the particles between the present event and detector point are incorporated into the simulations. In order to produce statistically significant results in an acceptable time, F5 tallies are used often in MC-based detection simulations due to their intrinsic computational efficiency and reduction in statistical variance.10, 11 The tally energy card (E) was used to define energy bins 1 keV in width, starting at 1 keV, and centered at 1.5 keV, 2.5 keV, etc. Therefore, the F5 tally corresponds to the integral of the photon fluence over the entire 1 keV range for that particular energy bin. The highest energy bin was held at 1 keV above the maximum electron energy for the corresponding spectrum (e.g., 60–61 keV for 60 kV). For ease of discussion let us define each 1 keV energy bin as the upper boundary of that particular energy bin (e.g., the lowest energy bin centered at 1.5 keV, spanning 1.0 keV to 2.0 keV, will be termed 2 keV).
The transmitted image radiograph (TIR) tally in MCNPX was used to create a grid of closely spaced F5 tallies that form a two-dimensional planar image surface which can be separated into pixels. Figure 1b is a schematic of the layout for the TIR tally. The grid geometry was defined using the tally segment (FS) and cosine (C) cards in MCNPX to simulate an array of pixels. In diagnostic x-ray imaging configurations with a source to object distance (SID) of 1000 mm, the maximum dimension of any detector panel is no greater than roughly 430 mm. Accordingly, an array of 42 pixels × 42 pixels was defined with pixel dimensions of 10 mm × 10 mm, producing a total scoring plane of 420 mm × 420 mm in the x-y plane [Fig. 1b]. The center of the grid shown in Figs. 1b, 1c was aligned with the center of the effective focal spot defined in the model geometry and located 1000 mm away from the anode as shown in Fig. 1a. The impact of air attenuation was not considered, and thus a vacuum was defined between the beryllium exit window and the scoring plane. The 420 mm × 420 mm scoring plane was used only to quantify the spatial distribution of photons, specifically the heel effect as discussed in Sec. 2E. The reported spectra provided in this study were average over a 180 mm × 180 mm scoring plane as discussed in more detail below.
For all point detector tallies in MCNPX a relative error <5% is believed to produce a generally reliable tally.9 By increasing the number of simulated electrons, using the NPS card in MCNPX, the relative error for a tally in a given energy bin will decrease at the expense of an increase in computation time. At the low and high energy regions of any x-ray spectra, the fluence values are negligible compared with the rest of the bremsstrahlung distribution and characteristic x-ray peaks. These negligible fluence tallies inherently produce relative errors that can easily exceed 5%, but for any realistic application these exact values are not important. Therefore, the number of simulated particles was increased until the relative error per energy bin, containing photon fluences above 1% of the peak fluence, was below 5% relative error.
MC simulations were run for x-ray tube potentials of 20, 22, 25, 27, 30, 35, 40, 45, 50, 55, 57, 60, 62, 65, 70, 80, 90, 100, 120, 140, 160, 180, 200, 250, 300, 350, 400, 450, 500, 550, 600, 610, 620, 630, and 640 kV. All 35 simulations were carried out on an Intel® Core™2 Quad Processor (2.5 GHz, 4 GB RAM, 64-bit Windows 7 OS). The CPU times were 9 h for the 20 kV spectrum (1 × 10⁸ source electrons simulated) and 630 h for the 640 kV spectrum (6 × 10⁸ source electrons simulated) corresponding to an average of 4 × 10⁻⁷ s per source electron per CPU and a total run-time of 5564 h per CPU.
Fluence tallies per pixel were first converted from photons/cm2/source electron to photons/mm2/mAs using the conversion factor 6.24 × 10¹⁵ electrons/mAs. All photon fluence values per pixel were averaged within a 180 mm × 180 mm scoring plane in the MC simulation geometry [see Fig. 1c], corresponding to an approximate cone of radiation with a half-angle of 5.7°.
Tungsten anode spectral model using interpolating cubic splines (TASMICS)
With TASMIP, a polynomial of varying (low) order was fit for each monotonically increasing energy bin and the corresponding coefficients were used to generate x-ray spectra for any tube potential between 30 and 140 kV.2, 3 In this work, several differences made conventional polynomial interpolation inadequate. For the TASMIP model, before fitting, the measured Fewell spectra at different tube potentials were normalized to the measured exposure of a physical x-ray laboratory system with finite inherent filtration (∼1.6 mm Al) as a function of tube potential. This resulted in a monotonic increase in x-ray fluence in each energy bin as tube potential increased. In the present study, MCNPX normalized all simulated spectra essentially to constant tube current; in addition, there was negligible inherent filtration and the simulated tube potentials extended well into the orthovoltage range (to 640 kV), producing photon fluence levels which spanned three orders of magnitude. The large number of data points (e.g., 35 for the 20 keV bin) and large dynamic range in photon fluence values led to inaccuracies in polynomial fitting functions. Therefore, alternative interpolation functions were explored.
Cubic splines were used to generate piecewise third-order polynomials of only regional extent, such that they better fit the data in the high dynamic range environment encountered in this study. A separate cubic polynomial was fit for each simulated tube potential interval (e.g., 180–200 kV, 200–250 kV, etc). The spline function in MATLAB was used to calculate the piecewise polynomials. Conventional continuity conditions were used in the MATLAB cubic spline fitting technique, mainly, adjacent cubic polynomials have matching values at the ends of each interval as well as continuous first and second derivatives.
For all tube potentials, the MC simulations contained zero photon fluence in the maximum energy bin (e.g., 61 keV bin for 60 kV spectrum) and finite photon fluence in the adjacent energy bin (e.g., 60 keV bin for 60 kV spectrum). As the photon energy increased the number of fluence values available for the cubic spline fitting decreased. For example, the 631 keV bin only had two data points, one from the finite fluence value in the 640 kV spectrum and one from the zero fluence in the 630 kV spectrum. All 639 cubic splines (2 keV to 640 keV) were evaluated at 1 kV intervals to generate a database of x-ray spectra at 1 kV intervals from 20 kV to 640 kV with 1 keV energy resolution. Negative photon fluence values produced from the polynomial fitting technique were set to zero.
Spectrum Comparisons
TASMICS was validated against several published x-ray spectral models, as summarized in Table 1. The comparisons were performed using the TASMICS spectra incident upon the 180 mm × 180 mm field of view [Fig. 1c]. In order to directly compare spectra generated by TASMICS and the other spectral models, the HVL and total air kerma values were normalized. The historical derivation of photon fluence (Φ) per unit exposure (X) as described by Johns as
| (1) |
This expression, updated to modern quantities (where 1 mGy air kerma = 114.5 mR), was used to assess the associated air kerma for a given polyenergetic x-ray spectrum, Φ(E). Using this relationship in a computer program, the computed air kerma (K) of a given spectrum Φ(E) could be determined, and then used to compute a desired spectrum Φ′(E) to any desired air kerma (K′) value:
| (2) |
All mathematical filtration performed throughout this study used x-ray mass attenuation coefficients from the NIST XCOM: Photon Cross Sections Database.12 Birch and Marshall and Poludniowski's reference spectra were first mathematically filtered with 0.8 mm beryllium and 2.5 mm aluminum, see Table 1 for tube potential permutations. Spectra generated using TASMIP are already inherently filtered and thus no additional filtration was used. The AAPM TG 195 MCNP-generated 100 kV spectrum was left unfiltered, was normalized to an air kerma of 1 mGy, and compared directly to the corresponding unfiltered TASMICS spectrum. For all other reference spectra, the half value layer (HVL) in aluminum was matched prior to the comparison by adding aluminum filtration to the softer spectrum, prior to normalization to an air kerma of 1 mGy. To address any issues associated with differences in fluorescent yield between the models, only the bremsstrahlung spectra were used for HVL and air kerma normalization.
Table 1.
Summary of previously reported x-ray spectra used to compare against TASMICS.
| Model | Model type | Software | KV range | kV compared | Reference |
|---|---|---|---|---|---|
| TASMIP | Empirical | Spektr | 30–140 | 30, 60, 100, 140 | 2 and 3 |
| Birch and Marshall | Semiempirical | XSpec | 20–640 | 30, 60, 100, 140, 300, 600 | 16 and 18 |
| Poludniowski | Semiempirical | SpekCalc | 30–300 | 30, 60, 100, 140, 200, 300 | 17 |
| AAPM TG-195 | MCNPX | N/A | 100 | 100 | AAPM |
TASMICS spectral characteristics
The relative x-ray beam attenuation, first half value layer (HVL), effective energy, and average energy of TASMICS-generated spectra were used as illustrative examples of the spectral characteristics. For the relative fluence attenuation and HVL calculations, all spectra were first mathematically filtered with 2.5 mm of aluminum to entirely eliminate the low energy L emission lines from tungsten and therefore reflect results from conventional x-ray tubes with permanent filtration. Relative fluence attenuation profiles in aluminum, copper, and soft tissue (ICRU four-component) were determined by mathematically filtering each spectrum with a range of filter thicknesses. The average energy was calculated as the weighted average of the x-ray beam at a given tube potential. The effective energy of an x-ray beam is fundamentally an approximation of the penetration power (i.e., HVL) of the x-ray beam as if it were a monoenergetic beam. Accordingly, effective energy calculations were performed by first computing the HVL in aluminum of the given spectrum and subsequently determining the “effective” energy of a monoenergetic beam that would produce an identical HVL.13 The average energy and effective energy were determined as a function of tube potential for TASMICS spectra with either 2.5 mm of added aluminum filtration or 0.2 mm of added copper filtration.
Heel effect
For quality assurance of the x-ray tube geometric model defined in the MCNPX simulation, the heel effect was analyzed across the x-ray tube field of view. For this purpose, the photon fluence per energy bin per pixel was averaged across a row of 42 pixels (420 mm) on the anode side, central ray, and cathode side [see gray shaded regions in Fig. 1b]. The central ray fluence was computed as the average of two rows to achieve symmetry.2
Data format
TASMICS was used to generate 621 essentially unfiltered tungsten anode x-ray spectra (20 kV to 640 kV) and these spectra are available, via email to the corresponding author (JMB), in a single spreadsheet that is compatible with both Windows and Mac operating systems (Microsoft Excel, Redmond, WA). A screenshot of the spreadsheet layout is shown in Fig. 2. All user input cells in the spreadsheet are highlighted. This simple interface allows the user to select a tube potential, filtration thickness for a variety of conventional materials, and a desired air kerma level. A complete dataset of the 621 unfiltered TASMICS spectra normalized to unit air kerma (mGy) was stored in the spreadsheet. This dataset of TASMICS spectra corresponds to the mean fluence within a 5.7° half-angle around the central ray, see Fig. 1c.
Figure 2.
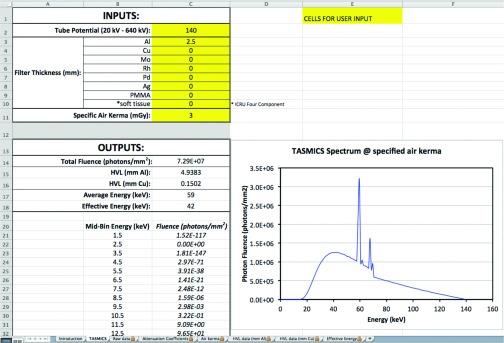
A screenshot of the excel spreadsheet layout which is available for distribution, to interested users. User input cells are highlighted (yellow in EXCEL file).
Attenuation coefficients for aluminum, copper, molybdenum, rhodium, palladium, silver, polymethyl methacrylate (PMMA), and soft tissue (ICRU four-component), obtained from the NIST XCOM: Photon Cross Section Database,12 are provided along with the conversion factor derived by Johns14 relating photon fluence to air kerma. Figure 2 is an illustrative example of a 140 kV spectrum with 2.5 mm aluminum filtration and an air kerma level of 3 mGy.
The spreadsheet also calculates the first HVL in aluminum and copper for the user defined tube potential and filtration combination. The HVL in aluminum (or copper) is calculated by first plotting the amount of added filtration versus the natural log of percent air kerma attenuation. These data points are then fit to a second order polynomial that is used to interpolate the amount of aluminum (or copper) filtration needed to reduce the air kerma to 50% (i.e., HVL).
The average energy is also calculated in the spreadsheet as the weighted average of the user defined x-ray spectrum. In addition, the effective energy is computed by first plotting each 1 keV photon energy bin versus the corresponding HVL in aluminum. These data points are then fit to a polynomial that is used to interpolate the effective energy given the calculated HVL in aluminum of the user defined x-ray spectrum, as described in the previous paragraph.
Statistics
The correlation coefficient, R2, and slope of the linear regression fit between all photon fluence values of the compared spectra are reported. The paired t-test was also used to determine if any statistically significant differences were present between TASMICS and other published spectral models (i.e., p < 0.05). To reduce the impact of quantum noise in the difference measures, the paired t-test was calculated over the energy bins containing fluence values above 1% of the peak bremsstrahlung fluence in each TASMICS spectrum.
The mean difference between spectrum A(E) and TASMICS spectrum B(E) was computed as
| (3) |
where the fraction d is expressed as a percentage and the function F returns the argument when the overall difference is computed, but is the absolute value operator for the absolute difference metric. The mean overall difference (MOD) and mean absolute difference (MAD) were also calculated only over the energy bins containing fluence values above 1% of the peak bremsstrahlung fluence in each TASMICS spectrum. Accordingly, Emin and Emax in Eq. 3 correspond to the lowest and highest energy bins compared, respectively. The differences were calculated over N energy bins separately for each compared kV permutation, as shown in Eq. 3, and as an aggregate of energy bins from all compared kV permutations. The standard deviation of both the MOD and MAD are also reported.
RESULTS
Spectral model results
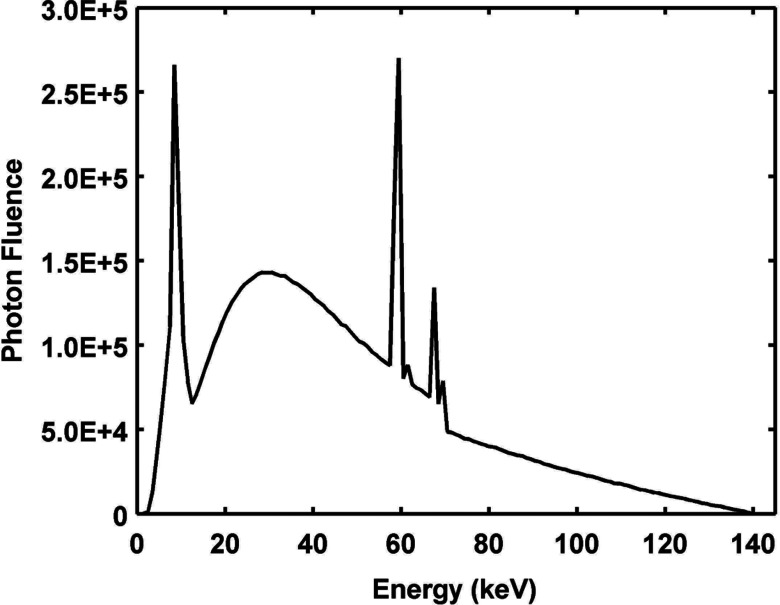
A minimally filtered (0.8 mm Be) MCNPX-generated x-ray spectrum at 140 kV is shown in Fig. 3. This spectrum is an example of the raw output from the simulations before any cubic spline interpolation was performed. Figure 4 shows several permutations of the photon fluence in specific energy bins as a function of applied tube potential (points) and the associated piecewise cubic polynomials (lines). Figures 4a, 4b illustrate the clear differences in the shape of these polynomials for the energy bins that contain the tungsten Kα and Kβ characteristic radiation from the anode as described previously.2 The 60 keV and 59 keV energy bins in Fig. 4a correspond to Kα1 and Kα2 characteristic radiation, respectively. For relative comparison, Fig. 4a also displays fluence values from adjacent energy bins (58 keV and 61 keV) containing only bremsstrahlung photons (dotted lines). Kβ1 and Kβ2 characteristic radiation (68 keV and 70 keV, respectively) is shown in Fig. 4b along with adjacent bremsstrahlung bins (67 keV, 69 keV, and 71 keV). The energy bins that contain fluorescent x-rays are clearly higher in amplitude in comparison to surrounding energy bins, which contain only bremsstrahlung radiation. Figure 4c shows the photon fluence per energy bin as a function of tube potential, for low energy bins. With these bins, fluence decreases after an initial increase as a function of tube potential. The 40 keV energy bin in Fig. 4c is chosen to highlight the upper energy limit of this low photon energy phenomenon. Higher energy bins demonstrate monotonically increasing fluence values, as seen in Fig. 4d.
Figure 3.
Minimally-filtered (0.8 mm Be) MCNPX-generated, 140 kV x-ray spectrum.
Figure 4.
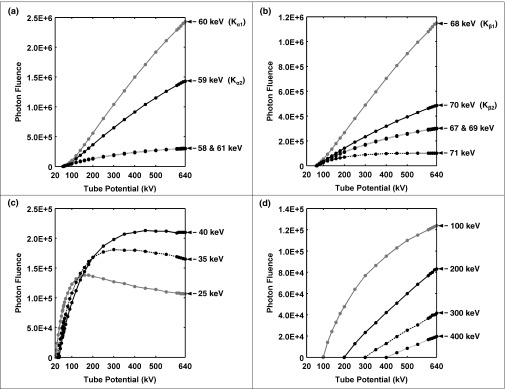
Simulated photon fluence values (points) and interpolating cubic splines (lines) as a function of tube potential for several 1 keV energy bins. Each 1 keV energy bin is defined as the upper boundary of that energy bin (e.g., the 58 keV energy bin is centered at 57.5 keV and spans from 57 to 58 keV). (a) 59 and 60 keV energy bins chosen to highlight Kα2 and Kα1 characteristic x-rays, respectively, relative to adjacent bins, containing only bremsstrahlung contributions (i.e., 58 and 61 keV); (b) 68 and 70 keV energy bins corresponding to Kβ1 and Kβ2,respectively, and adjacent bremsstrahlung bins (i.e., 67, 69, and 71 keV); (c) 25, 35, and 40 keV energy bins chosen to highlight the nonmonotonic nature of these low energy photon bins; and (d) 100, 200, 300, and 400 keV energy bins chosen to highlight monotonically increasing fluence values.
Comparison with TASMIP
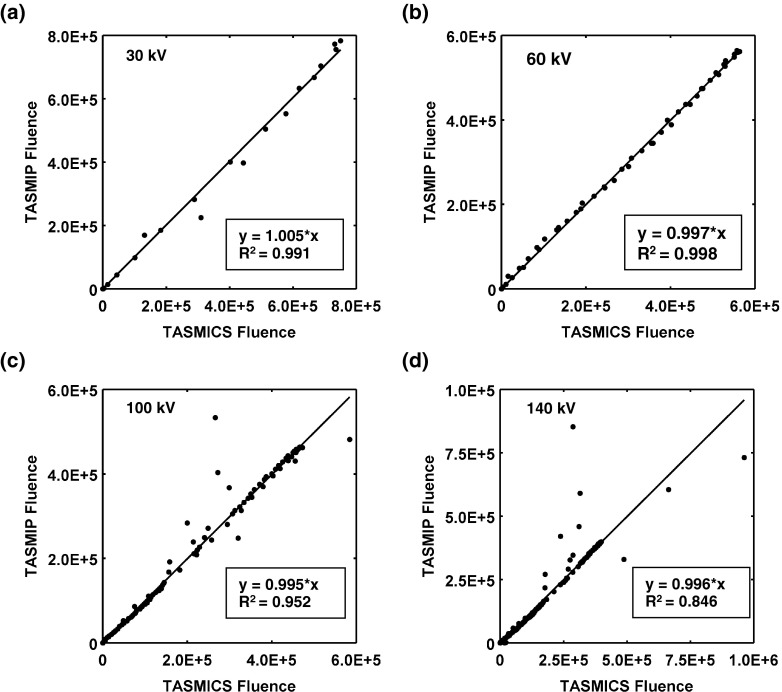
Figures 5a, 5b, 5c, 5d show spectra generated by TASMIP (dashed lines) and the corresponding TASMICS spectra (solid lines) for 30, 60, 100, and 140 kV. All comparisons demonstrated no statistically significant differences (p > 0.05). Figures 6a, 6b, 6c, 6d show comparison plots with the corresponding linear regression slope and R2 values for spectra of the same tube potentials shown in Fig. 5. The MOD and MAD results are reported in Table 2. Overall, Figs. 56 demonstrate excellent agreement between the MC-based TASMICS technique and the laboratory measurements used to produce TASMIP.
Figure 5.
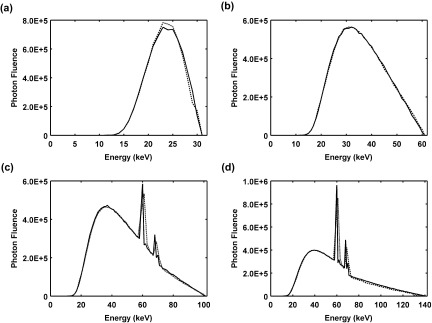
Comparison of TASMICS-generated spectra (solid lines) and TASMIP-generated spectra, (dashed lines) at (a) 30 kV, (b) 60 kV, (c) 100 kV, and (d) 140 kV.
Figure 6.
Correlation plot of TASMIP fluence values vs TASMICS fluence values demonstrating good correlation between the two spectral models at (a) 30 kV, (b) 60 kV, (c) 100 kV, and (d) 140 kV. The coefficient of determination (R2) is shown along with the slope of the linear fit.
Table 2.
Paired t-test, mean overall difference (MOD), and mean absolute difference (MAD) results between previously reported x-ray spectra and TASMICS. All results reported in this table were calculated only over the energy bins containing fluence values above 1% of the peak bremsstrahlung fluence in each TASMICS spectrum.
| kv compared | P value | %MOD (%STD) | %MAD (%STD) | |
|---|---|---|---|---|
| TASMIP | 30 | 0.99 | 1.3 (10.9) | 6.3 (8.9) |
| 60 | 0.99 | −2.8 (10.2) | 4.4 (9.6) | |
| 100 | 0.82 | −1.5 (11.9) | 6.3 (10.2) | |
| 140 | 0.91 | 8.0 (29.3) | 14.6 (26.6) | |
| |
30, 60, 100, 140, |
|
2.7 (21.8) |
9.7 (19.7) |
| Birch and Marshall | 30 | 0.98 | −1.9 (7.0) | 3.1 (6.5) |
| 60 | 0.98 | −2.6 (6.1) | 3.7 (5.5) | |
| 100 | 0.73 | −5.2 (12.3) | 7.4 (11.0) | |
| 140 | 0.66 | −4.6 (15.9) | 9.0 (13.9) | |
| 300 | 0.71 | −1.5 (19.7) | 13.4 (14.4) | |
| 600 | 0.96 | 4.1 (20.0) | 14.4 (14.5) | |
| |
30, 60, 100, 140, 300, 600 |
|
0.1 (18.5) |
12.0 (14.0) |
| Poludniowski | 30 | 0.97 | −7.2 (18.2) | 12.3 (15.1) |
| 60 | 0.97 | −5.5 (17.4) | 7.7 (16.6) | |
| 100 | 0.81 | −4.9 (15.1) | 8.8 (13.2) | |
| 140 | 0.62 | −3.6 (12.4) | 6.8 (11.0) | |
| 200 | 0.50 | −2.2 (11.2) | 5.3 (10.1) | |
| 300 | 0.39 | −0.3 (11.1) | 4.8 (10.1) | |
| |
30, 60, 100, 140, 200, 300 |
|
−2.5 (12.8) |
6.2 (11.5) |
| AAPM TG 195 | 100 | 0.97 | 0.4 (14.9) | 8.1 (12.5) |
The difference in location of the characteristic radiation in Figs. 5c, 5d is due to the difference in energy binning between the tallied photon fluence in MCNPX and the experimentally measured spectra used to produce TASMIP. These differences are clearly seen in Figs. 6c, 6d as substantial deviations from the linear regression. Furthermore, with increasing tube potential, the MAD (and standard deviation), in general, increases as a result of the greater characteristic x-ray emissions in the mismatched energy bins. As mentioned above, the MCNPX point detector photon fluence tally was defined in this study as the integral of the fluence values over a 1 keV energy bin and each bin is labeled in this study as the upper boundary of that particular energy bin (e.g., the 60 keV bin is centered at 59.5 keV and spans from 59 keV to 60 keV). In comparison, the Fewell et al. spectra used to generate TASMIP were tabulated in 2 keV intervals for the CT range8 (i.e., 70 kV–140kV) so the values at 1 keV intervals were linearly interpolated. The Fewell spectra used for TASMIP in the mammography range15 (i.e., 20 kV– 60 kV) were tabulated in 1 keV intervals and thus no interpolation was needed. The difference in energy between the Kα1 (57.98 keV) and Kα2 (59.32 keV) characteristic emission of tungsten is less than the 2 keV energy resolution of the Fewell et al. tabulated x-ray spectra and as a result one bin encompasses both the Kα1 and Kα2 peaks. In the present study, the choice of 1 keV energy bins in the MCNPX simulations place the Kα1 and K α2 emission lines in adjacent bins (i.e., 59 keV and 60 keV, respectively), see Fig. 4a, and were therefore distinct but spectrally unresolvable. The rhenium Kα1 radiation (61.14 keV) from the 5% rhenium in the target can also be seen in both TASMIP and TASMICS spectra in Figs. 5c, 5d, but is fully resolved only in the TASMICS spectra since the corresponding energy bin (62 keV) is not directly adjacent to the tungsten Kα1 energy bin (60 keV) in the MCNPX routine. TASMICS also clearly resolves the Kβ1 (67.2 keV) and Kβ2 (69.1 keV) emission lines of tungsten, since the two bins are not adjacent (68 keV and 70 keV, respectively). Although minor inconsistencies exist due to a mismatch in the energy-binning between measurement-based TASMIP spectra and MC-based TASMICS spectra, given these differences, the relative intensities of the two Kα and two Kβ peaks with respect to each other and the bremsstrahlung distribution are in good agreement.
Comparison with Birch and Marshall's model
TASMICS demonstrated no statistically significant differences from Birch and Marshall's computational model over the wide range of tube potentials compared, as shown in Fig. 7. The inset images in Figs. 7e, 7f are displayed with a logarithmic scale on the photon fluence axis to better depict spectral differences. The MOD and MAD results between Birch and Marshall spectra and TASMICS spectra are reported in Table 2. At 30 kV and 60 kV [Figs. 7a, 7b], there was excellent correlation between the two models with R2 = 0.998 and R2 = 0.999, respectively, and unity slopes. Figures 7c, 7d, 7e, 7f show clear differences in the characteristic radiation energy binning between the two models.
Figure 7.
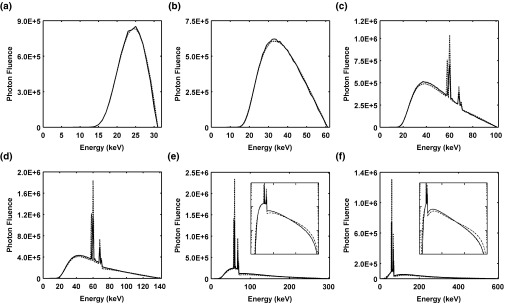
Comparison of x-ray spectra generated using TASMICS (solid lines) and Birch and Marshall's model (dashed lines). (a) 30 kV spectrum, R2 = 0.998, slope = 0.999; (b) 60 kV spectrum, R2 = 0.999, slope = 0.995; (c) 100 kV spectrum, R2 = 0.907, slope = 1.034; (d) 140 kV spectrum, R2 = 0.777, slope = 1.104; (e) 300 kV spectrum and inset figure in log scale to better visual spectral comparisons, R2 = 0.697, slope = 1.259; and (f) 600 kV and inset figure in log scale, R2 = 0.690, slope = 1.267.
Birch and Marshall used an empirical relationship to manually add tungsten characteristic radiation to the bremsstrahlung continuum in their computational model.16 This procedure essentially placed the energy of each characteristic radiation line centered about the published values. In comparison, the Kα1,2 emission lines are placed in adjacent bins for the MCNPX simulation as described in Sec. 3B. This simulated energy binning causes the magnitude of the Kα1,2 emission lines to be lower in intensity than the Birch and Marshall model since the 1 keV width of the bins in TASMICS results in spectral broadening with a commensurate reduction in peak height. The effects of this phenomenon could easily be seen with linear regression slopes exceeding unity (1.034, 1.104, 1.259, and 1.267 for the 100 kV, 140 kV, 300 kV, and 600 kV spectra, respectively) when characteristic radiation was present. The energy-binning mismatch was further illustrated by the monotonically increasing MADs (and standard deviations) with increasing tube potential as reported in Table 2. In the present simulations, MCNPX used the Evaluated Nuclear Data File (ENDF/B-VI release 8) for fluorescence yield data that could be an additional source of inconsistency when comparing against Birch and Marshall's model, which was developed in the late 1970s. The comparisons shown in Fig. 7 exhibit good correlation and minimal absolute and overall differences, demonstrating the validity of TASMICS when compared to Birch and Marshall's computational model.
Comparison with Poludniowski's model
No statistically significant difference was found when comparing TASMICS with Poludniowski's spectral model (i.e., p > 0.05) for the tube potentials displayed in Fig. 8. The MOD and MAD results are reported in Table 2. As mentioned previously, the present MC simulations transported both photons and electrons. Poludniowski's model also used a MC-based approach to transport electrons within the tungsten anode, but used a semiempirical model to estimate self-filtration of the bremsstrahlung photons.17 In addition, Poludniowski's model defines each energy bin as the center of a 1 keV wide energy bin (e.g., bin spanning 10.5 keV–11.5 keV is termed 11 keV). This is inconsistent with the present energy binning where the 11 keV bin spans from 10 keV to 11 keV. These differences in photon transport and energy binning are likely the reasons for the slight inconsistencies in fluorescent yield and energy binning seen in Figs. 8c, 8d, 8e, 8f. As was the case with the Birch and Marshall comparison described in Sec. 3C, the characteristic radiation inconsistency results in linear regression slopes exceeding unity and monotonically increasing with increasing tube potential (1.033, 1.171, 1.405, and 1.794 for 100, 140, 200, and 300 kV, respectively). To our knowledge, the Poludniowski data are the only study that both extends up to 300 kV and has shown satisfactory agreement with measured data in the orthovoltage region.
Figure 8.
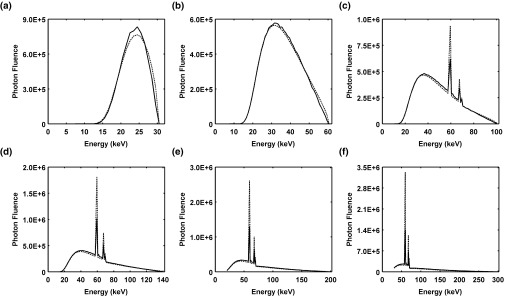
Comparison of x-ray spectra generated using TASMICS (solid lines) and Poludniowski's model (dashed lines). (a) 30 kV spectrum, R2 = 0.980, slope = 0.974; (b) 60 kV spectrum, R2 = 0.996, slope = 0.989; (c) 100 kV spectrum, R2 = 0.946, slope = 1.033; (d) 140 kV spectrum, R2 = 0.861, slope = 1.171; (e) 200 kV spectrum, R2 = 0.823, slope = 1.405; and (f) 300 kV spectrum and inset figure in log scale to better visual spectral comparisons, R2 = 0.813, slope = 1.794.
Comparison with MCNP simulations from AAPM TG 195
The charge of American Association of Physicists in Medicine Task Group 195 was to create reference MC-based databases for comparison and validation of MC results between different users. This specific AAPM TG 195 dataset used a tungsten anode at 11° and a tally plane of 10 mm × 10 mm, at a distance of 100 mm away from the anode. Figure 9a displays the excellent agreement (p = 0.973) between the spectra simulated by AAPM TG 195 (dashed line) and TASMICS (solid line), regardless of the slight difference in anode angle. The MOD and MAD results are reported in Table 2. Figure 9b shows excellent correlation between all data points, demonstrating consistency between the two MC-based simulations.
Figure 9.
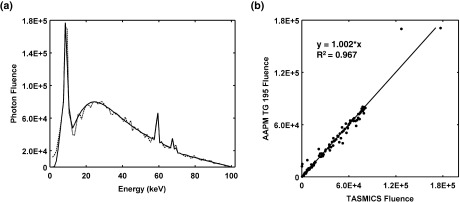
(a) Plot of unfiltered 100 kV tungsten anode x-ray spectra generated using TASMICS (solid line) and an AAPM TG 195 MCNP simulation (dotted line); and (b) Photon fluence correlation plot.
TASMICS spectral characteristics
Figures 10a, 10b are plots of the average energy and effective energy, respectively, as a function of tube potential for TASMICS spectra with either 2.5 mm of added aluminum filtration or 0.2 mm of added copper filtration. As expected, the average energy and effective energy monotonically increased with increasing tube potential. Both the average energy and effective energy were consistently higher with 0.2 mm of copper filtration than with 2.5 mm of aluminum filtration, except at very low tube potentials (i.e., 20 kV). The crossover at this point is likely a consequence of the k-edge of copper (∼9 keV), which results in essentially beam softening at the lowest tube potential values. That is, there is substantial attenuation of photons above the k-edge, and therefore the photon fluence at lower energies dominates the spectrum, leading to a low effective energy.
Figure 10.
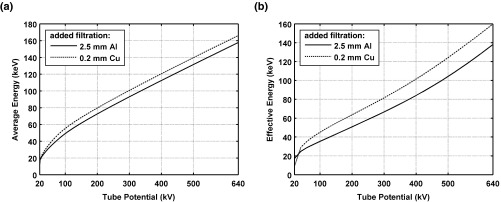
(a) Average energy and (b) effective energy of TASMICS spectra as a function of tube potential with 2.5 mm of added aluminum filtration or with 0.2 mm of added copper filtration.
The relative fluence attenuation profiles of TASMICS spectra at 30, 60, 100, 200, 400, and 600 kV are plotted on a logarithmic scale as a function of aluminum filtration [Fig. 11a], copper filtration [Fig. 11b], and tissue thickness [Fig. 11c]. Note that the TASMICS spectra used to produce the relative fluence attenuation profiles in Fig. 11 all contain 2.5 mm of aluminum filtration to reflect results from conventional x-ray tubes with permanent filtration. The 30 kV fluence attenuation profile is not included in Fig. 11b since even a very small amount of copper filtration (<1.0 mm) would almost entirely attenuate the total photon fluence in the spectrum. The slope of the fluence attenuation profiles in Fig. 11 decrease as the tube potential increases due to an increase in penetrability and hence effective energy as was illustrated in Fig. 10. Figure 12 shows the expected monotonically increasing HVL of TASMICS spectra with increasing tube potential and total filtration.
Figure 11.
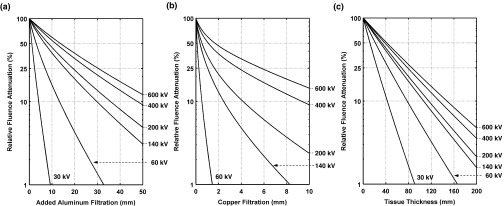
Relative fluence attenuation profiles of TASMICS spectra for added (a) aluminum, (b) copper, and (c) tissue. All spectra used in figure contain 2.5 mm of aluminum filtration to reflect results from conventional x-ray tubes with permanent filtration. The y-axis in figure is in logarithmic scale.
Figure 12.
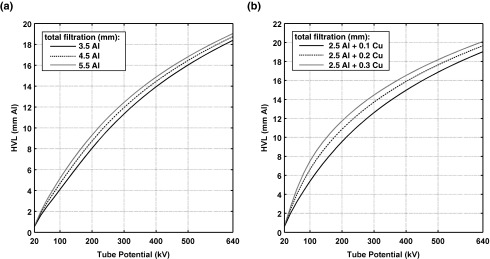
First half-value layer in aluminum as a function of tube potential for various thickness of (a) aluminum and (b) copper added filtration.
Heel effect
Figure 13 is a plot of MCNPX simulated spectra in the cathode (dashed lines), central ray (solid black lines), and anode (solid grey lines) directions of the scoring plane [see Fig. 1b] for 60, 100, 140, 200, 400, and 600 kV. Figures 13d, 13e, 13f are plotted with a logarithmic scale on the photon fluence axis to better visualize spectral comparisons. As expected, in the anode direction beam hardening and photon intensity reduction is present as a result of the photons having to traverse a greater thickness through the tungsten anode. Although the peripheral pixels in this scoring plane [Fig. 1b] were not used to generate TASMICS spectra [Fig. 1c], the spectral comparisons seen in Fig. 13 elucidate the utility of MCNPX simulations in modeling a conventional x-ray tube geometry.
Figure 13.
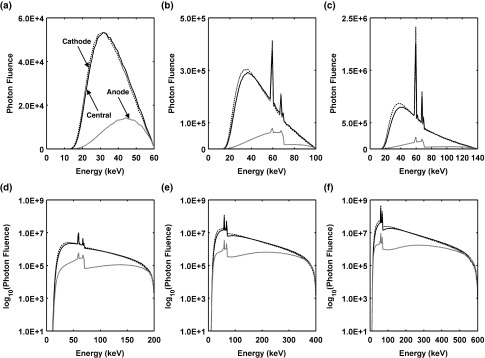
Spectral comparison of the cathode, central ray, and anode directions of x-ray tube field of view [see Fig. 1b] for (a) 60 kV, (b) 100 kV, (c) 140 kV, (d) 200 kV, (e) 400 kV, and (f) 600 kV simulated x-ray spectra. All spectra in this figure contain 2.5 mm of aluminum filtration to reflect results from conventional x-ray tubs with permanent filtration.
DISCUSSION
To our knowledge, TASMICS is the first purely Monte Carlo-based spectral model to cover a range of tube voltages from 20 kV up to 640 kV. Given the inherent difficulty in accurately measuring x-ray spectra over this large range of tube potentials, the spectral model presented in this work produces self-consistent reference x-ray spectra using a validated radiation transport code (MCNPX 2.6.0), without loss of energy resolution due to physical detector systems.
As mentioned previously, MCNPX normalizes all fluence tallies to the number of source electrons, which is the equivalent of constant tube current. By contrast, the TASMIP model normalized each Fewell spectrum to the measured output of a laboratory system at a given tube potential, which resulted in monotonic increases in x-ray fluence in each energy bin as tube potential increased. In the present study, at low energies monotonic behavior was not seen, as photon fluence per bin as a function of tube potential decreased in some of the lower energy bins [Fig. 4c]. This behavior is likely due to attenuation of lower-energy photons as the tube potential increases, which makes the average depth of interaction for the electron beam to be deeper within the anode. Regardless of the physical mechanism behind this behavior, cubic spline interpolation produced satisfactory results given the inherent regional extent of this piecewise polynomial approach.
The Birch and Marshall model used for comparison with TASMICS has some details that are worthy of discussion if we wish to draw any meaningful conclusions from the comparative analysis. Birch and Marshall used the Thomson-Whiddington relationship to describe the energy of electrons at various depths within the target and stated that the relationship may be questionable above 200 kV, since this was the maximum measured spectrum that was available to them.16 Furthermore, the Birch and Marshall spectra were only validated up to 150 kV, and thus Figs. 7e, 7f show comparisons with a model that has not been validated against measured data. The spectra generated for this study above 150 kV was done by changing some limits and array sizes to allow for higher kVs.18 Therefore, caution is necessary in comparisons >150 kV.
The development of the previous TASMIP model took place in an era where computer memory and speed were limited, and therefore the model was essentially a concise computer subroutine that could generate raw x-ray spectra from 30 kV to 140 kV. While that approach proved useful, the C subroutine required that users be familiar with C programming. Furthermore, the issue of normalization to specific air kerma levels was a source of confusion for many users. Given the current capabilities of modern computer systems, the TASMICS model described herein was used to generate all 621 spectra (20 kV–640 kV), and these are available to interested parties in a user-friendly spreadsheet format as described in this paper. The spreadsheet is available by email request to the corresponding author (J.M.B.). This paper also provides several TASMICS spectral characteristics that can easily be used as a reference for users interested in quickly obtaining approximate effective energy, average energy, HVL, and fluence values for various filtration combinations and the entire range of tube potentials.
The TASMICS modeled x-ray spectra are not scaled to a particular tube-current-time product (mAs) for a specific x-ray tube. It is common for diagnostic medical physicists to characterize the output of an x-ray system as the air kerma (mGy) per 100 mAs at 1 meter from the focal spot as a function of kV (or mR/mAs versus kV @ 1 m, in older units). However, the shape of this mGy/100 mAs curve is very dependent upon the total filtration of the x-ray system. Therefore, there is no notion of “output” in the TASMICS spreadsheet other than the ability to select tube potential and filter thickness, and then scale the filtered x-ray spectrum to a desired air kerma. This allows the user to match the quality (kV and HVL) and quantity (air kerma) of a TASMICS spectrum to measured values for any specific x-ray system. It does not, by design, allow the user to generate the output characteristics (air kerma per 100 mAs @ 1 m versus kV) as a function of tube potential.
The TASMICS model has potential limitations since it is based on a specific target geometry and composition. X-ray tubes are manufactured in a range of anode angles but in TASMICS the anode angle is held constant at 12°. Although large deviations from this value would result in softer (or harder) x-ray spectra, this study has shown that small deviations (12.5° for the x-ray tube used to produce TASMIP spectra and 11° for AAPM TG 195 simulations) do not significantly change the resulting x-ray spectra. Furthermore, the exact composition of the tungsten anode may change across manufacturers and models but most contain between 0% and 10% rhenium by weight, which will only result in slight changes in the amplitude of rhenium characteristic x-rays. Although TASMICS pertains only to tungsten anodes, the methods described herein could be applied to both rhodium and molybdenum anodes found in mammography and tomosynthesis systems.
CONCLUSIONS
A new x-ray spectral model, TASMICS, was described and evaluated in this work. The model was shown to be largely equivalent to previous spectral models, including TASMIP,2 the Birch and Marshall spectral model,16 and the Poludniowski model.17 The TASMICS model provides 1 keV spectral resolution, which is sufficient to better highlight the K and L edges of the tungsten anode. While this feature has little effect in terms of radiation dosimetry or image quality analysis, for educational purposes the display of the higher resolution spectra is appealing. Most importantly, the new TASMICS model (compared to the TASMIP model) provides x-ray spectra with only 0.8 mm of beryllium filtration, and therefore are much softer than TASMIP-generated spectra, which had an inherent filtration of about 1.6 mm of aluminum.2 The low inherent filtration means that the TASMICS model is directly applicable to mammography and tomosynthesis applications, for x-ray systems that use a tungsten anode. Finally, the TASMICS model extends the tabulation of x-ray spectra to a tube potential of 640 kV. While this is far greater than most needs in diagnostic medical physics, for some radiation oncology applications this orthovoltage range is useful.19 It is anticipated that these higher potential spectra will be useful in nondestructive testing and security screening applications.
ACKNOWLEDGMENTS
The authors would like to thank the National Institute of Health for funding through the Initiative for Maximizing Student Development grant and a R01 EB002138 grant as well as Leland Roy Saxon and Georgia Wood Saxon (2013–2014 Saxon Fellowship). The authors would also like to thank Dr. Gavin Poludniowski for providing us with the SpekCalc software. Lastly, the authors would like to express our appreciation to Dr. Robert J. Jennings for providing us with Birch and Marshall's computational model and tailoring the code to extend into the orthovoltage range.
References
- Kramers H. A., “On the theory of x-ray absorption and of the continuous x-ray spectrum,” Philos. Mag. 46, 836–871 (1923). 10.1080/14786442308565244 [DOI] [Google Scholar]
- Boone J. M. and Seibert J. A., “An accurate method for computer-generating tungsten anode x-ray spectra from 30 to 140 kV,” Med. Phys. 24, 1661–1670 (1997). 10.1118/1.597953 [DOI] [PubMed] [Google Scholar]
- Boone J. M., Fewell T. R., and Jennings R. J., “Molybdenum, rhodium, and tungsten anode spectral models using interpolating polynomials with application to mammography,” Med. Phys. 24, 1863–1874 (1997). 10.1118/1.598100 [DOI] [PubMed] [Google Scholar]
- Akbulut S., Grieken R., Kilic M. A., Cevik U., and Rotondo G. G., “Identification of heavy metal origins related to chemical and morphological soil properties using several non-destructive X-ray analytical methods,” Environ. Monit. Assess. 185, 2377–2394 (2013). 10.1007/s10661-012-2718-6 [DOI] [PubMed] [Google Scholar]
- Firsching M., Nachtrab F., Uhlmann N., and Hanke R., “Multi-energy x-ray imaging as a quantitative method for materials characterization,” Adv. Mater. 23, 2655–2656 (2011). 10.1002/adma.201004111 [DOI] [PubMed] [Google Scholar]
- Kumar J., Landheer D., Barnes-Warden J., Fenne P., Attridge A., and Williams M. A., “Inconsistency in 9 mm bullets measured with non-destructive x-ray computed tomography,” Forensic Sci. Int. 214, 48–58 (2012). 10.1016/j.forsciint.2011.07.018 [DOI] [PubMed] [Google Scholar]
- Pelowitz D. B., “MCNPX User's Manual, Version 2.6.0,” LA-CP-07-1473, 2008.
- Fewell T. R. and Shuping R. E., Handbook of Computed Tomography X-Ray Spectra, HHS Publications (FDA) 81–8162 (U. S. Government Printing Office, Washington, DC, 1981). [Google Scholar]
- X-5 M.C. Team, MCNP — A General N-Particle Transport Code: Version 5, 2003.
- Smans K., Zoetelief J., Verbrugge B., Haeck W., Struelens L., Vanhavere F., and Bosmans H., “Simulation of image detectors in radiology for determination of scatter-to-primary ratios using Monte Carlo radiation transport code MCNP/MCNPX,” Med. Phys. 37, 2082 (2010). 10.1118/1.3377773 [DOI] [PubMed] [Google Scholar]
- Souza E. M., Correa S. C., Silva A. X., Lopes R. T., and Oliveira D. F., “Methodology for digital radiography simulation using the Monte Carlo code MCNPX for industrial applications,” Appl. Radiat. Isot. 66, 587–592 (2008). 10.1016/j.apradiso.2007.11.004 [DOI] [PubMed] [Google Scholar]
- Hubbell J. H. and Seltzer S. M., “Tables of x-ray mass attenuation coefficients and mass energy-absorption coefficients from 1 keV TO 20 MeV for elements Z = 1 to 92 and 48 additional substances of dosimetric interest,” NIST, 1995.
- Bushberg J. T., The Essential Physics of Medical Imaging, 3rd ed. (Wolters Kluwer Health/Lippincott Williams and Wilkins, Philadelphia, 2012). [Google Scholar]
- Johns H. E. and Cunningham J. R., The Physics of Radiology, 3d ed. (Thomas, Springfield, IL, 1974). [Google Scholar]
- Fewell T. R. and Shuping R. E., Handbook of Mammographic X-Ray Spectra, HEW Publication (FDA) 79-8071 (U. S. Government Printing Office, Washington, DC, 1978). [Google Scholar]
- Birch R. and Marshall M., “Computation of bremsstrahlung x-ray spectra and comparison with spectra measured with a Ge(Li) detector,” Phys. Med. Biol. 24, 505–517 (1979). 10.1088/0031-9155/24/3/002 [DOI] [PubMed] [Google Scholar]
- Poludniowski G., Deblois F., Landry G., Evans P., and Verhaegen F., “SpekCalc: A free and user-friendly software program for calculating x-ray tube spectra,” Med. Phys. 36, 2472 (2009). 10.1118/1.3181281 [DOI] [Google Scholar]
- Jennings R. J., personal communication (2014).
- Prionas N. D., McKenney S. E., Stern R. L., and Boone J. M., “Kilovoltage rotational external beam radiotherapy on a breast computed tomography platform: a feasibility study,” Int. J. Radiat. Oncol., Biol., Phys. 84, 533–539 (2012). 10.1016/j.ijrobp.2011.12.042 [DOI] [PMC free article] [PubMed] [Google Scholar]


