

Abstract
Background
Uptake of treatment for hepatitis C virus (HCV) is low in Canada despite its publicly funded health care system. We explored the uptake of HCV treatment within the Canadian Co-infection Cohort to determine if some treatment centres have been more successful than others at starting patients with HIV–HCV coinfection on HCV treatment.
Methods
We estimated the variation between 16 centres in the uptake of HCV treatment using a Weibull time-to-event model with adjustment for patient characteristics that are thought likely to influence the uptake of treatment. We asked the principal investigator at each centre about access to hepatitis-related specialists and services and the importance of various criteria when determining if a patient with HIV–HCV coinfection should receive treatment for HCV.
Results
Among 681 untreated patients in the Canadian Co-infection Cohort, 163 patients with HIV–HCV coinfection started HCV treatment over a period of 1827 patient-years (9 per 100 patient-years). Even after adjustment for case mix, there was still appreciable variation in treatment uptake between centres, with mean hazard ratios of 0.43 (95% credible interval 0.11–1.3) and 3.6 (95% credible interval 1.7–8.4) for the centres least and most likely to start an average patient with HIV–HCV coinfection on HCV treatment. The most important criteria reported by principal investigators for determining eligibility for treatment were severity of fibrosis, current psychiatric comorbidities, current alcohol intake, past HCV treatment and a history of reinfection with HCV. However, the opinions were wide-ranging: 8 of the 15 criteria elicited both the responses “less important” and “very important.”
Interpretation
The magnitude of the centre effects and diverse opinions about the importance of treatment eligibility criteria suggest that provider-related barriers to HCV treatment uptake are as important as patient-related barriers.
The burden of hepatitis C virus (HCV) infection on the Canadian health care system has steadily increased since the 1990s, and it is expected to further increase as patients age.1 In 2007, the prevalence of HCV infection in Canada was estimated to be 0.8%, but it is also estimated that 21% of infected individuals are unaware of their infection.2 Patients with HIV are at a high risk of coinfection because both infections are transmitted by injection drug use, and 20% of patients with HIV also have HCV infection.3 In patients with HIV–HCV coinfection, liver-related and all-cause HCV hospital admissions have increased in Canada by 30% to 40% per year during the decade from 1994 to 2004.1 Curative treatment for HCV is available and cost-effective for patients with or without HIV coinfection;4,5 this treatment greatly reduces the progression to end-stage liver disease, decompensation, transplantation, admission to hospital and death. For coinfected patients, effective treatment for HCV also reduces HIV progression and nonliver-related mortality.6,7 Guidelines recommend that all coinfected patients should be considered for HCV treatment, particularly those with significant liver fibrosis (greater than F2 by Metavir staging on liver biopsy).8,9
Current HCV treatment is complex, difficult to tolerate and requires expert supervision. Uptake of HCV treatment in Canada is low, despite its publicly funded health care system. In particular, uptake is considered unacceptably low among injection drug users, the group among which most new HCV infections arise.10 Two-thirds of injection drug users in Canada are infected with HCV.11,12 In a recent survey, 80% of Canadian physicians who specialize in HCV said that they were not likely to provide HCV treatment to active injection drug users.13 Injection drug users are often considered ineligible for treatment because of poor adherence to care, psychiatric illness or ongoing use of drugs or alcohol.14,15 Even if eligible, patients with HCV may be reluctant to start treatment.16
In the United States, patients are less likely to be offered and to accept HCV treatment if they are older, male, not white, infected with a difficult-to-treat HCV genotype, have psychiatric illness, or if they use drugs or alcohol.17–19 Many studies have evaluated these patient-related barriers to treatment,20,21 which are difficult to overcome. Provider and institutional barriers are also important;17,22 these are perhaps more amenable to intervention. Although having access to an experienced provider is clearly important for the uptake of HCV treatment,17–19 it is not clear what other provider and institutional barriers are involved.
Given that many patients with HIV–HCV coinfection are current or past injection drug users, this subgroup represents a priority for HCV treatment if the risk of transmission is to be reduced and health care costs contained. Thus, a better understanding of provider and institutional barriers to treatment in Canada is required. In this study, we investigated the uptake of HCV treatment within the Canadian Co-infection Cohort to determine if some centres were more successful than others at initiating HCV treatment, and we explored factors that could be associated with differences between centres.
Methods
The Canadian Co-infection Cohort is a prospective cohort of adult patients infected with both HIV and HCV.23 Patients have been enrolled at 16 centres across Canada since 2003; these centres include university hospitals and community-based clinics in small and large urban areas (Table 1). All eligible patients at each centre were invited to participate. Patients who gave informed consent underwent an initial evaluation followed by study visits every 6 months. At each visit, sociodemographic and behavioural information were self-reported by use of questionnaires; blood was obtained for biochemical, virologic and immunologic analyses; and data about medical treatments and diagnoses were collected by research personnel. The AUDIT-C questionnaire was used to measure alcohol use.24 Research involving this cohort has been approved by the community advisory committee of the Canadian HIV Trials Network and by the institutional ethics boards of all participating centres.
Table 1: Characteristics of the 16 centres included in the Canadian Co-infection Cohort.
| Centre | Province | Care | Patients with HIV–HCV coinfection | No. (proportion) included in the study | Median duration of HCV, yr |
Addiction services available |
Transient elastography available |
||||
|---|---|---|---|---|---|---|---|---|---|---|---|
| Followed at centre | Enrolled in cohort as of July 2012 | Included in the study | Female | Aboriginal | Injection drug use* | ||||||
| Montreal Chest Institute | QC | Tertiary | 180 | 169 | 133 | 33 (0.25) | 3 (0.02) | 56 (0.42) | 16 | Y | Y |
| Centre Hospitalier de l’Université de Montréal | QC | Tertiary | 200 | 189 | 104 | 16 (0.15) | 0 (0.00) | 81 (0.78) | 20 | Y | Y |
| Montreal General Hospital | QC | Tertiary | 65 | 51 | 38 | 9 (0.24) | 0 (0.00) | 10 (0.26) | 19 | N | N |
| Clinique du Quartier Latin | QC | Primary | 100 | 14 | 7 | 0 (0.00) | 0 (0.00) | 3 (0.43) | 17 | N | Y |
| Vancouver Infectious Diseases Centre | BC | Primary | 200 | 146 | 86 | 15 (0.17) | 28 (0.33) | 70 (0.81) | 18 | Y | Y |
| St. Paul’s Hospital | BC | Tertiary | 200 | 65 | 40 | 5 (0.13) | 5 (0.13) | 40 (0.63) | 15 | Y | Y |
| Native Health Clinic | BC | Primary | 200 | 63 | 40 | 16 (0.40) | 18 (0.45) | 40 (1.00) | 24 | Y | Y |
| Oak Tree Clinic | BC | Tertiary | 80 | 71 | 35 | 34 (0.97) | 18 (0.51) | 32 (0.91) | 17 | Y | Y |
| Southern Alberta HIV Clinic | AB | Tertiary | 80 | 47 | 28 | 7 (0.25) | 4 (0.14) | 23 (0.82) | 18 | Y | Y |
| Sudbury Regional Hospital | ON | Primary | 80 | 72 | 45 | 19 (0.42) | 15 (0.33) | 41 (0.91) | 17 | Y | Y |
| Hamilton Health Sciences | ON | Primary | 100 | 33 | 16 | 3 (0.19) | 2 (0.13) | 12 (0.75) | 22 | N | Y |
| Toronto General Hospital | ON | Tertiary | 100 | 74 | 45 | 5 (0.11) | 2 (0.04) | 15 (0.33) | 9 | N | Y |
| Windsor Regional Hospital | ON | Primary | 40 | 22 | 12 | 1 (0.08) | 2 (0.17) | 11 (0.92) | 21 | Y | N |
| The Ottawa Hospital, General Campus | ON | Tertiary | 350 | 63 | 37 | 10 (0.27) | 4 (0.11) | 29 (0.78) | 9 | Y | N |
| Sunnybrook Hospital | ON | Tertiary | 55 | 19 | 12 | 1 (0.08) | 0 (0.00) | 7 (0.58) | 18 | N | N |
| Capital District Health Authority | NS | Tertiary | 60 | 11 | 3 | 0 (0.00) | 0 (0.00) | 2 (0.67) | 32 | Y | N |
Note: HCV = hepatitis C virus, QC = Quebec, BC = British Columbia, AB = Alberta, ON = Ontario, N = no, NS = Nova Scotia, Y = yes. *At cohort enrolment.
Statistical analysis
We modelled time to uptake of HCV treatment in the cohort of patients not receiving HCV treatment before or at enrolment. We fitted a Weibull time-to-event model with a normally distributed random intercept for each centre in order to estimate the variation in treatment uptake between centres. In this model, we adjusted for patient characteristics that we thought were likely to influence the uptake of treatment; we then ranked the centres according to their success in starting patients on HCV treatment. To allow for differences between centres in their case mix, we adjusted for the following covariates: sex, ethnic background, HCV genotype, and, at cohort enrolment, age, duration of HCV infection, use of combination antiretroviral therapy, CD4 cell count, and self-reported homelessness, psychiatric diagnosis, use of injection drugs, and use of alcohol.17–19 In 2 subsequent analyses, we added additional covariates to the model to allow for differences in treatment uptake between primary and tertiary care centres or between provinces (British Columbia, Ontario and Alberta, Quebec and Nova Scotia). Ontario and Alberta have similar regulations that govern access to HCV treatment, as do Quebec and Nova Scotia. The model was fit in WinBUGS using uninformative prior distributions for each of the model’s parameters: normal distributions with large variance for covariate effects25 and a wide uniform distribution for the standard deviation of centre effects.26
In a sensitivity analysis, we added prior information about centre effects via an informative prior distribution for the effect of each centre. That is, we attempted to provide additional information about these effects, rather than limit the information in our analysis to just the data collected during follow-up. We modelled the probability that patients received HCV treatment before or at enrolment using a log binomial model that included the covariates listed above.27,28 With this model, we estimated the risk in each centre that patients received treatment before or at enrolment relative to the average risk across all centres. We then used these risk ratios to calculate a mean for the prior distribution for each centre effect, rather than assuming a normal distribution with a mean of zero.
To explore possible reasons for differences in the uptake of HCV treatment between centres, we asked the principal investigator at each centre to complete a web-based survey (www.surveymonkey.com). Our survey (Appendix 1, available at www.cmajopen.ca/content/1/3/E106/suppl/DC1) contained questions about access to hepatitis-related specialists and services and the importance of various criteria when determining which patients should undergo HCV treatment. These questions were a subset of questions asked in a study of variation in the use of HCV services in the United Kingdom.29 The original paper-based survey was pilot-tested on clinicians before use; we modified the questions without further testing to make them more suitable for our web-based survey. In particular, we expanded a question about access to tests to include access to transient elastography and to HCV-related specialists (hepatologists, nephrologists, psychiatrists or psychologists, clinical pharmacists, HCV-dedicated nurses or social workers) and services (outreach teams, addiction services, opioid-substitution programs). Transient elastography, a noninvasive ultrasound-based method of measuring liver stiffness,30 is now the standard method for evaluating liver fibrosis because of its simplicity, low cost and greater than 90% positive predictive value for advanced fibrosis.9 We calculated associations between the specialists and services available at each centre and the median centre ranks from our model for the uptake of HCV treatment.
Results
As of July 1, 2012, there were 1109 patients in the cohort; of these, 100 patients had spontaneously cleared HCV when enrolled, 173 patients had started HCV treatment before or at enrolment, and 145 patients had no additional follow-up after enrolment (Figure 1). Of the remaining 681 patients, 163 started HCV treatment over a period of 1827 patient-years (9 patients per 100 years of follow-up). Of the patients who had not started treatment, 94 formally withdrew from the cohort or died; among the remaining 424 patients, 282 (67%) had a follow-up visit within the preceding 9 months.
Figure 1:
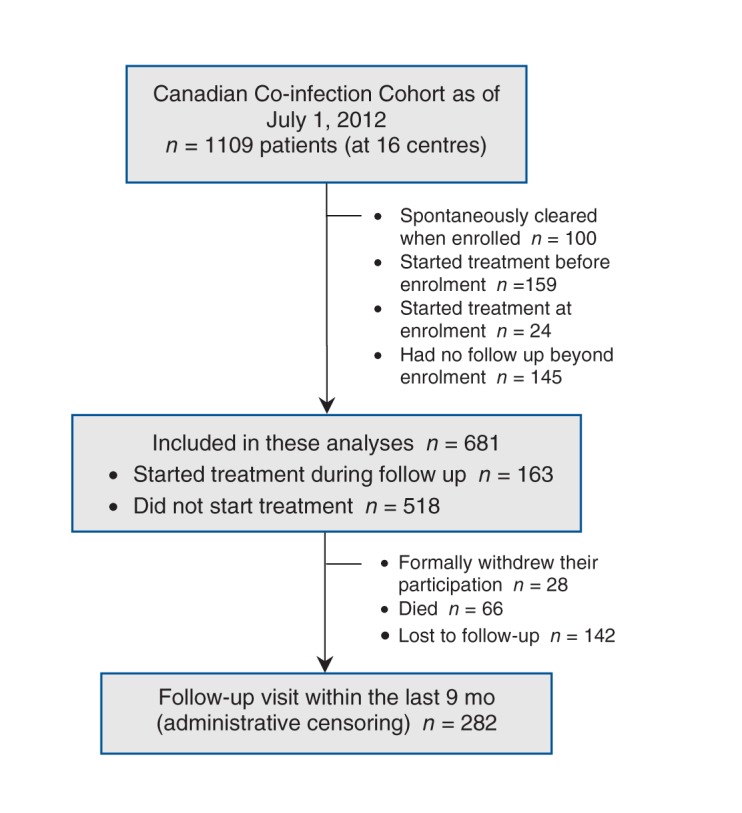
Flow of patients through the study.
Those who started HCV treatment (either before or at enrolment or during follow-up) were more likely to be infected with HCV genotype 2 or 3 (v. other or unknown genotype) and receiving antiretroviral therapy, and they were less likely to be female, Aboriginal or to report either crack or cocaine use (Table 2). Patients who started HCV treatment had been infected with HCV for a shorter duration but had a higher ratio of aspartate aminotransferase to platelet ratio index (APRI) score, indicating more advanced fibrosis.
Table 2: Characteristics of 1119 patients at enrolment in the Canadian Co-infection Cohort.
| Characteristic | Proportion of patients* | ||||
|---|---|---|---|---|---|
| Spontaneous HCV clearance n = 100 |
HCV treatment before or at enrolment n = 184 |
No follow-up after enrolment n = 154 |
No HCV treatment during follow-up n = 518 |
HCV treatment during follow-up n = 163 | |
| Age, yr, median | 45 | 46 | 45 | 44 | 44 |
| Female | 0.41 | 0.22 | 0.24 | 0.28 | 0.17 |
| Aboriginal | 0.23 | 0.12 | 0.17 | 0.17 | 0.07 |
| HCV genotype 1 | 0.14 | 0.61 | 0.57 | 0.62 | 0.62 |
| HCV genotype 2, 3 | 0.09 | 0.28 | 0.21 | 0.15 | 0.25 |
| HCV genotype unknown | 0.77 | 0.08 | 0.21 | 0.21 | 0.10 |
| Chronic hepatitis B virus† infection | 0.06 | 0.05 | 0.09 | 0.07 | 0.03 |
| Not taking antiretroviral therapy | 0.19 | 0.10 | 0.21 | 0.22 | 0.20 |
| CD4 cell count, cells/uL, median | 370 | 420 | 400 | 360 | 400 |
| Duration of HCV infection, yr , median | 19 | 17 | 19 | 19 | 16 |
| APRI‡ | 0.33 | 0.68 | 0.67 | 0.61 | 0.94 |
| End-stage liver disease§ | 0.04 | 0.20 | 0.08 | 0.08 | 0.09 |
| Ever used crack or cocaine | 0.72 | 0.60 | 0.82 | 0.75 | 0.57 |
| Psychiatric diagnosis¶ | 0.58 | 0.49 | 0.54 | 0.48 | 0.49 |
| Currently homeless | 0.15 | 0.04 | 0.19 | 0.14 | 0.11 |
| Current alcohol use | 0.45 | 0.47 | 0.59 | 0.51 | 0.51 |
Note: HCV = hepatitis C virus, APRI = aspartate aminotransferase to platelet ratio index. *Unless otherwise stated †Chronic hepatitis B virus infection was determined by the presence of hepatitis B surface antigen in serum. ‡APRI is a surrogate marker for liver fibrosis: an APRI score ≥ 1.5 indicates substantial liver fibrosis; a score ≥ 2 indicates cirrhosis. §Diagnosis of ascites, portal hypertension, spontaneous bacterial peritonitis, encephalopathy, esophageal varices or hepatocellular carcinoma; data were collected by use of dedicated case-report forms and were centrally validated. ¶Diagnosis in medical records of depression, bipolar disorder, schizophrenia or personality disorder; or a patient report of past psychiatric hospital admission.
In the Weibull model of treatment uptake during follow-up, Aboriginal patients, those infected with HCV for a longer period or who reported the use of crack or cocaine were less likely to start HCV treatment, while those with easier-to-treat HCV genotypes (2 or 3) or higher CD4 cell counts at enrolment were more likely to start HCV treatment (Table 3). Even after adjustment for case mix, there was still appreciable variation in the uptake of treatment between centres (estimated between-centre variance [σ2] = 0.87, 95% credible interval [CI] 0.49–1.5, without informative centre priors), with mean hazard ratios of 0.43 (95% CI 0.11–1.3) and 3.6 (95% CI 1.7–8.4) for the centres least and most likely, respectively, to start the average coinfected patient on HCV treatment. This variation was not reduced by adding informative centre priors to the model (σ2 = 0.90, 95% CI 0.49–1.5) or additional covariates to allow for any differences either between provinces (σ2 = 0.88, 95% CI 0.44–1.6) or between primary and tertiary care centres (σ2 = 0.89, 95% CI 0.49–1.6).
Table 3: Uptake of hepatitis C virus treatment during follow-up in the Canadian Co-infection Cohort (n = 669*).
| Hazard ratio (95% credible interval)† | |||||
|---|---|---|---|---|---|
| Covariate at enrolment | Uninformative priors‡ | Informative centre priors§ | |||
| Age, per 10 yr increase | 0.93 | (0.75–1.1) | 0.93 | (0.75–1.1) | |
| Female (v. male) | 0.61 | (0.38–0.93) | 0.59 | (0.37–0.91) | |
| Aboriginal (v. other) | 0.57 | (0.29–1.1) | 0.56 | (0.28–1.0) | |
| HCV genotype 2, 3 (v. other or unknown) | 1.8 | (1.2–2.6) | 1.8 | (1.2–2.6) | |
| Not on antiretroviral therapy (v. receiving therapy) | 0.82 | (0.54–1.2) | 0.83 | (0.54–1.2) | |
| CD4 cell count, per 100 cells/uL | 1.1 | (1.0–1.1) | 1.1 | (1.0–1.1) | |
| Duration of HCV infection, per 10-yr increase | 0.84 | (0.71–0.99) | 0.83 | (0.71–0.99) | |
| Ever used crack or cocaine (v. never used) | 0.63 | (0.44–0.90) | 0.61 | (0.43–0.86) | |
| Psychiatric diagnosis¶ (v. no diagnosis) | 1.2 | (0.86–1.6) | 1.2 | (0.86–1.6) | |
| Currently homeless (v. not homeless) | 0.91 | (0.54–1.5) | 0.93 | (0.53–1.6) | |
| Current alcohol use (v. no current use) | 0.90 | (0.65–1.2) | 0.89 | (0.65–1.2) | |
Note: HCV = hepatitis C virus. *Of the 681 patients followed after enrolment, 12 were excluded from this analysis because either their CD4 cell count or the duration of their HCV infection was not known at enrolment. †Calculated using the Weibull time-to-event model. ‡Estimated centre variance 0.87 (95% credible interval 0.49–1.5). §Estimated centre variance 0.90 (95% credible interval 0.49–1.5). ¶A diagnosis in medical records of depression, bipolar disorder, schizophrenia or personality disorder; or a patient report of past psychiatric hospital admission.
There was considerable uncertainty about which centres were best at starting an average patient on HCV treatment (Figure 2). Adding prior information about centre effects did not reduce the uncertainty in this analysis. However, centres 8 and 15 were particularly effective at starting patients on HCV treatment.
Figure 2:

Median rank (95% credible interval) for each of the 16 centres included in the cohort. Rank was ordered from best (1) to worst (16) at starting an average patient on treatment for hepatitis C virus (HCV) during follow-up. There was considerable uncertainty about which centres were best, but centres 8 and 15 appeared particularly effective at starting patients on treatment. The graph on the left shows the centre ranks without informative centre priors. The graph on the right shows the centre ranks when data on HCV treatment before or at enrolment were included in the Weibull time-to-event model as prior information. Including this prior information did not materially reduce the uncertainty about which centres were best starting patients on HCV treatment. Note: B = British Columbia, O = Ontario and Alberta, Q = Quebec and Nova Scotia.
The principal investigator in each centre reported access to tests for HCV, HCV genotyping and liver biopsy, and to hepatologists and nephrologists in all or nearly all centres (Table 4). Neither transient elastography nor addiction services were always available (Table 1), but these services tended to be available at centres where patients were more likely to start HCV treatment. The most important criteria for principal investigators when determining eligibility for treatment were severity of fibrosis (median score 5 [where 1 = less important, 5 = very important]), presence of current psychiatric comorbidities (4), current alcohol intake (4), past HCV treatment (4), a history of reinfection with HCV (4), HCV genotype (3.5) and current injection drug use (3.5) (Table 5). However, the opinions were wide-ranging, and 8 of the 15 criteria elicited both the responses “less important” and “very important.”
Table 4: Availability of specialists and services at study centres, as reported by principal investigators (n = 16) at each study centre.
| Access to specialist or service | Proportion of centres | Correlation with median centre rank* |
|---|---|---|
| Qualitative HCV PCR | 0.94 | 1.00 |
| HCV viral load measurement | 1.00 | NA |
| HCV genotyping | 1.00 | NA |
| Transient elastography | 0.69 | 0.56 |
| Liver biopsy | 1.00 | NA |
| Hepatologist | 1.00 | NA |
| Nephrologist | 0.94 | 0.60 |
| Psychiatrist or psychologist | 0.89 | 0.07 |
| Social worker | 0.88 | 0.29 |
| Clinical pharmacist | 0.81 | –0.13 |
| Dedicated HCV nurse | 0.69 | 0.02 |
| Industry-sponsored nurse or social worker | 0.36 | 0.04 |
| Dedicated HCV social worker | 0.25 | –0.15 |
| Outreach team for patients with HCV | 0.38 | –0.20 |
| Addiction services | 0.69 | 0.44 |
| Methadone or buprenorphine and naloxone program | 0.75 | 0.19 |
Note: HCV = hepatitis C virus, NA = not applicable (correlation could not be calculated), PCR = polymerase chain reaction. *Rank biserial correlation with the median rank success of each centre in starting patients on HCV treatment, such that a positive correlation implies patients are more likely to start treatment.
Table 5: Importance of eligibility criteria to the principal investigators (n = 16) at each study centre when determining eligibility for of a patient for HCV treatment.
| Eligibility criteria | Median* | Range |
|---|---|---|
| Age | 1.0 | 1.0–3.0 |
| Sex | 1.0 | 1.0–3.0 |
| HCV genotype | 3.5 | 1.0–5.0 |
| Severity of fibrosis | 5.0 | 3.0–5.0 |
| Past psychiatric comorbidity | 3.0 | 1.0–5.0 |
| Current psychiatric comorbidity | 4.0 | 1.0–5.0 |
| Current incarceration | 3.0 | 1.0–5.0 |
| Past incarceration | 1.0 | 1.0–3.0 |
| Past injection drug use | 1.0 | 1.0–3.0 |
| Current injection drug use | 3.5 | 1.0–5.0 |
| Past alcohol intake | 1.0 | 1.0–4.0 |
| Current alcohol intake | 4.0 | 3.0–5.0 |
| Past HCV treatment | 4.0 | 1.0–5.0 |
| History of reinfection with HCV | 4.0 | 1.0–5.0 |
| Potential for reinfection with HCV | 3.0 | 1.0–5.0 |
HCV = hepatitis C virus *Scores were ranked from 1 to 5, with 1 being less important and 5 being very important.
Interpretation
Main findings
We found variation in the uptake of HCV treatment between centres that could not be explained by patient-level differences at each centre. The centre-level effects were considerable, relative to the effects of patient characteristics. In the model without informative centre priors, the mean hazard ratios for the centres least and most likely to start an average HCV–HIV coinfected patient on HCV treatment were 0.43 and 3.6, respectively. These between-centre differences seem independent of province or whether treatment took place in a primary care or tertiary hospital setting.
Transient elastography and addiction services tended to be available in centres where patients were more likely to start HCV treatment. This suggests that access to these services might explain between-centre differences. When we added access to these services to our Weibell model (at the request of a reviewer), the latter had no effect, but adding the former reduced the residual variation in treatment uptake between centres (σ2 = 0.74, 95% CI 0.37–1.4). It is plausible that access to these services promotes treatment uptake, given that the severity of fibrosis and drug and alcohol abuse are seen as important criteria by physicians when determining eligibility for treatment. However, it is just as plausible that diverse opinions about the eligibility of patients for treatment are responsible for the between-centre differences, either through centre treatment policies or individual decision-making.
Comparison with other studies
A previous study in the United States showed that provider differences can be as important as patient differences in explaining variability in the uptake of HCV treatment, with institutional differences being far less important.17 This suggests that most of the differences seen in our study between centres are because of individual decision-making rather than access to specialists and services. At the time of our study, regulations governing access to HCV treatment were more restrictive in some provinces than in others: in BC, regulations require biopsy-proven fibrosis or abnormal hepatic transaminase levels; in Alberta and Ontario, the regulations require evidence of fibrosis; and in Quebec and Nova Scotia, the regulations require only the presence of chronic HCV infection. Hence, in our model, we grouped a centre in Alberta with centres in Ontario, and a centre in Nova Scotia with centres in Quebec. In theory, the trend away from federal health care administration could increase disparity in the access to health services between provinces.31,32 The restrictive policies in some provinces have been cited as a barrier to HCV treatment by patients and providers.33 Although we found no evidence of provincial effects in our data, our estimates were not precise enough to rule out such effects.
Limitations
Incomplete adjustment for case mix could lead to an overestimate of the variation between centres. However, our model included covariates for most of the criteria thought to be important by the principal investigators when determining eligibility for treatment. We did not directly adjust for the severity of fibrosis: transient elastography was not routinely used during follow-up (and was not available in some centres), and liver biopsy is impractical in routine care. Instead, we adjusted for the duration of HCV infection because this is a rough proxy for the severity of fibrosis and might, therefore, be expected to influence whether a patients starts treatment. Differences between centres in the rate or characteristics of patients lost to follow-up could lead to an underestimate of the variation between centres (e.g., if patients lost to follow-up were less likely to start treatment). Although it is clear that there are differences between centres in the uptake of treatment, there is considerable uncertainty in the ranking of centres based on their success at starting patients on HCV treatment. Including information about treatment uptake before or at cohort enrolment did not reduce this uncertainty. As a result, our estimates of associations between access to specialists and services and centre rankings are approximate. However, access to transient elastography and addiction services could simply be characteristics of centres where patients are started on treatment, rather than services that encourage treatment uptake if provided.
We did not survey all clinicians working at each centre, and between-centre differences could be due, at least in part, to different levels of clinical experience at each centre or different physician workloads. Web surveys are a relatively quick and anonymous method of data collection, and this can influence responses.34 Our survey did not explore all aspects of clinical decision-making; therefore, its results are exploratory and should be interpreted with caution. Our results may not apply in other settings: for example, in our study, women were less likely than men to start HCV treatment, but in a study of (mostly male) American war veterans, men were less likely than women to start HCV treatment.19 Treatment success is ultimately measured by the rate at which patients achieve a sustained viral response after treatment and not by the rate at which patients start treatment. Nevertheless, a necessary first step to improving treatment success in patients with HIV–HCV coinfection is to convince patients and providers to attempt treatment.
Conclusion
Effective treatment is now available for HCV; such treatment will become even more effective when combined with new direct-acting antivirals. Increased uptake of treatment by patients with HIV–HCV coinfection is essential to reduce the transmission of HCV and to contain future health care costs.35 Programs designed to increase the uptake of HCV treatment among injection drug users are being introduced in Canada,36 although it is not clear how best to improve the unacceptably low rate of uptake in this key patient population.13 Community-based primary care, peer support groups and multidisciplinary care are all approaches that may help.37–39 Patient-related barriers to treatment uptake are important but difficult to overcome. Our results suggest that provider-related barriers are as important as patient-related ones — the magnitude of the centre effects in our study is surprising, as are the diverse opinions held by our principal investigators about the importance of eligibility criteria for treatment. (All but 2 principal investigators had more than 10 years’ experience in clinical practice.) Training and continuing medical education programs have been recommended to widen the pool of clinicians comfortable treating HCV,40 but even specialists can be reluctant to provide treatment to injection drug users.13 Qualitative research is needed to explore whether certain patients would receive HCV treatment in some centres but not in others and, if so, why that is the case. Our results also suggest that there is an urgent need for updated HCV treatment and management guidelines for patients with HIV–HCV coinfection, and that these guidelines need to be disseminated to and adopted by both primary care givers and consultants.
Supplemental information
For reviewer comments and the original submission of this manuscript, please see www.cmajopen.ca/content/1/3/E106/suppl/DC1
Supplementary Material
Acknowledgements
The authors thank Alexandre Schnubb, Allyson Ion, Brenda Beckthold, Elaine Fernandez, Evelyn Maan, Heather Haldane, Jonathan Edwin, Judy Latendre-Paquette, Laura Puri, Nancy McFarland, Renée Pugsley, Anja McNeil and Warmond Chan for their assistance with study coordination, participant recruitment and care.
References
- 1.Myers RP, Liu M, Shaheen AA. The burden of hepatitis C virus infection is growing: a Canadian population-based study of hospitalizations from 1994 to 2004. Can J Gastroenterol 2008;22:381-7 [DOI] [PMC free article] [PubMed] [Google Scholar]
- 2.Remis RS. Modelling the incidence and prevalence of hepatitis C infection and its sequelae in Canada Ottawa (ON): Public Health Agency of Canada; 2007. Available: www.phac-aspc.gc.ca/sti-its-surv-epi/model/pdf/model07-eng.pdf (accessed 2013 May 10).
- 3.Remis RS. HIV, HCV and STI infection in Canada. Proceedings from the Canadian AIDS/HIV Treatment Information Exchange; 2011 Nov. 16; Toronto (ON). Available: www.ohemu.utoronto.ca/doc/02-09-12/Canada_HIVHCV_Nov%202011.pdf (accessed 2013 May 21).
- 4.Campos NG, Salomon JA, Servoss JC, et al. Cost-effectiveness of treatment for hepatitis C in an urban cohort co-infected with HIV. Am J Med 2007;120:272-9 [DOI] [PMC free article] [PubMed] [Google Scholar]
- 5.Grishchenko M, Grieve RD, Sweeting MJ, et al. Cost-effectiveness of pegylated interferon and ribavirin for patients with chronic hepatitis C treated in routine clinical practice. Int J Technol Assess Health Care 2009;25:171-80 [DOI] [PubMed] [Google Scholar]
- 6.Berenguer J, Alvarez-Pellicer J, Martin PM, et al. Sustained virological response to interferon plus ribavirin reduces liver-related complications and mortality in patients coinfected with human immunodeficiency virus and hepatitis C virus. Hepatology 2009;50:407-13 [DOI] [PubMed] [Google Scholar]
- 7.Berenguer J, Rodriguez E, Miralles P, et al. Sustained virological response to interferon plus ribavirin reduces non-liver-related mortality in patients coinfected with HIV and Hepatitis C virus. Clin Infect Dis 2012;55:728-36 [DOI] [PubMed] [Google Scholar]
- 8.Côté P, Baril JG, Hebert MN, et al. Management and treatment of hepatitis C virus in patients with HIV and hepatitis C virus coinfection: a practical guide for health care professionals. Can J Infect Dis Med Microbiol 2007;18:293-303 [DOI] [PMC free article] [PubMed] [Google Scholar]
- 9.Soriano V, Puoti M, Sulkowski M, et al. Care of patients coinfected with HIV and hepatitis C virus: 2007 updated recommendations from the HCV-HIV International Panel. AIDS 2007;21:1073-89 [DOI] [PubMed] [Google Scholar]
- 10.Grebely J, Raffa J, Lai C, et al. Low uptake of treatment for hepatitis C virus infection in a large community-based study of inner city residents. J Viral Hepat 2009;16:352-8 [DOI] [PubMed] [Google Scholar]
- 11.Public Health Agency of Canada. I-Track: Enhanced Surveillance of Risk Behaviours among People who Inject Drugs. Phase I Report, August 2006 Surveillance and Risk Assessment Division, Centre for Infectious Disease Prevention and Control, Public Health Agency of Canada, 2006. [Google Scholar]
- 12.Hepatitis C in Canada: 2005–2010 surveillance report Ottawa (ON): Public Health Agency of Canada; 2011. Available: www.catie.ca/sites/default/files/1109-0139-Hep%20C%20Report-EN%20FINAL.pdf (accessed 2013 May 10).
- 13.Myles A, Mugford GJ, Zhao J, et al. Physicians’ attitudes and practice toward treating injection drug users with hepatitis C: results from a national specialist survey in Canada. Can J Gastroenterol 2011;25:135-9 [DOI] [PMC free article] [PubMed] [Google Scholar]
- 14.Fleming CA, Craven DE, Thornton D, et al. Hepatitis C virus and human immunodeficiency virus coinfection in an urban population: low eligibility for interferon treatment. Clin Infect Dis 2003;36:97-100 [DOI] [PubMed] [Google Scholar]
- 15.Perut V, Labalette C, Sogni P, et al. Access to care of patients with chronic hepatitis C virus infection in a university hospital: Is opioid dependence a limiting condition? Drug Alcohol Depend 2009;104:78-83 [DOI] [PubMed] [Google Scholar]
- 16.Moirand R, Bilodeau M, Brissette S, et al. Determinants of antiviral treatment initiation in a hepatitis C-infected population benefiting from universal health care coverage. Can J Gastroenterol 2007;21:355-61 [DOI] [PMC free article] [PubMed] [Google Scholar]
- 17.Kanwal F, Hoang T, Spiegel BM, et al. Predictors of treatment in patients with chronic hepatitis C infection — role of patient versus nonpatient factors. Hepatology 2007;46:1741-9 [DOI] [PubMed] [Google Scholar]
- 18.Osilla KC, Wagner G, Garnett J, et al. Patient and provider characteristics associated with the decision of HIV coinfected patients to start hepatitis C treatment. AIDS Patient Care STDS 2011;25:533-8 [DOI] [PMC free article] [PubMed] [Google Scholar]
- 19.Kramer JR, Kanwal F, Richardson P, et al. Importance of patient, provider, and facility predictors of hepatitis C virus treatment in veterans: a national study. Am J Gastroenterol 2011;106:483-91 [DOI] [PubMed] [Google Scholar]
- 20.Grebely J, Genoway KA, Raffa JD, et al. Barriers associated with the treatment of hepatitis C virus infection among illicit drug users. Drug Alcohol Depend 2008;93:141-7 [DOI] [PubMed] [Google Scholar]
- 21.McLaren M, Garber G, Cooper C. Barriers to hepatitis C virus treatment in a Canadian HIV-hepatitis C virus coinfection tertiary care clinic. Can J Gastroenterol 2008;22:133-7 [DOI] [PMC free article] [PubMed] [Google Scholar]
- 22.Volk ML. Antiviral therapy for hepatitis C: Why are so few patients being treated? J Antimicrob Chemother 2010;65:1327-9 [DOI] [PubMed] [Google Scholar]
- 23.Klein MB, Saeed S, Yang H, et al. Cohort profile: the Canadian HIV-hepatitis C co-infection cohort study. Int J Epidemiol 2010;39:1162-9 [DOI] [PubMed] [Google Scholar]
- 24.Bush K, Kivlahan DR, McDonell MB, et al. The AUDIT alcohol consumption questions (AUDIT-C): an effective brief screening test for problem drinking. Arch Intern Med 1998;158:1789-95 [DOI] [PubMed] [Google Scholar]
- 25.Appendix C. example of computation in R and Bugs. In: Gelman A, Carlin JB, Stern HS, et al., editors. Bayesian data analysis 2nd ed. CRC Press; 2003:591-609. [Google Scholar]
- 26.Gelman A. Prior distributions for variance parameters in hierarchical models. Bayesian Anal 2006;1:515-33 [Google Scholar]
- 27.Greenland S. Model-based estimation of relative risks and other epidemiologic measures in studies of common outcomes and in case-control studies. Am J Epidemiol 2004;160:301-5 [DOI] [PubMed] [Google Scholar]
- 28.Spiegelman D, Hertzmark E. Easy SAS calculations for risk or prevalence ratios and differences. Am J Epidemiol 2005;162:199-200 [DOI] [PubMed] [Google Scholar]
- 29.Parkes J, Roderick P, Bennett-Lloyd B, et al. Variation in hepatitis C services may lead to inequity of health-care provision: a survey of the organisation and delivery of services in the United Kingdom. BMC Public Health 2006;6:3. [DOI] [PMC free article] [PubMed] [Google Scholar]
- 30.Duarte-Rojo A, Altamirano JT, Feld JJ. Noninvasive markers of fibrosis: key concepts for improving accuracy in daily clinical practice. Ann Hepatol 2012;11:426-39 [PubMed] [Google Scholar]
- 31.Jiménez-Rubio D, Smith PC, van Doorslaer E. Equity in health and health care in a decentralised context: evidence from Canada. Health Econ 2008;17:377-92 [DOI] [PubMed] [Google Scholar]
- 32.Zhong H. The impact of decentralization of health care administration on equity in health and health care in Canada. Int J Health Care Finance Econ 2010;10:219-37 [DOI] [PubMed] [Google Scholar]
- 33.Tomlinson K. Hep C sufferers endangering health to get treatment. CBC News 2010 Mar. 3. Available: www.cbc.ca/news/canada/british-columbia/story/2010/03/02/bc-hepcbinging.html (accessed 2012 Nov. 20).
- 34.Couper MP. The future of modes of data collection. Public Opin Q 2011;75:889-908 [Google Scholar]
- 35.Martin NK, Vickerman P, Foster GR, et al. Can antiviral therapy for hepatitis C reduce the prevalence of HCV among injecting drug user populations? A modeling analysis of its prevention utility. J Hepatol 2011;54:1137-44 [DOI] [PubMed] [Google Scholar]
- 36.Plan régional de santé publique 2010–2015 :- garder notre monde en santé Montréal (QC) : Agence de la Santé et des Services Sociaux de Montréal; 2011. Available: http://publications.santemontreal.qc.ca/uploads/tx_asssmpublications/978-2-89673-084-1.pdf (accessed 2012 Nov. 20).
- 37.Grebely J, Knight E, Genoway KA, et al. Optimizing assessment and treatment for hepatitis C virus infection in illicit drug users: a novel model incorporating multidisciplinary care and peer support. Eur J Gastroenterol Hepatol 2010;22:270-7 [DOI] [PubMed] [Google Scholar]
- 38.Grebely J, Dore GJ. An expanding role for primary care providers in the treatment of hepatitis C virus infection in the community. Hepatology 2011;54:2258-60 [DOI] [PubMed] [Google Scholar]
- 39.Grebely J, Tyndall MW. Management of HCV and HIV infections among people who inject drugs. Curr Opin HIV AIDS 2011;6:501-7 [DOI] [PubMed] [Google Scholar]
- 40.Cox J, Graves L, Marks E, et al. Knowledge, attitudes and behaviours associated with the provision of hepatitis C care by Canadian family physicians. J Viral Hepat 2011;18:e332-40 [DOI] [PubMed] [Google Scholar]
Associated Data
This section collects any data citations, data availability statements, or supplementary materials included in this article.