Abstract
We describe a simple but robust algorithm for estimating the heart rate pulse from video sequences containing human skin in real time. Based on a model of light interaction with human skin, we define the change of blood concentration due to arterial pulsation as a pixel quotient in log space, and successfully use the derived signal for computing the pulse heart rate. Various experiments with different cameras, different illumination condition, and different skin locations were conducted to demonstrate the effectiveness and robustness of the proposed algorithm. Examples computed with normal illumination show the algorithm is comparable with pulse oximeter devices both in accuracy and sensitivity.
OCIS codes: (170.3880) Medical and biological imaging, (110.2960) Image analysis
1. Introduction
Human heart rate (HR) is an important physiological parameter with numerous applications, including clinical diagnosis. Contact-based heart rate estimation (e.g. pulse oximeter) is a popular measurement technique. In this technique, a finger or earlobe probe is used to obtain the (HR) by measuring changes in skin absorption of light [1]. There are two types of pulse oximeters: the transmitted light oximeter and the reflected oximeter. These are shown in Fig. 1(a) and 1(b), respectively. These two pulse oximeters are theoretically identical: when the light arrives and penetrates the human skin, the absorption by various tissues is constant and can be treated as a DC (direct current) component. Meanwhile, the absorption by oxygenated arterial blood is variable due to arterial pulsation and can be treated as an AC (alternating current) component, as shown in Fig. 1(c). The HR is then computed given by measuring the frequency information of the AC component. The technique is simple and robust, and has been used to measure HR from smartphone cameras [2, 3].
Fig. 1.
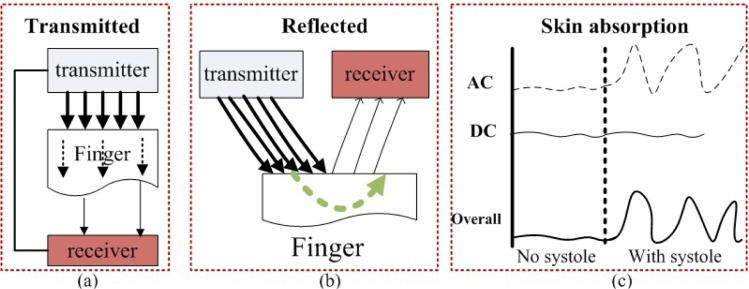
Two different pulse oximeters and corresponding principles
Non-contact estimation provides a more convenient [4, 5], though often less reliable, way to estimate HR. In addition, methods for physiological parameter (including HR) estimation from video have also been proposed [6–9]. Poh et al [7, 8], for example, recently proposed a video-based method for HR estimation by applying blind source separation (BSS) using the independent component analysis (ICA) technique. The ICA method, however, is computationally intensive (relatively speaking), and is at times ambiguous as to the order of the decomposed channels. In addition to these, certain smart phone applications, such as the ”whats my heart rate” app [10], have been developed as non-contact pulse oximeter. However, user experience shows that the best measurements are given near ideal illumination conditions.
Here we describe a new method for HR estimation from non contact video. Unlike earlier work, our method is based on the same physical principles as the optical oximeter, and thus obviates the need for the ICA procedure. The result is a simple, computationally efficient, yet robust method for non contact HR estimation. We begin by describing a model for pigment concentration in human skin, followed by the full description of the method. Finally, we describe the outcome of experiments conducted on real data acquired using a variety of cameras under different illumination conditions.
2. Methods
2.1. A simplified model for images of human skin
Human skin is generally considered to be composed of three layers [11]: the epidermis (including the stratum corneum), the dermis, and subcutaneous fat tissue. Skin color is highly related to pigmentation. Most importantly, melanin in the epidermis and hemoglobin in the dermis play dominant roles in light absorption, thus being responsible for variations in skin color. Past research has shown that skin absorbance can be expressed as a linear combination of melanin absorbance and hemoglobin absorbance in log space [12–14]. Making use of the Lambert-Beer law, we define skin absorbance A at wavelength λ as
| (1) |
where m and h represent melanin and hemoglobin respectively, c is the pigment concentration, v is the product of pigment extinction coefficient (spectral cross-section) and the mean path length of photons in the skin layer. We note that the equation above is only valid for when the arterial oxygen saturation is constant, given that hemoglobin can either be oxygenated or deoxygenated with different absorption spectra. A 0 denotes the baseline skin absorbance and the residual pigment (e.g. β-carotene) contribution. In addition, we note that absorbance can often be interpreted as:
| (2) |
where L and E are the power of transmitted light and incident light respectively. Combing Eqs. (1) and (2), we then obtain:
| (3) |
We model pixel intensities corresponding to skin image locations as Pi (i=R, G, B) at position (x, y) as
| (4) |
where Si is the spectral response function for the camera sensor, and k is a constant for the gain of the camera. Treating the sensor response function Si as a delta function [13, 15] (assuming that the side lobes can be neglected) and substituting Eq. (3) into Eq. (4), then taking logarithm in both sides yields (x and y are omitted) we have:
| (5) |
2.2. Heart rate computation from skin pixels
We define Q as the pixel channel quotient in log space computed as the subtraction between any two equations in Eq. (5):
| (6) |
where Δv m = v m(R) − v m(G), Δv h = v h(R) − v h(G), while ΔA 0 is eliminated due to close baseline skin absorption at different wavelengths. We note that our selection of the red channel is due to the fact that it implicitly represent blood concentration, while the green channel was chose because it reportedly contains the strings plethysmographic signal among all three channels [16]. Ignoring effects of motion, and assuming that the skin region is not exposed to UV radiation for a long time, it is reasonable to assume that melanin concentration in skin locations of the images should be constant throughout the time series. Defining ΔQ as the subtraction between consecutive frames we have
| (7) |
where t denotes the frame number. Since hemoglobin concentration is related to blood concentration, Δc h contains information related to blood concentration, whose frequency, by definition, is the pulse HR. Recalling our discussion on how optical oximeter works above, the first item Δv hΔc h can be interpreted as the AC component while the term Δlog can be interpreted to be the DC component if the illumination is kept constant. Rewriting Eq. (7) we then have:
| (8) |
where , b = −Δv h. The term a tends to be approximately constant if the incident illumination is constant. The same goes for b according to the definition of v h. Given a video sequence consisting of z frames, the time series signal y(t) for estimating the HR at each image location is given by:
| (9) |
The superscript of each Pi term denotes frame number t. The estimated HR is then given by the dominant frequency of y(t) computed by identifying the most prominent peak of the discrete Fourier transform (DFT) technique. In the experiments we demonstrate in the next section, the average of all pixels in a selected ROI is used at every frame for computing each term ΔQk. Finally, to eliminate potential noise and increase the robustness of the algorithm, y(t) is pre-processed with a bandpass filter (128- point Hamming window, 0.6–3 Hz) prior to DFT computation.
3. Results
3.1. Data acquisition
Several experiments were performed in order to show the advantages of proposed approach. Video sequences acquired from different subjects, body locations, as well as different cameras are used. In total, we have tested the algorithm with three different cameras:
Nikon CoolPix L610, recording in 24 bit color at 30 frames per second with resolution of 1280 × 720.
Smartphone: Huawei U8652. An Android™ 2.3 powered device was used to record in 24-bit color at 15 fps with resolution of 800×480. The files were further compressed in mp4 format.
Smartphone: IPhone4 equipped with a mobile dermatoscope [17]. The dermatoscope allowed videos to be taken with 20X magnification. In additions, specular reflection is minimized using polarization technology. The videos were recorded in 24-bit color at 30 fps with resolution of 1280×720, and saved in MOV format.
In addition, we have utilized a commercially available finger pulse oximeter (SM-110 by Santamedical [18]).
3.2. Estimating the heart rate signal
The time traces y(t) are computed as in Eq. (9). Here we demonstrate its estimation in a controlled environment where we have used an IPhone4 equipped with a mobile dermatoscope [17] to acquire high quality data. The dermatoscope allowed videos to be taken with 20X magnification. In addition, specular reflection is minimized using polarization technology. Because of the polarization technology for avoiding specular reflection, movie sequences taken with the mobile dermatoscope provide near ideal conditions for the algorithm to be applied.
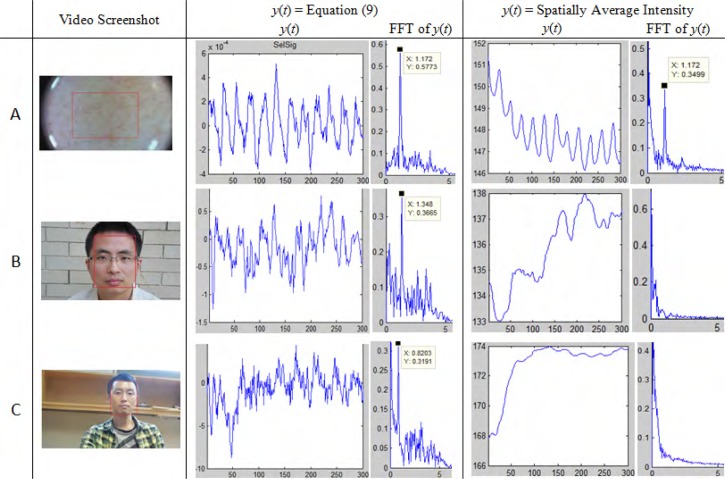
Figure 2(A) shows that the time trace signal y(t) reproduces the profile of the arterial pulsation. The corresponding dominant frequency shown in the Fourier spectrum matches the value obtained with the pulse oximeter, used to record the HR at the same time, at 1.172 × 60 = 70.3. In this case, identical peak (1.172) can be obviously found in frequency domain of both y(t). However, in Fig. 2(B) and 2(C), which are taken with a Nikon CoolPix L610 (see details in previous section), an obvious frequency peak can only be found in time-trace of proposed algorithm, which visually shows much reasonable y(t) as well. For comparison purposes, the last two columns in this figure also compute the time traces utilizing the plethysmographic signal computed from the green channel of the video sequence, as described in [6], [9]), for example. As can be seen, this technique can break down when processing data acquired in non ideal conditions. Table 1 shows a comparison of the capability of the method we propose with other similar methods in the literature.
Fig. 2.
Time trace of y(t) during the recorded video. (Left Column) a screenshot with manually selected ROI shown in red. (Middle Column) Proposed algorithm based heart rate signal y(t) and corresponding frequency domain. (Right Column) Average intensity based heart rate signal y(t) and corresponding frequency domain. We note that, for better understanding the properties of both methods, band pass filtering has not been applied to these examples. In addition, both methods use signals averaged from the same ROI.
Table 1.
Comparisons of Heart rate estimation algorithms
| Algorithm | HR Signal | Computation | STI |
|---|---|---|---|
| [9] [2] | Average Intensity | Real Time | YES |
| [6] | Green Channel | Real Time | YES |
| [7] [8] | ICA(R,G,B) | Requires ICA | Not Mentioned |
| Proposed | Real Time | Theoretically Not |
STI: Sensitive to Illumination
3.3. HR estimation under ambient illumination
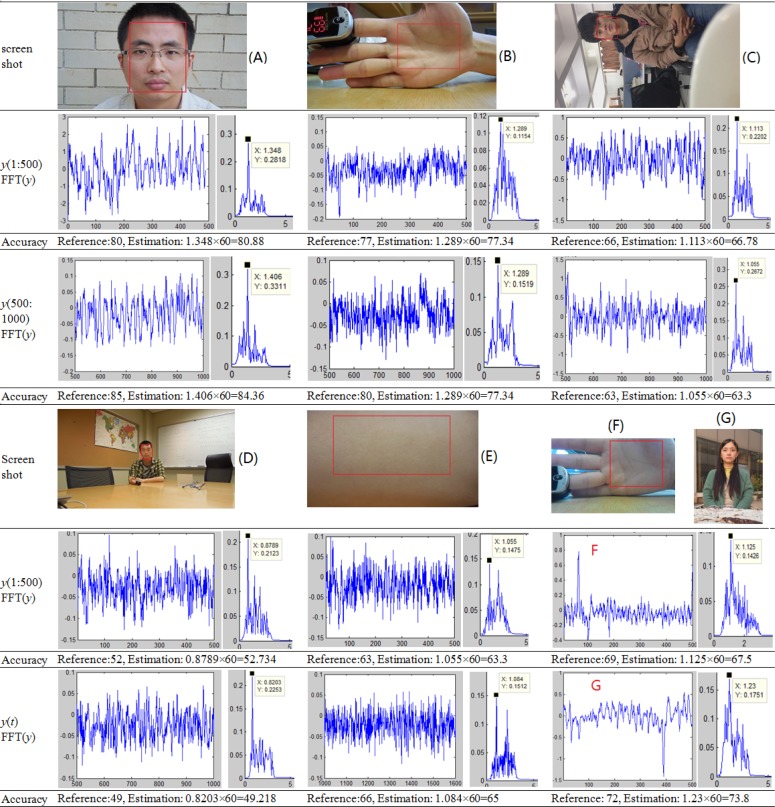
Twenty one video recordings with duration from 45s to 90s were recorded both indoors and outdoors under normal ambient illumination to test performance of the proposed algorithm. The oximeter-based HR measurement was also taken for each instance, at the same time each video was taken. For videos recorded by a digital camera (examples A–E in Fig. 3), the files were divided into non overlapping segments: frame 1 to 500 and from frame 500 to 1000 (from frame 1000 to 1600 in example E). HR was estimated in each of the segments. For videos recorded by the smart phone (examples F in Fig. 3), only frames 1 to 500 were used due to the fact these movies were shorter in duration. Experiments show the proposed algorithm works well both indoors (examples B, C, D, E, F) and outdoors (examples A, G) under normal ambient illumination. Table 2 contains a summary of the results. We compare our algorithm (Est2 in this table) to the plethysmographic signal computed from the green channel or average intensity of the video sequence, as described in [6], [9]) (denoted as Est1 in this table). For each of the methods the average accuracy between the estimate and the reference measurement, computed as was computed. We note that, to ensure a fair comparison, all accuracy results reported on this table were obtained after processing the signals with the same band pass filtering operation described above. Results yielded 81% accuracy for the currently available methods, while the proposed algorithm yielded an average accuracy of 98% (p = 0.001). The data was acquired in varied situations, from a variety of locations including different skin colors, different skin locations and different recording distance (examples A, D, F, G).
Fig. 3.
HR estimation under normal illumination. Different skin locations with unfixed distance were recorded while finger optical oximeter is attached to provide real value as reference. One or two sequential clips were extracted to test the accuracy and sensitivity of the proposed algorithm.
Table 2.
summary of experiments under ambient illumination.
| Examples | Env | Dev | Loc | Frames | Est1 | Est2 | Ref |
|---|---|---|---|---|---|---|---|
| Fig 3A | outdoor | DC | face | 1:500 | 52.7 | 80.88 | 88 |
| 500:1000 | 42 | 84.36 | 85 | ||||
| Fig 3B | indoor | DC | palm | 1:500 | 56.25 | 77.34 | 77 |
| 500:1000 | 52.7 | 77.34 | 80 | ||||
| Fig 3C | indoor | DC | face | 1:500 | 70.3 | 66.78 | 66 |
| 500:1000 | 43 | 63.3 | 63 | ||||
| Fig 3D | indoor | DC | face | 1:500 | 52.7 | 52.7 | 52 |
| 500:1000 | 49.2 | 49.2 | 49 | ||||
| Fig 3E | indoor | DC | arm | 1:500 | 63.3 | 63.3 | 63 |
| 500:1000 | 63.3 | 65 | 66 | ||||
| Fig 3F | indoor | SP | palm | 1:500 | 41.3 | 67.5 | 69 |
| Fig 3G | outdoor | DC | face | 1:500 | 52.7 | 73.8 | 72 |
| 8 | indoor | SP | palm | 1:500 | 48.75 | 57 | 61 |
| 9 | outdoor | DC | face | 1:500 | 49.2 | 59.76 | 58 |
| 500:1000 | 70.2 | 61.5 | 62 | ||||
| 10 | indoor | SP | palm | 1:500 | 67.5 | 67.5 | 66 |
| 11 | indoor | DC | palm | 1:500 | 91.38 | 88.74 | 89 |
| 500:1000 | 91.38 | 92.34 | 91 | ||||
| 12 | indoor | SP | palm | 1:500 | 67.5 | 68.34 | 70 |
| 13 | indoor | SP | palm | 1:500 | 54.4 | 71.7 | 72 |
| 14 | indoor | SP | arm | 1:500 | 71.5 | 78 | 75 |
| 15 | outdoor | DC | face | 1:410 | 63.3 | 119 | 105 |
| 16 | indoor | DC | face | 1:500 | 52.7 | 67.44 | 68 |
| 500:1000 | 56.25 | 74.58 | 75 |
Env=Environment, Dev=Device, Loc=skin Location. ’DC’ and ’SP’ in device column represent Digital Camera and Smart Phone respectively. We clarify that these figures are computed for a single replicate of each movie.
3.4. HR estimation under insufficient illumination
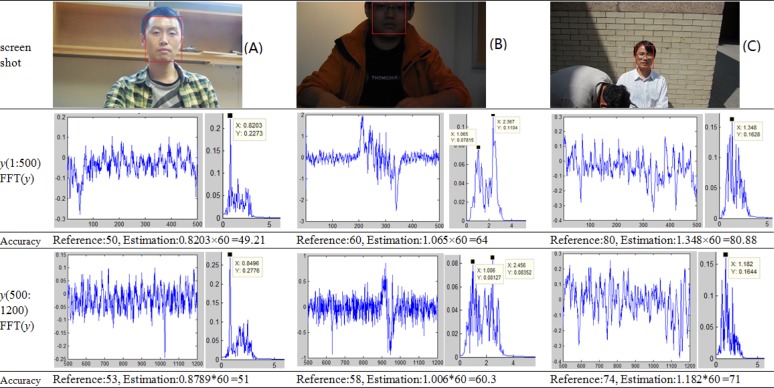
As our derivation shows, the algorithm is independent of constant illumination (see Eq. 7), and thus HR estimation under what would normally be considered as insufficient illumination still may be possible. Figure 4 shows examples of insufficient illumination (example B) and as well as sufficient illumination (example A and C). The first row in Fig. 4 shows screenshots from test videos. The second row, as well as the fourth row are signal y(t) and their corresponding DFTs. The real HR for reference and estimated HR are provided in the third row and the fifth row. High accuracy can still be obtained even with presence of highlights due to over sufficient illumination according to examples in Fig. 4. However we note that insufficient illumination can introduce some ambiguity in frequency estimation (two peaks are visible in the DFT result of part B). In this case, however, it is easy to disced the right peak given that the second peak refers to a HR of over 142 beats per minute. However, the proposed algorithm is still capable of estimating heart rates with accuracy around 96%, which is better than the accuracy of around 80% achieved by the alternative method (P = 0.0175). Table 3 shows the accuracy results under insufficient illumination. Again, to ensure a fair comparison, all results shown in this table were computed utilizing the same band pass filtering operation described earlier.
Fig. 4.
HR estimation under bad illumination. Examples both under insufficient and over sufficient illumination are selected. Two sequential clips with 500 frames and 700 frames are respectively extracted from every video for analysis
Table 3.
summary of experiments under insufficient illumination.
| Examples | Env | Dev | Loc | Frames | Est1 | Est2 | Ref |
|---|---|---|---|---|---|---|---|
| Fig 4A | indoor | DC | face | 1:500 | 49.21 | 49.21 | 50 |
| 500:1200 | 51 | 51 | 53 | ||||
| Fig 4B | indoor | DC | face | 1:500 | 45.7 | 64 | 60 |
| 500:1200 | 56.25 | 60.3 | 58 | ||||
| Fig 4C | outdoor | DC | face | 1:500 | 50 | 80.88 | 80 |
| 500:1200 | 45.7 | 71 | 74 | ||||
| 4 | outdoor | DC | face | 1:500 | 37 | 71.1 | 73 |
| 500:1200 | 60 | 74.64 | 76 | ||||
| 5 | indoor | DC | face | 1:500 | 49.2 | 49.2 | 52 |
| 500:1200 | 50.9 | 51 | 57 |
3.5. HR estimation under variable illumination
The reader will recall that in our derivation we have assumed constant illumination so that the DC component of the derived signal could be ignored. However, if illumination changes occur at a much lower frequency than the movie sampling rate, HR estimation using the method we propose may still be possible. We have designed special experiments to test the algorithm performance under variable illumination. Videos were recorded in a room with variable ambient illumination which was manually changed during recording. Obvious intensity changes can be observed both in frames extracted from videos and uneven signals y(t) in Fig. 5 and Fig. 6. The estimation accuracy is obviously affected and drops.
Fig. 5.

HR estimation under variable illumination. The video was recorded by smart phone and contains 653 frames. The real HR is 56 and the estimated is 0.7812×60=46.87
Fig. 6.

HR estimation under variable illumination. The video was recorded by digital camera and contains 1455 frames. The real HR is 55 and the estimated is 0.8203×60=49.2
3.6. Statistical analysis
We use Bland Altman plots [19] to graphically evaluate the performance of proposed algorithm. The differences between estimated and reference data were plotted against the averages of both measures. The mean d̄ and standard deviation Sd of the differences and 95% confidence intervals (d̄ ± 1.96Sd) were calculated to show the agreement of two measures. 34 pairs of measurements from 21 videos with various illuminations are plotted in Fig. 7. For the proposed algorithm, almost all the data stays in the range of 95% agreement overlap with much smaller standard deviation, despite differences in the imaging device, video format, resolution and environment. In addition, the correlation coefficient of proposed algorithm is 0.9744, which shows high agreement between estimation and reference. While using the current alternative intensity-based method the correlation coefficient of two measures is only 0.2986.
Fig. 7.
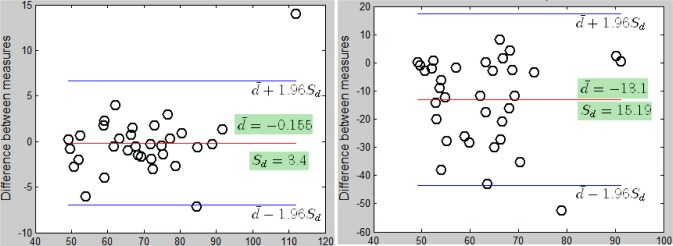
Bland-Altman plots (x-axis: average heat rate by estimation value and reference value. y-axis: difference of estimation value and reference value) is used to demonstrate the agreement between estimation and reference data. (Left) Plots of proposed algorithm. (Right) Plots of intensity based algorithms.
3.7. Effect of ROI selection
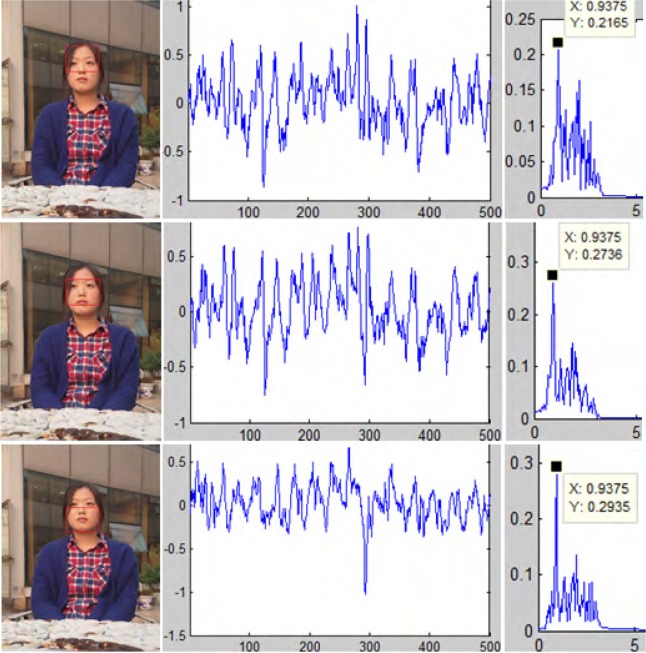
In addition to the experiments testing how well the algorithm works under different illumination conditions, we have also conducted experiments to study how well the method can perform under changes in the initially selected ROIs. Results are shown in Fig. 8. Three different ROIs (with some amount of overlap) were selected to independently calculate the heart rate and high agreement can be observed in dominant frequency. The same observation was made for several of the videos shown here (data not shown for brevity).
Fig. 8.
Testing consistency of the proposed algorithm. Three different ROIs were selected as inputs to separately estimate the heart rate. The results of three FFTs are exactly identical with accuracy 97% (reference: 58, estimation: 0.9375×60=56.25)
4. Discussion
We have described a new algorithm for HR estimation from common place video devices by utilizing the assumption that skin color is mainly a function of the concentration of melanin and hemoglobin, which account for the absorption of light in skin. Hemoglobin exists in blood and its amount is also a function of the heart beat. We utilized this concept to build a mathematical representation of HR signals while treating hemoglobin absorption as an AC component and the remaining parts (including melanin and baseline absorption) as a DC component. The approach was shown to compare favorably with currently existing alternatives.
In examining equation (6), the reader will note that it results from the subtraction of the red and green components of equation (5). While intuitively one may expect that this subtraction can be detrimental to the frequency estimation process if these are in phase. We have also attempted to utilize the individual green or red channels (without subtraction) for this frequency estimation problem (data not shown for brevity). In our experience, however, the subtraction (log ratio) yields a more robust method. More theoretical justification for this often observed improved performance can be found in [20], for example.
In our method, the user is required to keep still during the recording. Slight motion has negligible impact on HR estimation, whereas considerable motion can lead to inaccurate results. In this paper, we have not studied the effects of motion explicitly, as the issue has been addressed in [7]. In addition, we note that motion tracking methods are available to mitigate such effects.
Finally, we also show an example when the method can fail to estimate HR properly. Figure 9 shows such an example. We hypothesize that the reason for the failure in this case is the fact that the selected skin regions contains several confounding factors, including highlight as well as facial hair. Finally, the skin pigmentation of the subject may also have contributed to the failure of the method.
Fig. 9.
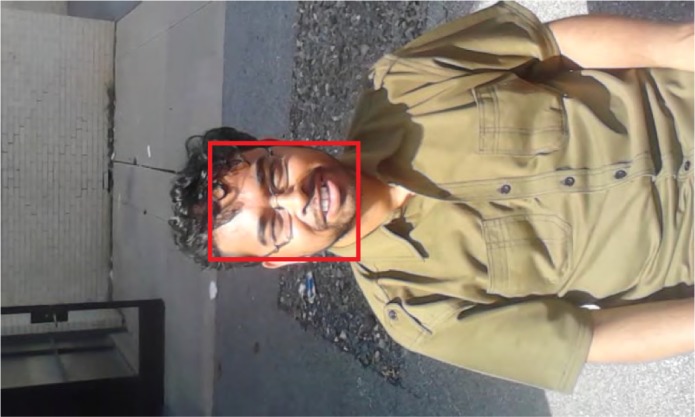
Failure example. The skin regions are dominated by noise (strong highlight, hair and beards).
5. Summary and conclusion
In this paper, a robust and efficient algorithm is proposed to estimate HR from video sequences. Inspired by the principles of an optical oximeter, the heart rate is computed from the AC component of a pre-processed signal which contains information regarding the absorption of hemoglboin in blood. At present, the method is semi automated. It can be rendered fully automatic by combining it with already existing facial tracking algorithms, for example. The method is also efficient, with real time computation possible. In this paper we have sought to quantify its robustness with respect to several illumination conditions. In summary, the method was found to produce results in high agreement with that of a commercially available optical pulse oximeter.
Acknowledgments
The authors would like to thank Dr. Saurav Basu for valuable advice. The work is partially funded by Provincial Natural Science Foundation of Zhejiang (No. LY13F020050), and National Natural Science Foundation of China (No. 61003146)
References and links
- 1.Mengelkoch L. J., Martin D., Lawler J., “A review of the principles of pulse oximetry and accuracy of pulse oximeter estimates during exercise,” Phys. Ther. 74, 40–49 (1994). [DOI] [PubMed] [Google Scholar]
- 2.Pelegris P., Banitsas K., Orbach T., Marias K., “A novel method to detect heart beat rate using a mobile phone,” in ”Engineering in Medicine and Biology Society (EMBC), 2010 Annual International Conference of the IEEE,” (IEEE, 2010), pp. 5488–5491 10.1109/IEMBS.2010.5626580 [DOI] [PubMed] [Google Scholar]
- 3. Https://play.google.com/store/apps/details?id=si.modula.android.instantheartrate&feature=related_apps
- 4.Takano C., Ohta Y., “Heart rate measurement based on a time-lapse image,” Med. Engin. Phys. 29, 853–857 (2007). 10.1016/j.medengphy.2006.09.006 [DOI] [PubMed] [Google Scholar]
- 5.Humphreys K., Ward T., Markham C., Noncontact simultaneous dual wavelength photoplethysmography: a further step toward noncontact pulse oximetry,” Rev. Sci. Instrum. 78, 044304 (2007). 10.1063/1.2724789 [DOI] [PubMed] [Google Scholar]
- 6.Scully C. G., Lee J., Meyer J., Gorbach A. M., Granquist-Fraser D., Mendelson Y., Chon K. H., “Physiological parameter monitoring from optical recordings with a mobile phone,” IEEE Trans. Biomed. Eng. 59, 303–306 (2012). 10.1109/TBME.2011.2163157 [DOI] [PMC free article] [PubMed] [Google Scholar]
- 7.Poh M.-Z., McDuff D. J., Picard R. W., “Non-contact, automated cardiac pulse measurements using video imaging and blind source separation,” Optics Express 18, 10762–10774 (2010). 10.1364/OE.18.010762 [DOI] [PubMed] [Google Scholar]
- 8.Poh M.-Z., McDuff D. J., Picard R., “Advancements in noncontact, multiparameter physiological measurements using a webcam,” IEEE Trans. Biomed. Eng. 58, 7–11 (2011). 10.1109/TBME.2010.2086456 [DOI] [PubMed] [Google Scholar]
- 9.Kamshilin A. A., Miridonov S., Teplov V., Saarenheimo R., Nippolainen E., “Photoplethysmographic imaging of high spatial resolution,” Biomed. Opt. Express 2, 996–1006 (2011). 10.1364/BOE.2.000996 [DOI] [PMC free article] [PubMed] [Google Scholar]
- 10. Https://play.google.com/store/apps/details?id=com.vitrox.facion.gui&hl=en
- 11.Krishnaswamy A., Baranoski G. V., “A study on skin optics,” Natural Phenomena Simulation Group, School of Computer Science, University of Waterloo, Canada, Technical Report 1, 1–17 (2004). [Google Scholar]
- 12.Dawson J., Barker D., Ellis D., Cotterill J., Grassam E., Fisher G., Feather J., ”A theoretical and experimental study of light absorption and scattering by in vivo skin,” Phys. Med. Biol. 25, 695 (1980). 10.1088/0031-9155/25/4/008 [DOI] [PubMed] [Google Scholar]
- 13.Tsumura N., Ojima N., Sato K., Shiraishi M., Shimizu H., Nabeshima H., Akazaki S., Hori K., Miyake Y., ”Image-based skin color and texture analysis/synthesis by extracting hemoglobin and melanin information in the skin,” in ”ACM Transactions on Graphics (TOG),”, vol. 22 (ACM, 2003), vol. 22, pp. 770–779 10.1145/882262.882344 [DOI] [Google Scholar]
- 14.Xu S., Ye X., Wu Y., Giron F., Leveque J.-L., Querleux B., “Automatic skin decomposition based on single image,” Computer Vision and Image Understanding 110, 1–6 (2008). 10.1016/j.cviu.2006.12.002 [DOI] [Google Scholar]
- 15.Finlayson G. D., Drew M. S., Lu C., “Intrinsic images by entropy minimization,” in Computer Vision-ECCV 2004 (Springer, 2004), pp. 582–595 10.1007/978-3-540-24672-5_46 [DOI] [Google Scholar]
- 16.Verkruysse W., Svaasand L. O., Nelson J. S., ”Remote plethysmographic imaging using ambient light,” Opt. Express 16, 21434–21445 (2008). 10.1364/OE.16.021434 [DOI] [PMC free article] [PubMed] [Google Scholar]
- 17.“handyscope-mobile dermatoscope,” http://www.handyscope.net/
- 18. Http://www.santamedical.net/servlet/the-243/Finger-Pulse-Oximeter-SM-dsh-110/Detail
- 19.Martin Bland J., Altman D., “Statistical methods for assessing agreement between two methods of clinical measurement,” The lancet 327, 307–310 (1986). 10.1016/S0140-6736(86)90837-8 [DOI] [PubMed] [Google Scholar]
- 20.Preece S. J., Styles I. B., Cotton S. D., Claridge E., Calcagni A., “Model-based parameter recovery from uncalibrated optical images.” Med. Image Comput. Comput. Assist. Interv. 8, 509–516 (2005). [DOI] [PubMed] [Google Scholar]


