Abstract
Spiral chemical shift imaging (CSI) is a fast CSI technique that simultaneously encodes 1D spectral and 2D spatial information. Therefore, it potentially allows one to perform a 2D-CSI experiment in a single shot. However, for most applications, limitations on maximum gradient strength and slew rate make multiple excitations necessary in order to achieve a desired spectral bandwidth. In this work we reduce the number of spatial interleaves and, hence, the minimum total measurement time of spiral CSI by using an iterative sensitivity encoding reconstruction algorithm which utilizes complementary spatial encoding afforded by the spatially inhomogeneous sensitivity profiles of individual receiver coils. The performance of the new method was evaluated in phantom and in vivo experiments. Parallel spiral CSI produced maps of brain metabolites similar to those obtained using conventional gridding reconstruction of the fully sampled data with only a small decrease in time-normalized signal-to-noise ratio and a small increase in noise for higher acceleration factors.
Keywords: 1H MRS, fast chemical shift imaging, parallel imaging, iterative SENSE reconstruction
Spiral chemical shift imaging (CSI) (1) is a fast CSI technique that speeds up the data acquisition in comparison to conventional phase-encoded CSI (2,3) by sampling the data while oscillating gradients are applied in two spatial dimensions. This enables the simultaneous encoding of 1D spectral and 2D spatial information. Therefore, it potentially allows one to perform a 2D-CSI experiment in a single shot. However, for most applications, limitations on maximum gradient strength and slew rate make multiple excitations necessary in order to achieve a desired spectral bandwidth. For these additional excitations either the start of the data acquisition is shifted (spectral interleaves) or the spiral k-space trajectory is rotated (spatial interleaves) with each interleaf. Parallel imaging techniques such as simultaneous acquisition of spatial harmonics (SMASH) (4), sensitivity encoding (SENSE) (5), or generalized autocalibrating partially parallel acquisitions (GRAPPA) (6) have been developed to accelerate the acquisition in MRI by utilizing complementary spatial encoding in addition to regular gradient encoding afforded by the spatially inhomogeneous sensitivity profiles of individual receiver coils. These techniques allow the image reconstruction without or with only negligible aliasing artifacts of data that were undersampled in the spatial frequency domain. While parallel imaging techniques have been used even in non-Cartesian imaging to speed up the acquisition of k-space data (7–11), so far they have only been applied to CSI using Cartesian k-space sampling schemes such as conventional phase encoding (12,13) and, more recently, echo planar spectroscopic imaging (14 – 16).
The aim of this work was to combine spiral CSI with iterative SENSE (7), which permits accelerated k-space data acquisition, and compare the performance of the iterative SENSE reconstruction for different acceleration factors to conventional reconstructions of the fully sampled data using gridding reconstruction (17).
MATERIALS AND METHODS
Experimental
All experiments were performed on a 3T Signa whole-body MR scanner (GE Healthcare, Waukesha, WI) equipped with self-shielded gradients (40 mT/m, 150 mT/m/ms). A quadrature birdcage body coil was used for RF excitation, whereas signal reception was carried out with an eight-channel head coil array (MRI Devices, Peewaukee, WI). A low-contrast, fast spoiled gradient recalled echo imaging sequence (2D SPGR, field of view (FOV) = 32 × 32 cm2, 64 × 64 matrix, echo time (TE)/repetition time (TR) = 1.3/34 ms, 5° flip angle) was executed twice to determine the coil sensitivities of the phased array coil using either the quadrature body coil or the phased array coil for signal reception.
A spiral CSI sequence with point-resolved spectroscopy (PRESS) volume preselection (18) was used with TE = 144 ms. The spiral gradient waveforms were designed for 12 spatial interleaves with an FOV of 32 × 32 cm2 for a 32 × 32 matrix corresponding to a nominal in-plane resolution of 1 × 1 cm2. Postprocessing increased the actual voxel size calculated from the integral of the point spread function (19) by a factor of 1.6. Due to hardware restrictions the number of data points that could be acquired continuously at the readout bandwidth of 250 kHz was limited to 16K, corresponding to a maximum readout length of only 65.5 ms. To increase the spectral resolution, eight acquisition windows (65.24 ms) were concatenated to a total readout length of 523 ms. The gaps of 144 μs between consecutive readouts were synchronized to the rewinder part of the spiral gradient waveforms. A total of 488 echoes were acquired with an interecho delay of 1.07 ms, corresponding to a spectral bandwidth of 933 Hz. The spiral PRESS module was preceded by a three-pulse chemical shift selective (CHESS) (20) sequence for water suppression and an outer volume suppression module (21). Data were acquired with and without water suppression. The TR was 2 sec. Four excitations were performed without data acquisition to establish a steady state. For in vivo measurements, 16 accumulations were carried out.
Data were acquired from a spherical phantom (17-cm inner diameter) filled with a solution of brain metabolites at physiological concentration levels, and in vivo from healthy volunteers. All scans were approved by the Institutional Review Board.
Data Processing
The data were subsampled using every Rth interleaf (R = 1, 2, 3, 4, and 6) of the 12-interleaf data set to simulate accelerated data acquisition. In the time dimension the data were apodized with a 3-Hz and 5-Hz Gaussian line broadening for phantom and in vivo data, respectively, and zero-filled up to 512 points. After performing a fast Fourier transform (FFT) in the time domain, a frequency-dependent linear phase correction was carried out along the readout dimension to remove the chemical shift artifact which otherwise would cause blurring of off-resonant spectral components. Coil sensitivity maps were computed by normalizing each component coil image from the low-contrast calibration scan by the corresponding scan with the body coil. The signal-to-noise ratio (SNR, estimated from the signal within the object and the standard deviation of the signal outside the object) of the body coil image for both phantom and in vivo measurements was higher than 630 and therefore no further filtering was necessary to minimize noise propagation. Reconstruction in the spatial dimensions was accomplished independently for each spectral point by a variant of iterative SENSE using the conjugate gradient (CG) method in combination with a transfer function approach (22), including gridding with an overgrid factor of 2 and Fourier interpolation in both spatial dimensions by a factor of 2 to a 64 × 64 image matrix. Similar to Ref. (7), sampling density correction and coil sensitivity correction were included as preconditioners to increase the convergence rate of the iterative approach. The number of iterations varied from 20 to 55 for Rs ranging from 1 to 6 and was kept identical for each spectral point for each R. The number of iterations was chosen manually using the following criteria: 1) asymptotic convergence of the relative image norm |Ax−y|/|y|; 2) minimum number of iterations after convergence to minimize noise enhancement by the CG algorithm (23).
Alternatively, for comparison, the data for each channel were reconstructed separately by conventional gridding reconstruction and the individual datasets were added after correcting for coil sensitivity variations in the complex domain. Here, coil sensitivity variations were corrected as follows:
| [1] |
where Icorr(r)g is the corrected coil image at the spatial position r = (x,y,z)T of the g-th coil, S(r)g is the corresponding coil sensitivity at this position, “*” denotes complex conjugate, and I(r)g is the result from the gridding reconstruction of the g-th coil.
Both spectra and spectroscopic images that were reconstructed using the sensitivity-corrected gridding reconstruction of the complete dataset, that is, using all 12 interleaves, served as the reference standard.
After performing a global first-order phase correction for the whole dataset along the spectral dimension, a constant phase correction for each voxel was carried out using the residual water signal. After Fourier-interpolation of the data in the spectral domain by a factor of 4, baseline contributions from residual water were removed for each voxel by subtracting the mean signal intensity in the spectral region between 6.5 and 7.9 ppm from the spectrum. Metabolic maps were calculated by integrating the resonances in absorption mode.
The SENSE-reconstructed data were evaluated by calculating the signed differences of spectra and metabolic maps with respect to the corresponding reference standard data (see previous paragraph). Metabolic maps and difference maps are displayed in magnitude mode. Noise distribution maps were calculated as the standard deviation σR of the spectrum in the signal-free region from 6.5 to 7.9 ppm (400 data points) for each voxel and smoothed with 5 × 5 box-car average. For voxels within the excited PRESS box we calculated the time-normalized SNR (∝√R) of the NAA singlet from the signal intensity in the NAA map as:
| [2] |
Additionally, in order to estimate the noise enhancement in the region of the object without signal for the undersampled data, we calculated the g-factor for each voxel as:
| [3] |
where σ1 is the standard deviation of the noise obtained from the same region in the unaccelerated scan reconstructed with SENSE.
RESULTS
The performance of this technique was tested on a spherical phantom containing the following chemicals: N-acetyl-L-aspartic acid (NAA, 12.5 mM), creatine hydrate (10 mM), choline chloride (3 mM), myo-inositol (7.5 mM), L-glutamic acid (12.5 mM), DL-lactic acid (5 mM), sodium azide (0.1%), potassium phosphate (50 mM), sodium hydroxide (56 mM), and 1 mL/L Gd-DPTA (Magnevist, Schering, Kenilworth, NJ). Spectroscopic images of water for acceleration factors up to 6 using either gridding reconstruction or iterative SENSE reconstruction are shown in Fig. 1. Note that the images were cropped to the extent of the phantom, i.e., the extent of the sensitivity maps. The PRESS module selected a 9 × 13 × 2-cm3 box through the center of the spherical phantom. As expected, the aliasing artifacts due to undersampling become more severe with increasing R for the conventional gridding reconstruction. There are no artifacts visible for R = 2 because the PRESS volume preselection confines the object to less than half of the FOV. However, the SENSE-reconstructed images show no apparent artifacts even for R = 6. This is also illustrated by the difference images of the SENSE-reconstructed images for the various acceleration factors and the reference standard, which are also shown in Fig. 1. The difference maps were scaled up by a factor of 10 to emphasize the deviations. The maximum difference relative to the maximum intensity of the reference standard image reaches 11% only for R = 6. For the standard reconstruction, the maximum relative difference is 98% for R = 6. The high intensity at the center of the images is due both to the transmission profile of the body coil and the spatial profile of the refocusing pulses used in the PRESS module that leads to deviations between the actual and desired PRESS box.
FIG. 1.
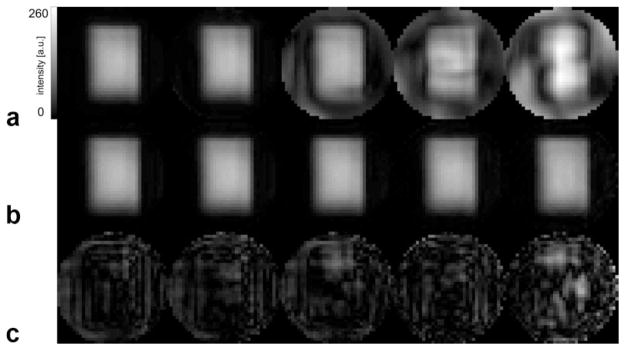
a: Spectroscopic water image of spherical phantom filled with a solution of brain metabolites at physiological concentration levels from a dataset acquired without water suppression as reconstructed by gridding reconstruction for acceleration factors 1, 2, 3, 4, and 6 (left to right). The PRESS module selected a 9 × 13 × 2-cm3 box through the center of the sphere. b: Same as (a) but data reconstructed with iterative SENSE. c: Difference between the images in (b) and the water image reconstructed with the reference standard (scaled up by factor of 10).
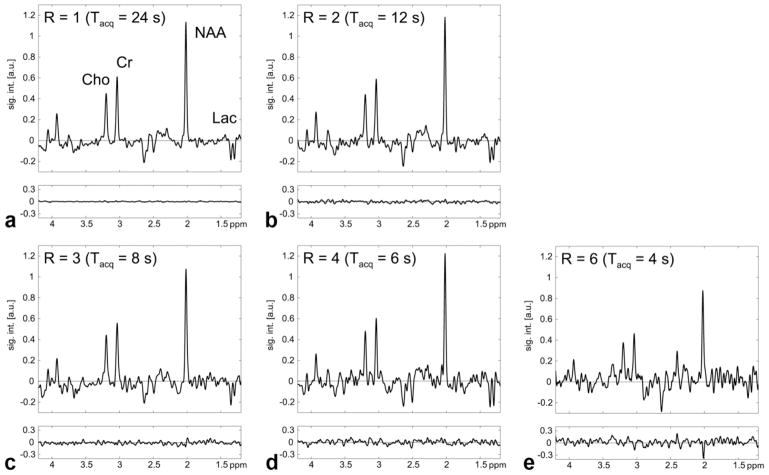
SENSE-reconstructed spectra (R = 1 – 6) acquired with water suppression from the center voxel of the phantom are shown in Fig. 2. The acquisition time was 24 sec for R = 1, 12 sec for R = 2, 8 sec for R = 3, 6 sec for R = 4, and 4 sec for R = 6. Also plotted below the spectra are the corresponding difference spectra with respect to the reference standard using the fully sampled dataset. A nonzero difference spectrum for R = 1 is to be expected as two different reconstruction techniques were applied. Furthermore, the SENSE reconstruction uses the iterative conjugate gradient method and, hence, is intrinsically an approximate solution. But the standard deviation of the difference spectrum is smaller than the noise level (0.07 vs. 0.2). While the noise level increases in those spectra with higher acceleration factors, there are no residual metabolite signals detectable in the difference spectra for R = 1 – 4, demonstrating successful reduction of the aliasing artifacts. For R = 6 the SENSE reconstruction cannot completely remove all aliased signal contributions as apparent from the difference signal for NAA. The mean value from all voxels inside the PRESS box and its standard deviation for the ratio is 1.05(0.10) for R = 2, 1.05(0.17) for R = 3, 1.11(0.17) for R = 4, and 1.32(0.28) for R = 6. The g-factor maps in Fig. 3 illustrate the spatial distribution of the noise enhancement for acceleration factors ranging from 2 to 6. The corresponding average g-factor and its standard deviation is 1.11(0.09), 1.15(0.15), 1.20(0.14), and 1.33(0.14), respectively. Restricting the region to the voxels within the PRESS box the average g-factor is 1.04(0.07) for R = 2, 1.04(0.11) for R = 3, 1.09(0.10) for R = 4, and 1.26(0.14) for R = 6. Figure 4 shows metabolic maps calculated for the singlet resonance of NAA and the difference maps (scaled up by factor 3) with respect to the reference standard. Similar to the results for the data acquired without water suppression, no or only minor aliasing artifacts are visible up to R = 4. Comparable results were obtained for metabolic maps of creatine and choline (data not shown).
FIG. 2.
a: SENSE-reconstructed spectrum (R = 1) acquired with water suppression from the center voxel of the phantom. Plotted below the spectrum is the difference with respect to the reference standard that used all spiral interleaves. b– e: Same as (a) but for R = 2 – 6, respectively.
FIG. 3.

g-factor maps for SENSE-reconstructed spectra from a spherical phantom acquired with water suppression for acceleration factors ranging from 2 to 6 (left to right).
FIG. 4.
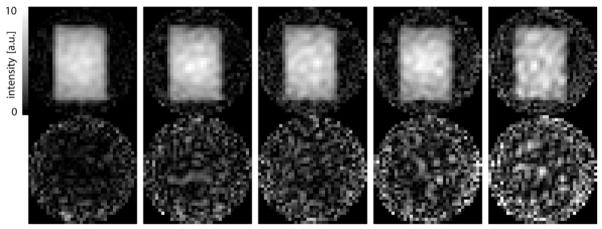
Metabolic maps for NAA (top) from the spherical phantom and the corresponding difference maps with respect to the reference standard (bottom, scaled up by factor 3) for acceleration factors ranging from 1 – 6 (left to right). The PRESS module selected the same 9 × 13 × 2-cm3 box through the center of the sphere as for the data in Fig. 1.
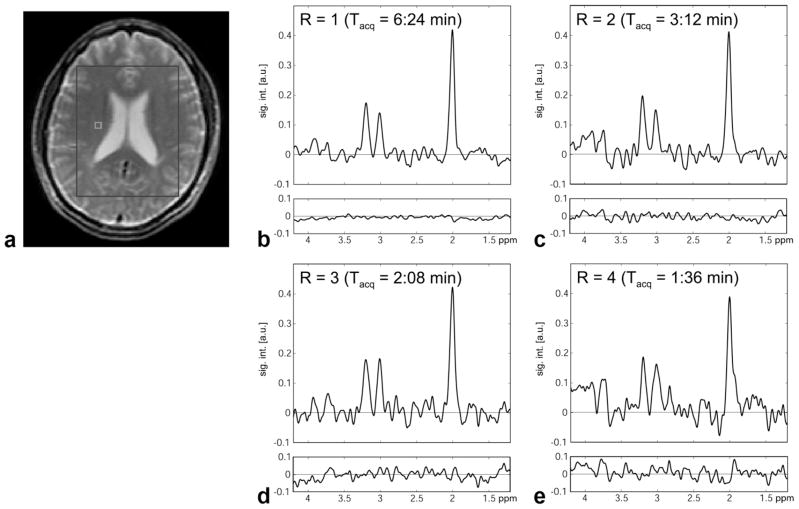
For the in vivo application of the method, a 9 × 12 × 2-cm3 volume (axial slice orientation) was selected through the ventricles of a healthy volunteer (Fig. 5a). Representative spectra from a single white matter voxel in the centrum semiovale and the corresponding difference spectra for acceleration factors up to 4 are shown in Fig. 5b – e. With 16 accumulations, the acquisition time was 6:24 min for R = 1, 3:12 min for R = 2, 2:08 min for R = 3, and 1:36 min for R = 4. No metabolite signals are detectable within the noise level of the difference spectra. The mean value of for voxels within the PRESS box is 1.08(0.16) for R = 2, 1.17(0.23) for R = 3, and 1.32(0.41) for R = 4. The g-factor maps are shown in Fig. 6. The average g-factor for the region of the PRESS box is 1.09(0.06) for R = 2, 1.13(0.06) for R = 3, and 1.24(0.07) for R = 4. The corresponding values for the whole slice are 1.19(0.10), 1.26(0.13), and 1.36(0.14), respectively. Metabolic maps of NAA (cropped to the extent of the head) from datasets reconstructed with SENSE (Fig. 7) demonstrate the good localization properties of the sequence, as the ventricles are clearly defined in all four images. The difference map for R = 1 shows that the iterative SENSE reconstruction is equivalent to the standard reconstruction. For higher acceleration factors, the difference maps generated using the iterative SENSE reconstruction show no systematic deviation above the noise level for the NAA distribution compared to the reference standard. However, significant residual artifacts are apparent when conventional gridding reconstruction is applied.
FIG. 5.
a: High-resolution water MRI from a healthy volunteer indicating the extent of the PRESS box of the CSI experiment. b– e: SENSE-reconstructed spectra (R = 1 to 4) acquired with water suppression from a single voxel in the white matter of the central semiovale (position of the voxel is indicated in (a)). Plotted below each spectrum is the difference spectrum with respect to the reference standard that used all spiral interleaves.
FIG. 6.
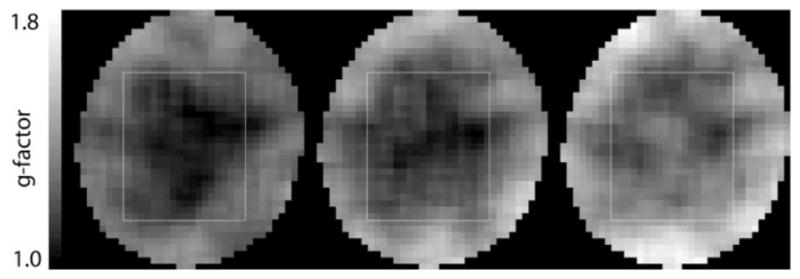
g-factor maps for SENSE-reconstructed spectra from a healthy volunteer acquired with water suppression for acceleration factors ranging from 2 to 4 (left to right).
FIG. 7.
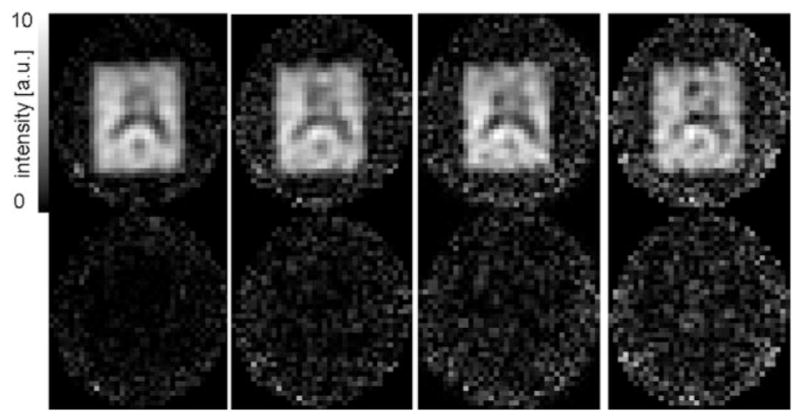
Metabolic maps for NAA (top) from a healthy volunteer and the corresponding difference maps with respect to the reference standard (bottom) for acceleration factors ranging from 1 – 4 (left to right). The position of the PRESS box is indicated in Fig. 5a.
DISCUSSION AND CONCLUSION
This proof-of-principle study demonstrates the feasibility of combining fast spiral CSI with an iterative SENSE reconstruction. By exploiting the inhomogeneous sensitivity profiles of an eight-channel coil array at 3T, parallel imaging allows one to reduce scan time by undersampling the data in the spatial frequency domain without causing aliasing artifacts. This is at the expense of both decreased SNR per unit measurement time and increased computation time for reconstruction. The increase of the g-factor for higher acceleration factors and the corresponding drop in time-normalized SNR, measured both in the phantom and in vivo, indicate additional noise contributions due to the conditioning of the parallel imaging reconstruction problem, which decreases with increasing R. Unlike parallel imaging enhanced EPSI, where all acceleration occurs along one spatial dimension, spiral CSI utilizes the receiver coils distributed around the head more efficiently and, thus, affords higher acceleration factors. Moreover, at identical reduction factors, spiral imaging has less pronounced regions with high g-factors (see Figs. 3, 6) than 1D-SENSE approaches. Due to the small matrix size, the iterative SENSE reconstruction of a dataset for R = 4 and 24 iterations takes only 11 min on a 2.33 GHz Intel Core 2 processor. Benchmarks for individual reconstruction steps are given in Table 1. Because the spatial reconstruction is carried out independently for each spectral point, the problem can be parallelized using multiple processors and offers significant speed-up capacity. Further analysis of the noise/artifact characteristics, e.g., dependence on the number of iterations, which does not need to be the same for all spectral points and how this is affected by SNR1 is the topic of future work.
Table 1.
Benchmarks for Iterative SENSE
| R | nksamples | Q | v0 | 1st iter | 2nd…nth |
|---|---|---|---|---|---|
| 1 | 2784 | 0.15 sec | 0.30 sec | 0.08 sec | 0.04 sec |
| 2 | 1392 | 0.12 sec | 0.24 sec | 0.08 sec | 0.04 sec |
| 3 | 928 | 0.07 sec | 0.16 sec | 0.09 sec | 0.04 sec |
| 4 | 696 | 0.09 sec | 0.15 sec | 0.09 sec | 0.04 sec |
| 6 | 464 | 0.07 sec | 0.14 sec | 0.08 sec | 0.04 sec |
R, Reduction factor; nksamples, number of k-space points gridded, Q, transfer function (convolution matrix) (see Ref. (22)); v0, gridding of sampled k-space data (initial [undersampled] estimate image = gridding recon); 1st iter, first iteration; 2nd …nth iter, all the remaining iterations.
Potential applications of the method include the combination of spiral CSI and multi-TE experiments such as CT-PRESS (24,25), 2D J-resolved spectroscopy (26 – 29), and the mapping of metabolite transverse relaxation constants (30), especially if extended to volumetric measurements. Moreover, fast metabolic imaging of hyperpolarized 13C is a particularly suited application for this method (31–33). The hyperpolarized substrate provides high SNR and requires rapid acquisition times while at the same time the lower gyromagnetic ratio of 13C corresponds to a 4-fold decrease in gradient performance when compared to proton CSI. Another application is fast spiral CSI at higher field, such as 7T. Although the increased dispersion of the chemical shift sets higher demands on the gradient hardware, increased SNR and more distinct B1 profiles of the coil array elements should improve parallel imaging performance (34).
Acknowledgments
Grant sponsor: Lucas Foundation; Grant sponsor: National Institutes of Health (NIH); Grant numbers: RR09784, AA12388, AA13521, EB002711.
References
- 1.Adalsteinsson E, Irarrazabal P, Topp S, Meyer C, Macovski A, Spielman DM. Volumetric spectroscopic imaging with spiral-based k-space trajectories. Magn Reson Med. 1998;39:889– 898. doi: 10.1002/mrm.1910390606. [DOI] [PubMed] [Google Scholar]
- 2.Brown TR, Kincaid BM, Ugurbil K. NMR chemical shift imaging in three dimensions. Proc Natl Acad Sci U S A. 1982;79:3523–3526. doi: 10.1073/pnas.79.11.3523. [DOI] [PMC free article] [PubMed] [Google Scholar]
- 3.Maudsley AA, Hilal SK, Perman WH, Simon HE. Spatially resolved high resolution spectroscopy by “four-dimensional” NMR. J Magn Reson. 1983;51:147–152. [Google Scholar]
- 4.Sodickson DK, Manning WJ. Simultaneous acquisition of spatial harmonics (SMASH): fast imaging with radiofrequency coil arrays. Magn Reson Med. 1997;38:591– 603. doi: 10.1002/mrm.1910380414. [DOI] [PubMed] [Google Scholar]
- 5.Pruessmann KP, Weiger M, Scheidegger MB, Boesiger P. SENSE: sensitivity encoding for fast MRI. Magn Reson Med. 1999;42:952–962. [PubMed] [Google Scholar]
- 6.Griswold MA, Jakob PM, Heidemann RM, Nittka M, Jellus V, Wang J, Kiefer B, Haase A. Generalized autocalibrating partially parallel acquisitions (GRAPPA) Magn Reson Med. 2002;47:1202–1210. doi: 10.1002/mrm.10171. [DOI] [PubMed] [Google Scholar]
- 7.Pruessmann KP, Weiger M, Bornert P, Boesiger P. Advances in sensitivity encoding with arbitrary k-space trajectories. Magn Reson Med. 2001;46:638– 651. doi: 10.1002/mrm.1241. [DOI] [PubMed] [Google Scholar]
- 8.Qian Y, Zhang Z, Stenger VA, Wang Y. Self-calibrated spiral SENSE. Magn Reson Med. 2004;52:688– 692. doi: 10.1002/mrm.20197. [DOI] [PubMed] [Google Scholar]
- 9.Yeh EN, Stuber M, McKenzie CA, Botnar RM, Leiner T, Ohliger MA, Grant AK, Willig-Onwuachi JD, Sodickson DK. Inherently self-calibrating non-Cartesian parallel imaging. Magn Reson Med. 2005;54:1– 8. doi: 10.1002/mrm.20517. [DOI] [PubMed] [Google Scholar]
- 10.Heberlein K, Hu X. Auto-calibrated parallel spiral imaging. Magn Reson Med. 2006;55:619– 625. doi: 10.1002/mrm.20811. [DOI] [PubMed] [Google Scholar]
- 11.Heidemann RM, Griswold MA, Seiberlich N, Kruger G, Kannengiesser SA, Kiefer B, Wiggins G, Wald LL, Jakob PM. Direct parallel image reconstructions for spiral trajectories using GRAPPA. Magn Reson Med. 2006;56:317–326. doi: 10.1002/mrm.20951. [DOI] [PubMed] [Google Scholar]
- 12.Dydak U, Weiger M, Pruessmann KP, Meier D, Boesiger P. Sensitivity-encoded spectroscopic imaging. Magn Reson Med. 2001;46:713–722. doi: 10.1002/mrm.1250. [DOI] [PubMed] [Google Scholar]
- 13.Dydak U, Pruessmann KP, Weiger M, Tsao J, Meier D, Boesiger P. Parallel spectroscopic imaging with spin-echo trains. Magn Reson Med. 2003;50:196– 200. doi: 10.1002/mrm.10495. [DOI] [PubMed] [Google Scholar]
- 14.Lin FH, Tsai SY, Otazo R, Caprihan A, Wald LL, Belliveau JW, Posse S. Sensitivity-encoded (SENSE) proton echo-planar spectroscopic imaging (PEPSI) in the human brain. Magn Reson Med. 2007;57:249– 257. doi: 10.1002/mrm.21119. [DOI] [PubMed] [Google Scholar]
- 15.Rueckert M, Otazo R, Posse S. GRAPPA reconstruction of sensitivity encoded 2D and 3D proton echo planar spectroscopic imaging (PEPSI) with SNR adaptive recalibrating. Proc 14th Annual Meeting ISMRM; Seattle, WA. 2006. p. 296. [Google Scholar]
- 16.Zhu X, Ebel A, Ji JX, Schuff N. Spectral phase-corrected GRAPPA reconstruction of three-dimensional echo-planar spectroscopic imaging (3D-EPSI) Magn Reson Med. 2007;57:815– 820. doi: 10.1002/mrm.21217. [DOI] [PubMed] [Google Scholar]
- 17.Jackson JI, Meyer CH, Nishimura DG, Macovski A. Selection of a convolution function for Fourier inversion using gridding [computerised tomography application] IEEE Trans Med Imaging. 1991;10:473–478. doi: 10.1109/42.97598. [DOI] [PubMed] [Google Scholar]
- 18.Kim D-H, Adalsteinsson E, Spielman DM. PRESS CSI with spiral readout gradients. Proc 10th Annual Meeting ISMRM; Honolulu, HI. 2002. p. 2493. [Google Scholar]
- 19.Golay X, Gillen J, van Zijl PC, Barker PB. Scan time reduction in proton magnetic resonance spectroscopic imaging of the human brain. Magn Reson Med. 2002;47:384– 387. doi: 10.1002/mrm.10038. [DOI] [PubMed] [Google Scholar]
- 20.Haase A, Frahm J, Hanicke W, Matthaei D. 1H NMR chemical shift selective (CHESS) imaging. Phys Med Biol. 1985;30:341–344. doi: 10.1088/0031-9155/30/4/008. [DOI] [PubMed] [Google Scholar]
- 21.Tran TK, Vigneron DB, Sailasuta N, Tropp J, Le Roux P, Kurhanewicz J, Nelson S, Hurd R. Very selective suppression pulses for clinical MRSI studies of brain and prostate cancer. Magn Reson Med. 2000;43:23–33. doi: 10.1002/(sici)1522-2594(200001)43:1<23::aid-mrm4>3.0.co;2-e. [DOI] [PubMed] [Google Scholar]
- 22.Wajer FTA, Pruessmann KP. Major speedup of reconstruction for sensitivity encoding with arbitrary trajectories. Proc 9th Annual Meeting ISMRM; Glasgow, Scotland. 2001. p. 767. [Google Scholar]
- 23.Qu P, Zhong K, Zhang B, Wang J, Shen GX. Convergence behavior of iterative SENSE reconstruction with non-Cartesian trajectories. Magn Reson Med. 2005;54:1040– 1045. doi: 10.1002/mrm.20648. [DOI] [PubMed] [Google Scholar]
- 24.Dreher W, Leibfritz D. Detection of homonuclear decoupled in vivo proton NMR spectra using constant time chemical shift encoding: CT-PRESS. Magn Reson Imaging. 1999;17:141–150. doi: 10.1016/s0730-725x(98)00156-8. [DOI] [PubMed] [Google Scholar]
- 25.Mayer D, Kim DH, Adalsteinsson E, Spielman DM. Fast CT-PRESS-based spiral chemical shift imaging at 3 Tesla. Magn Reson Med. 2006;55:974– 978. doi: 10.1002/mrm.20853. [DOI] [PubMed] [Google Scholar]
- 26.Dreher W, Leibfritz D. On the use of two-dimensional-J NMR measurements for in vivo proton MRS: measurement of homonuclear decoupled spectra without the need for short echo times. Magn Reson Med. 1995;34:331–337. doi: 10.1002/mrm.1910340309. [DOI] [PubMed] [Google Scholar]
- 27.Adalsteinsson E, Spielman DM. Spatially resolved two-dimensional spectroscopy. Magn Reson Med. 1999;41:8– 12. doi: 10.1002/(sici)1522-2594(199901)41:1<8::aid-mrm3>3.0.co;2-d. [DOI] [PubMed] [Google Scholar]
- 28.Hurd R, Sailasuta N, Srinivasan R, Vigneron DB, Pelletier D, Nelson SJ. Measurement of brain glutamate using TE-averaged PRESS at 3T. Magn Reson Med. 2004;51:435– 440. doi: 10.1002/mrm.20007. [DOI] [PubMed] [Google Scholar]
- 29.Srinivasan R, Cunningham C, Chen A, Vigneron D, Hurd R, Nelson S, Pelletier D. TE-averaged two-dimensional proton spectroscopic imaging of glutamate at 3 T. Neuroimage. 2006;30:1171–1178. doi: 10.1016/j.neuroimage.2005.10.048. [DOI] [PubMed] [Google Scholar]
- 30.Tsai SY, Posse S, Lin YR, Ko CW, Otazo R, Chung HW, Lin FH. Fast mapping of the T2 relaxation time of cerebral metabolites using proton echo-planar spectroscopic imaging (PEPSI) Magn Reson Med. 2007;57:859– 865. doi: 10.1002/mrm.21225. [DOI] [PubMed] [Google Scholar]
- 31.Golman K, Petersson JS. Metabolic imaging and other applications of hyperpolarized 13C1. Acad Radiol. 2006;13:932–942. doi: 10.1016/j.acra.2006.06.001. [DOI] [PubMed] [Google Scholar]
- 32.Golman K, in ’t Zandt R, Thaning M. Real-time metabolic imaging. Proc Natl Acad Sci U S A. 2006;103:11270– 11275. doi: 10.1073/pnas.0601319103. [DOI] [PMC free article] [PubMed] [Google Scholar]
- 33.Mayer D, Levin YS, Hurd RE, Glover GH, Spielman DM. Fast metabolic imaging of systems with sparse spectra: application for hyperpolarized 13C imaging. Magn Reson Med. 2006;56:932–937. doi: 10.1002/mrm.21025. [DOI] [PubMed] [Google Scholar]
- 34.Wiesinger F, Van de Moortele PF, Adriany G, De Zanche N, Ugurbil K, Pruessmann KP. Potential and feasibility of parallel MRI at high field. NMR Biomed. 2006;19:368– 378. doi: 10.1002/nbm.1050. [DOI] [PubMed] [Google Scholar]


