Abstract
Recent work demonstrated the efficacy of combining layer-by-layer assembly with hydrogels to provide the controlled delivery of proteins for use in nerve repair scaffolds. In this work, we augmented the protein dose response by controlling and increasing the hydrogel internal surface area. Sucrose was added to agarose during gelation to homogenize the nanopore morphology, resulting in increased surface area per unit volume of hydrogel. The surface area of a range of compositions (1.5 to 5.0 wt% agarose and 0, 50 and 65 wt% sucrose) was measured. Gels were supercritically dried to preserve porosity enabling detailed pore morphology measurements using nitrogen adsorption and high resolution scanning electron microscopy. The resulting surface area, normalized by superficial gel volume, ranged between 6 and 56m2/ccgel. Using the layer-by-layer process to load lysozyme, a neurotrophic factor analog, a relationship was observed between surface area and cumulative dose response ranging from 176 to 2556 μg/mL, which is in the range of clinical relevance for the delivery of growth factors. In this work, we demonstrated that the ability to control porosity is key in tuning drug delivery dose response from layer-by-layer modified hydrogels.
Keywords: Layer-by-layer, hydrogel, controlled drug release, pore refinement, surface area
1. Introduction
Drug delivery technology has the potential to provide therapies to treat numerous diseases (Allen & Cullis, 2004; Ariga, Lvov, Kawakami, Ji, & Hill, 2011; Ganta, Devalapally, Shahiwala, & Amiji, 2008; Kharlampieva, Kozlovskaya, & Sukhishvili, 2009; Samad, Sultana, & Aqil, 2007). Specifically, targeted drug delivery can release optimum concentrations, thus reducing toxicity while matching therapeutic drug levels (Reddy & Swarnalatha, 2010) and enhancing efficacy (Teo, Shearwood, Ng, Lu, & Moochhala, 2006). Selective delivery to specific regions of the body reduces potential negative side effects of systemic drug deliveries such as those observed in oncology and therapies to treat diabetes (Brewer, Coleman, & Lowman, 2011; Damgé, Maincent, & Ubrich, 2007; Maeda, 2001). There are numerous approaches, including polymeric nanoparticles (Chan, Valencia, Zhang, Langer, & Farokhzad, 2010; Kumari, Yadav, & Yadav, 2010; Mishra, Patel, & Tiwari, 2010; Soppimath, Aminabhavi, Kulkarni, & Rudzinski, 2001), solid lipid nanoparticles (Almeida & Souto, 2007; Blasi, Giovagnoli, Schoubben, Ricci, & Rossi, 2007; Kaur, Bhandari, Bhandari, & Kakkar, 2008), and polymeric micelles (Bae, Diezi, Zhao, & Kwon, 2007; Bromberg, 2008; Nakayama et al., 2006; Chau-Hui Wang, Wang, & Hsiue, 2005). Polymeric nanoparticles generally consist of biodegradable synthetic polymers that release drugs as they degrade. Solid lipid nanoparticles composed of solid hydrophobic drug-containing core are less toxic than polymeric nanoparticles. Polymeric micelles contain hydrophilic and hydrophobic regions and release their contents upon pH or temperature changes. However, these delivery systems are ineffective for long-term applications due to the characteristic initial burst phase and subsequent low release concentrations over extended periods. Thus, applications demonstrating prolonged and controlled release could provide a significant advantage over systemic or burst delivery technologies by reducing treatment frequency and reducing patient discomfort.
Hydrogels, such as those consisting polyethylene glycol, alginate, chitosan, and hyaluronic acid, have been used in biomedical applications (Burdick & Prestwich, 2011; Jagur-Grodzinski, 2010; Klouda & Mikos, 2008; Van Tomme, Storm, & Hennink, 2008), and are especially attractive for drug delivery. Hydrogels consist of interconnected porosity that can be saturated with a variety of solutions (Kurisawa, Lee, Wang, & Chung, 2010) and are known to exhibit high protein uptake and release (Allen & Cullis, 2004; Ariga et al., 2011; Ganta et al., 2008; Kharlampieva et al., 2009; Mehrotra et al., 2010; Samad et al., 2007; J Wang et al., 2009). Agarose, in particular, is a neutral, linear polysaccharide obtained from algae (Reddy & Swarnalatha, 2010; Stokols et al., 2006) that can form a thermo-reversible hydrogel (Normand, 2003; Teo et al., 2006; Watase, Nishinari, Williams, & Phillips, 1990). Agarose is amendable to tissue engineering applications because of its biocompatibility (Brewer et al., 2011; Damgé et al., 2007; Maeda, 2001; Stokols et al., 2006), interconnected porous microstructure (Chan et al., 2010; Fatin-Rouge, Milon, Buffle, Goulet, & Tessier, 2003; Gutenwik, Nilsson, & Axelsson, 2004; Kumari et al., 2010; Liang et al., 2006; Maaloum, Pernodet, & Tinland, 1998; Mehrotra et al., 2010; Mishra et al., 2010; Soppimath et al., 2001; Xiong et al., 2005), tunable mechanical properties (Almeida & Souto, 2007; Blasi et al., 2007; Kaur et al., 2008; Normand, 2003), and long-term stability in vivo (Bae et al., 2007; Bromberg, 2008; Nakayama et al., 2006; Stokols et al., 2006; Chau-Hui Wang et al., 2005). However, native agarose exhibits diffusion-controlled release (Burdick & Prestwich, 2011; Jagur-Grodzinski, 2010; Klouda & Mikos, 2008; Mehrotra et al., 2010; Van Tomme et al., 2008; J Wang et al., 2009) with an initial burst phase rather than sustained controlled release, thus precluding its use in applications requiring controlled and prolonged delivery. To address this limitation, Mehrotra et al. functionalized agarose using a layer-by-layer (LbL) process to provide the controlled release of peptides (Kurisawa et al., 2010; Mehrotra et al., 2010) or small molecule inhibitors (Mehrotra et al., 2012), with clinical relevance to both spinal cord injury repair (Lynam et al., 2011; Stokols et al., 2006) and disease treatment (Nuo Wang & Wu, 1998).
Mehrotra et al. also showed that changing the wt% of agarose significantly affected the dose response (Mehrotra et al., 2010). This was attributed to an increase in internal surface area with increasing agarose wt%, which resulted in an increase in area functionalized by the LbL process. Building upon this approach, this work investigated the addition of sucrose to agarose to amplify the internal surface area (Normand, 2003; Tsoga, Kasapis, & Richardson, 1999; Watase et al., 1990). The presence of sucrose during gelation causes a reduction in the agarose crosslink aggregation leading to a decrease in turbidity and correlation length between agarose helices (Normand, 2003). The improved uniformity in the helices, therefore, can also impact the pore uniformity; specifically increasing the volume of nano (2-50 nm) pores that can act as binding sites for the protein molecules through the LbL process. In this study, the effect of sucrose on pore distribution and surface area of agarose hydrogels was explored for the purpose of increasing the nanopore volume, thus augmenting the dose response. Alterations in bulk physical properties and the effects of LbL deposition on the agarose hydrogels were also investigated. Lysozyme was selected as a model release protein because of its known compatibility with this LbL system, and its relevancy to drug delivery for nerve repair. For example, the isoelectric point (pI∼11) and molecular weight (∼14kDa) of lysozyme are comparable to brain derived neurotrophic factor (BDNF), which is frequently used in central and peripheral nervous system repair. We believe selecting a drug analog enables detailed investigations into the interactions between hydrogels and LbL deposition that would be cost prohibitive otherwise.
2. Materials and Methods
2.1 Hydrogel Fabrication
Sucrose syrup was synthesized by mixing reverse osmosis (RO) water and sucrose crystals and heated to 95°C with agitation for at least six hours to ensure full dissolution. Sucrose was purchased from J.T. Baker (Center Valley, PA).
Nine categories of hydrogels were explored, as outlined in Table 1. To synthesize hydrogels, sucrose syrup or RO water was mixed with agarose powder purchased from Sigma-Aldrich (St. Louis, MO). To obtain the same agarose concentration between sample groups, the sugar concentration was considered when determining weight percentage. Each solution was mixed by vortexing three times for 15 seconds, followed by microwave heating for 10 seconds. To remove bubbles, samples were centrifuged at 500 RPM for 10 seconds while in the molten state. The hot (>90°C) agarose solution was poured into 12-well tissue culture polystyrene (TCPS) plates (Costar, Corning, NY) and allowed to cool under room temperature for at least six hours. To prevent dehydration, RO water was floated on the surface of the samples after gelation and the TCPS lid was placed over top. For drug release studies, each well contained 3cc of agarose hydrogel. Any hydrogel samples that developed defects during gelation, such as bubbles, were discarded.
Table 1. Hydrogel Ratios in Wet State.
| Sample | |
|---|---|
| Agarose (wt%) |
Sucrose (wt%) |
| 1.5% | 0% |
| 3.0% | 0% |
| 5.0% | 0% |
| 1.5% | 50% |
| 3.0% | 50% |
| 5.0% | 50% |
| 1.5% | 65% |
| 3.0% | 65% |
| 5.0% | 65% |
All hydrogel samples were taken out of the well plate mold and placed into a pure water bath to remove sucrose from the pore fluid. The water wash fluid was at least 10 times the volume of the gel, and was replaced twice, each time submerging the gels for 24 hours.
2.2 Supercritical Drying and Scanning Electron Microscopy
To prepare for supercritical drying, agarose hydrogel pore fluid was replaced with pure ethanol. However, to avoid bubble formation within the hydrogels during solvent exchange, a specific sequence was performed. The first ethanol wash consisted of a 1:3 ratio of ethanol to RO water. Successive ethanol wash fluids were repeated with increasing increments of 25% ethanol, until 100% ethanol was achieved. Following, the gels were washed twice more with 100% ethanol. Each wash was at least 10 times the volume of the gel, and the gels were submerged for 24 hours.
Following washing, the gels were placed in a critical point dryer (Pressure Products Inc. Warminster, PA). The ethanol within the gel pores was exchanged with ultra high purity liquid carbon dioxide (Airgas, Independence, OH) and the supercritical point was reached. Supercritically dried gels were then stored in a 0.5ppm moisture, 0.2ppm oxygen, argon-filled glovebox until further testing. This was done to prevent reactions with moisture in ambient air that could affect the nitrogen adsorption measurements.
The hydrogel skeletal structure was visualized using scanning electron microscopy (SEM) imaging. Supercritically dried hydrogels were cut into approximately 1mm3 cubes and osmium coated for imaging. SEM images were obtained with a field emission JEOL 7500F electron microscope.
2.3 BET
Brunauer-Emmett-Teller (BET) surface area and pore volume characterization was performed by nitrogen adsorption (Micromeretics ASAP 2020, Norcross, GA). Ultra high purity helium and ultra high purity nitrogen was used to measure free space and surface area, respectively. To fit into the test chamber, samples were cut into small millimeter-scale pieces using a scalpel. Samples were degassed under vacuum at 80°C for twelve hours to remove residual water vapor before nitrogen adsorption was initialized. Due to practical constraints, each BET analysis had an N=1 supercritically dried hydrogel per sample group. However, to address the need for statistical significance, one formulation, 5wt% agarose-50wt% sucrose, was analyzed using N=3.
2.4 Layer by Layer
Poly(acrylic acid) solution (PAA, Mw 15,000), poly(ethylene glycol) (PEG, Mw 10,000), branched poly(ethyleneimine) (BPEI, Mw 25,000), and lysozyme (Lyso) from chicken egg white were purchased from Sigma–Aldrich. PAA and PEG polymer solutions for LbL were prepared in deionized (DI) water to final concentrations of 1mg/mL, and their pH was adjusted to 2.0.
Lysozyme was dissolved in 1x phosphate buffered saline (PBS) (Life Technologies, Grand Island, NY) at a concentration of 1mg/mL and solution pH was adjusted to 3.0. This slightly higher pH was a cautionary measure to ensure dissolved lysozyme would not denature over time. DI water adjusted to pH 2.0 was used for the wash solutions during the assembly fabrication. All solutions were pH adjusted with hydrochloric acid. Agarose hydrogel samples (3cc/well) constrained within 12-well polystyrene plates were coated with LbL by a previously described method (Mehrotra et al., 2010). Briefly, samples were first immersed in BPEI at a concentration of 1mg/mL and pH 10.5 for 15 minutes. Sodium hydroxide was used to adjust BPEI solution pH. BPEI was chosen as the initial LbL layer because it adsorbs onto hydrophobic regions (Jiang, Clark, & Hammond, 2001) and is able to hydrogen bond with hydroxyl groups present on the surface of agarose (Mehrotra et al., 2010). For the first LbL cycle, the hydrogel samples were immersed in PAA solution for 30 min, and then washed in pH-adjusted DI water for 10 min. Following the first PAA layer and subsequent wash, the samples were immersed in PEG solution for 30 min and washed for 10min in pH-adjusted DI water. This was repeated five times, for a total of 10 bilayers. For the next cycle, the samples were layered with alternating lysozyme and PEG with the same process as described above. This cycle was also performed five times. The (PAA/PEG)5 + (Lysozyme/PEG)5 was repeated a total of three times. Lastly, one layer of PAA was used as a terminating layer, followed by a 15 minutes final wash solution of pH-adjusted DI water. All immersions were done with agitation. Upon completion, the LbL process deposited a total of 30.5 LbL bilayers. The sequence of prepared bilayers of PAA, PEG and lysozyme is as follows: BPEI[(PAA/PEG)5(Lysozyme/PEG)5]3PAA. 30.5 bilayers was determined to be the optimal amount since it was shown previously (Mehrotra et al., 2010) that additional bilayer deposition is unstable and breaks off in solution.
To facilitate lysozyme release from LbL, 1mL of fresh 1xPBS was floated on the surface of each LbL-coated agarose coupon within the well plate. To obtain cumulative profiles of lysozyme release, the lysozyme-containing PBS was removed and replaced with fresh 1xPBS (1 mL) every 24 hours for nine days to facilitate additional LbL-mediated lysozyme release. The collected buffer solution was stored at -20°C. Concentrations of the lysozyme released from the LbL-coated hydrogels were measured by bicinchoninic acid (BCA) or micro-BCA protein assay (Pierce, Rockford, IL) according to the manufacturer's instruction. The release concentrations obtained at each 24-hour sampling interval were added to obtain the cumulative release profiles. Lysozyme concentrations were measured by a SPECTRA-MAX GEMINI-EM fluorescence plate reader (Molecular Devices, Sunnyvale, CA) in a 96-well plate at an excitation wavelength of 562nm with bottom-read option. The plate reader was calibrated using a standard curve for the lysozyme concentration dissolved in 1xPBS.
3. Results
3.1 Macroscopic Effects of Sucrose
The addition of sucrose to agarose hydrogels impacts the hydrogel characteristics, and can be visualized macroscopically. Sucrose modified agarose hydrogels appear optically clear, compared to the translucent appearance of non-modified agarose hydrogels, and agrees with the results from Normand et al. (Normand, 2003). This is due to the diffraction of light through the hydrogel nanopores, causing the unmodified gels to appear blue in color. However, in sucrose-modified gels, the pore size is too small for light to scatter, and thus appear clear. Macroscopic sugar crystals several millimeters in length were observed in the 5wt% agarose-65wt% sucrose samples due to oversaturation and precipitation of the sucrose. This resulted in inhomogeneities within this particular hydrogel composition, making correlations between the BET measurements and lysozyme release profiles inconsistent.
3.2 BET
Sucrose is hypothesized to affect the size and distribution of the pores within the agarose hydrogel. To confirm this, BET adsorption measurements of the surface area and nanopore volume were conducted. Although this analysis technique can measure the total surface area, the method for measuring nanopore volume is limited to pores sizes <50nm. Thus, the Barrett-Joyner-Halenda (BJH) desorption method was chosen to measure the nanopore volume. Undoubtedly, the hydrogel exhibits pores in the meso-to-macro spectrum, as evidenced by the scattering of visible light at the macroscopic level. However, the majority of internal surface area is derived from the nanometer and smaller pores (Normand, 2003), thus the BJH method is appropriate.
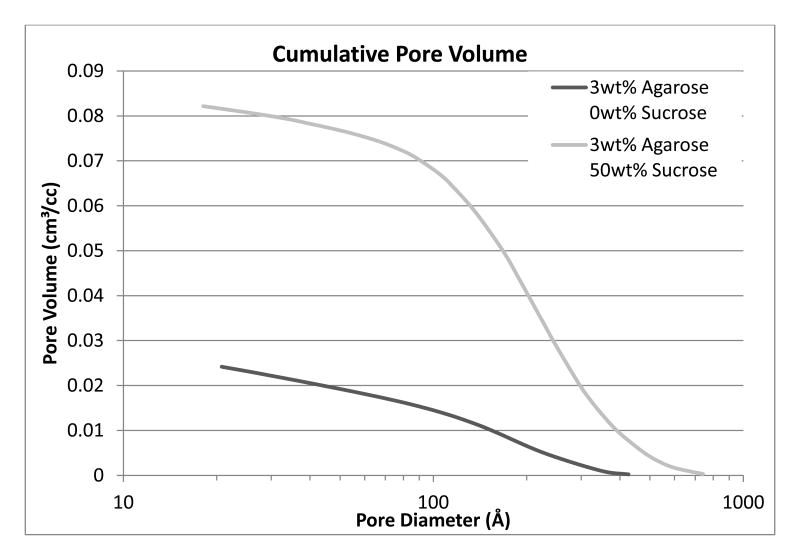
Analysis with nitrogen adsorption was conducted to characterize the nanopore size and distribution in the unmodified and sucrose-modified 3wt% agarose samples. The cumulative pore volume of the 3wt% agarose-50wt% sucrose samples dramatically increased, approaching a fourfold increase as compared to the 3wt% agarose samples with a similar nanopore distribution (Figure 1). Additionally, the marked increase of the cumulative pore volume in the 10-12nm range supports a significantly higher volume of smaller pores.
Figure 1. Cumulative pore volume of 3wt% unmodified and 50wt% sucrose-modified hydrogels using BJH desorption.
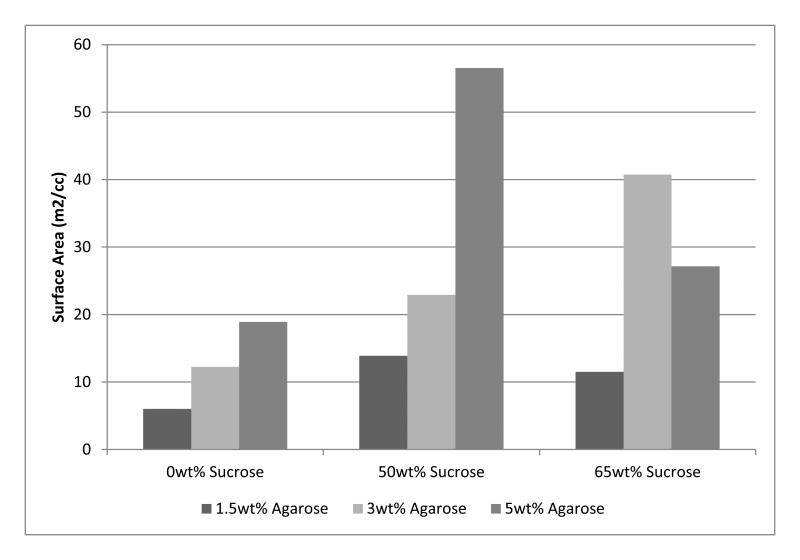
Nitrogen adsorption was also used for surface area comparison (Table 2). The surface area per unit volume increased significantly with higher agarose wt%, which was further enhanced with the addition of sucrose (Figure 2). The 5wt% agarose-50wt% sucrose, 3wt% agarose-65wt% sucrose, and 1.5wt% agarose-50wt% sucrose samples exhibit the highest surface area per unit volume in each sample group. Although the agarose hydrogel surface area and nanopore volume increased with the addition of sucrose, there is an apparent upper limit to the benefit of adding sucrose. Beyond 50wt% sucrose, the surface area and nanopore volume decreased but were still higher than the unmodified gels. This trend was present for all samples except for 3wt% agarose-65wt% sucrose, which will be explained in later sections. Additionally, the 5wt% agarose-50wt% sucrose composition (with N=3), were shown to have a standard deviation of 1.613 m2/cc, thus demonstrating reasonable statistical relevance.
Table 2. Hydrogel surface area per unit volume and corresponding lysozyme release.
| Sample | Surface Area (m2/cc) | Cumulative Release at Day 9 (μg/mL) |
|---|---|---|
| 1.5wt% Agarose 0wt% Sucrose | 6.012 | 175.9 |
| 1.5wt% Agarose 50wt% Sucrose | 13.890 | 1684.1 |
| 1.5wt% Agarose 65wt% Sucrose | 11.503 | 497.2 |
| 3wt% Agarose 0wt% Sucrose | 12.259 | 476.6 |
| 3wt% Agarose 50wt% Sucrose | 22.937 | 1383.9 |
| 3wt% Agarose 65wt% Sucrose | 40.734 | 2104.4 |
| 5wt% Agarose 0wt% Sucrose | 18.924 | 403.6 |
| 5wt% Agarose 50wt% Sucrose | 56.525 | 2556.2 |
| 5wt% Agarose 65wt% Sucrose | 27.163 | 1684.9 |
Figure 2. Surface area per unit volume of unmodified and sucrose-modified agarose hydrogels.
3.3 Supercritical Drying and SEM
SEM imaging was used to visualize the microstructural changes induced with the addition of sucrose (Figures 3 and 4). Compared to the unmodified samples, sucrose modified hydrogels exhibited smaller and more uniform pore sizes. Additionally, sucrose modified samples showed a more uniform dispersion of agarose crosslinks. These results agree with those of previous studies (Normand, 2003) and provide qualitative evidence that support the quantitative BET data.
Figure 3.
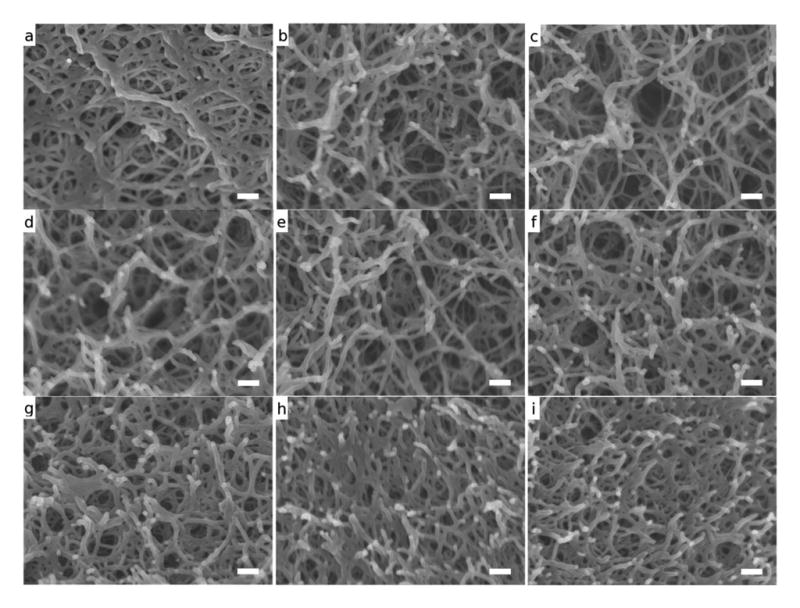
SEM images of hydrogel fracture surfaces at 100,000X (a) 1.5wt% agarose (b) 1.5wt% agarose-50wt% sucrose (c) 1.5wt% agarose-65wt% sucrose (d) 3wt% agarose (e) 3wt% agarose-50wt% sucrose (f) 3wt% agarose-65wt% sucrose (g) 5wt% agarose (h) 5wt% agarose-50wt% sucrose (i) 5wt% agarose-65wt% sucrose. Scalebars are 100nm
Figure 4.
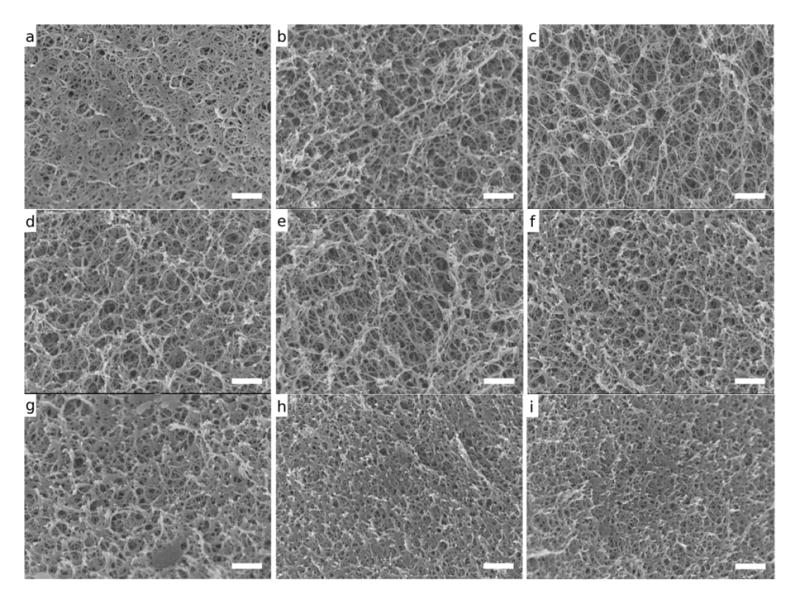
SEM Images of hydrogel fracture surfaces at 30,000X (a) 1.5wt% agarose (b) 1.5wt% agarose-50wt% sucrose (c) 1.5wt% agarose-65wt% sucrose (d) 3wt% agarose (e) 3wt% agarose-50wt% sucrose (f) 3wt% agarose-65wt% sucrose (g) 5wt% agarose (h) 5wt% agarose-50wt% sucrose (i) 5wt% agarose-65wt% sucrose. Scalebars are 500nm
3.4 Lysozyme Release from LbL
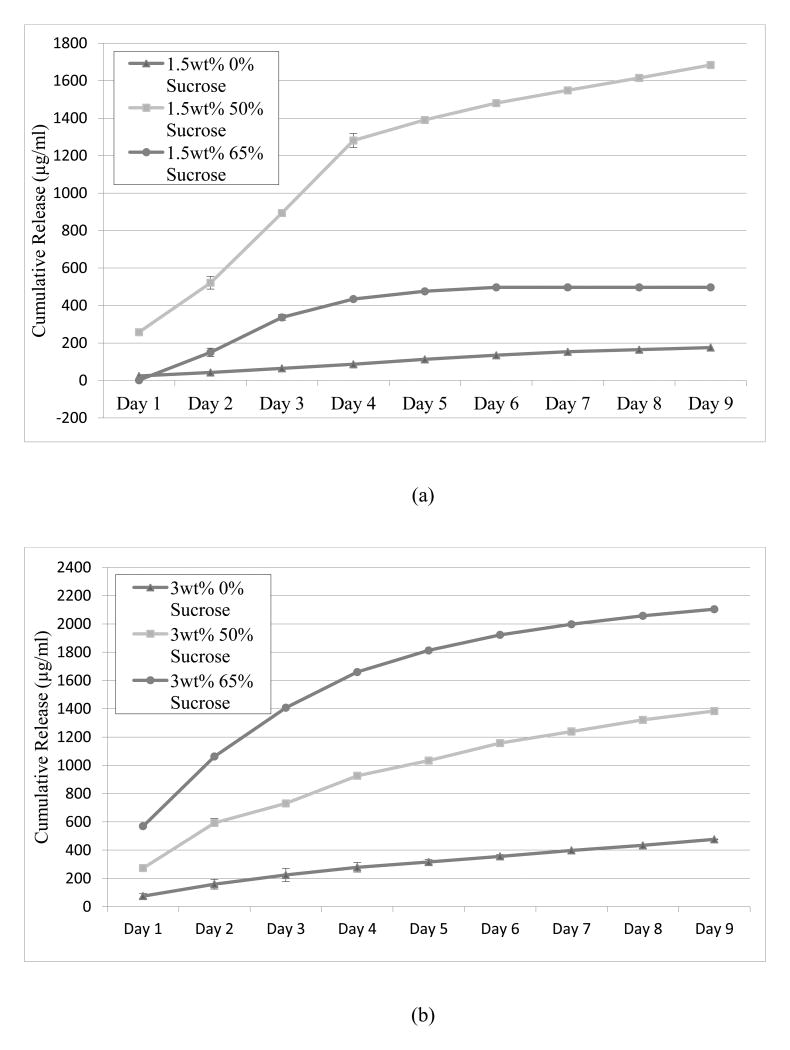
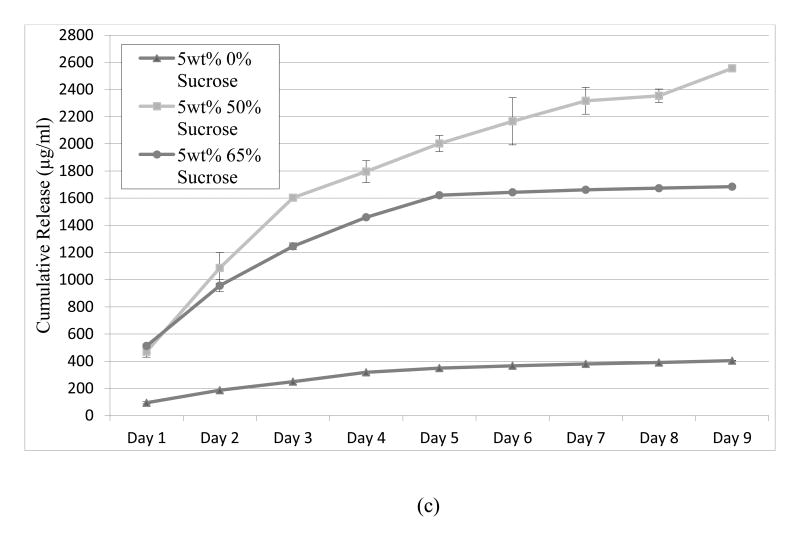
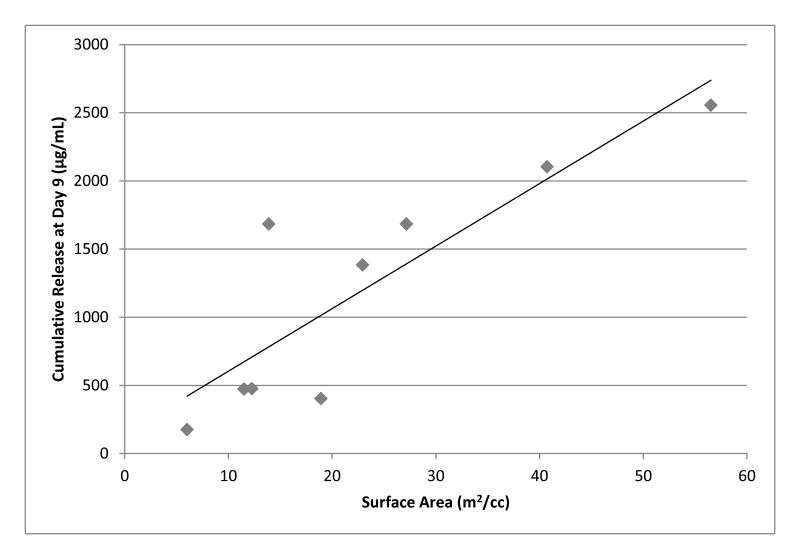
Lysozyme was loaded onto the hydrogel crosslink network using the LbL process and the release was measured by BCA or micro-BCA. It was expected that amplifying the surface area per unit volume of the gel should result in a commensurate increase in lysozyme release dose. Indeed, sugar modified hydrogels increased the nine-day cumulative release of lysozyme when compared to the unmodified samples (Figure 5). 5wt% agarose-50wt% sucrose and 3wt% agarose-65wt% sucrose were shown to release the highest quantity of lysozyme, exceeding 2000μg/mL cumulative release after 9 days; which is higher than previously reported (Mehrotra et al., 2010; 2012). The release from 3wt% agarose samples rose consistently with increasing sucrose concentrations. However, this was not the case for the 1wt% and 5wt% agarose samples, which exhibited a maximum lysozyme concentration at 50wt% sucrose with a sharp decline at 65wt% sucrose. Nevertheless, all the samples modified with sucrose showed a significant increase in protein release when compared to the unmodified agarose samples. The 1.5wt% agarose-65wt% sucrose showed the lowest increase in release, approximately doubling the amount from the unmodified 1.5wt% agarose. Yet, lysozyme release from the 1.5wt% agarose-50wt% sucrose samples increased over nine-fold as compared to the unmodified 1.5wt% agarose samples. Somewhat similar trends were observed in the 3 and 5wt% modified and unmodified compositions (Figure 5). A positive linear trend as a function of the surface area is observed for the cumulative release over nine days (Figure 6).
Figure 5.
Lysozyme release of unmodified and sucrose-modified agarose hydrogels (a) 1.5wt% agarose (b) 3wt% agarose (c) 5wt% agarose. N=6 lysozyme concentration measurements for each data point
Figure 6. Hydrogel cumulative release as a function of surface area per unit volume.
4. Discussion
The use of hydrogels in biomedical applications has increased significantly in recent years (Burdick & Prestwich, 2011; Jagur-Grodzinski, 2010; Klouda & Mikos, 2008; Van Tomme et al., 2008). For these applications, the physical properties play a critical role in governing interaction with the biological tissue. Functionalizing hydrogels by modulating the hydrogel porosity has been of recent and significant interest (Bhattarai, Gunn, & Zhang, 2010; Gupta, Vermani, & Garg, 2002; Hamidi, Azadi, & Rafiei, 2008; Hoare & Kohane, 2008). In this study, the hydrogel internal pore volume and surface area were augmented by the addition of sucrose during gelation. The increase in the surface area increases the number of protein binding sites per unit hydrogel volume, thereby resulting in a commensurate increase in the amount released.
4.1 Macroscopic Observations
Changes to the agarose porous microstructure with the addition of sucrose are evident macroscopically, as the sucrose-modified agarose hydrogel samples lacked the turbidity found in pure agarose hydrogels and appear optically clear. Normand et al. also observed clear sucrose-modified agarose hydrogels and concluded that the decreased turbidity observed in the sucrose modified gels is most likely due to a reduced degree of crosslink aggregation (Normand, 2003). The reduced aggregation yields finer and more uniformly distributed crosslinks with smaller cross-sectional radii. The presence of sucrose during gelation is believed to significantly lower the cooling rate, thus allowing more time for agarose helices to form a more uniform network. Additionally, sucrose may provide a steric effect that slows gelation resulting in more uniform gelation. Normand et al. demonstrated an upper limit of benefit for the amount of sucrose added to each formulation (Normand, 2003). Above 60wt% sucrose, the true strain and true stress at failure decreased, suggesting a less robust structure (Normand, 2003) and a reduced strain to failure. The 1.5wt% and 5wt% agarose containing more than 60wt% sucrose were found to form macroscale sucrose crystals within the hydrogel, compromising the integrity of the crosslinked network and possibly reducing the overall surface area. We believe that these macroscale defects also affected the lysozyme loading and release.
4.2 BET
The supercritical drying process enabled visualization and pore morphology characterization. If allowed to dry under ambient conditions, intense capillary forces associated with the evaporation of water would collapse the microporosity of the hydrogel and result in a dense mass not representing native hydrogel (Girifalco & Good, 1957; Good & Girifalco, 1960; Good, Girifalco, & Kraus, 1958). However, through supercritical fluid extraction, the initially hydrated internal pore structure is preserved in a dry state to enable nitrogen adsorption analyses and high resolution SEM analysis.
The addition of sugar has been shown (Aymard et al., 2001; Miyoshi, 1996; Nishinari et al., 1992; Normand, 2003; Tsoga et al., 1999; Watase et al., 1990) to affect the hydrogel framework. BET was used to characterize these changes to the gel matrix and provided insight to variations in the total nanopore volume and pore size distribution. In this work, the BJH desorption evaluation method was used to measure the pore size distributions up to 100nm in diameter. The model is based on the progressive pore filling of nanoporous materials with an increase in adsorbate pressure. A high cumulative pore volume indicates a gel primarily consisting of pores 100nm and smaller. In addition, a sharp increase in cumulative pore volume indicates a pore diameter range that accounts for the majority of the pore volume. The higher cumulative pore volume in the sucrose-modified gel (Figure 1) indicates a pore structure containing a higher concentration of smaller pores compared to the unmodified gels. In Figure 3a, the crosslinks appear agglomerated and the pore sizes vary considerably. In contrast, the 1.5wt% agarose-65wt% sucrose sample (Figure 3c) exhibits a more homogeneous distribution of crosslinks and consequently a more open and uniform pore network. This phenomenon is also observed when comparing 5wt% agarose with 5wt% agarose-65wt% sucrose (Figure 3g and Figure 3i).
Although the BJH desorption model only measures pores <100nm, pores greater than 100nm are clearly present within the monolith; as evidenced by SEM (Figure 4). However, since a significant portion of the microstructure consists of nanopores, BJH desorption analysis provides important information on the effects of sucrose on the hydrogel network formation. However, the range of pore size likely does not contribute significantly to the LbL deposition. The surface area, conversely, does and thus is a more relevant metric for explaining the increased lysozyme release observed.
The increase in internal gel surface area was achieved using two methods. First, increasing the weight percentage of the agarose increased the number of network crosslinks per volume. Second, samples of the same hydrogel weight percentage showed a decrease in the number of agglomerated crosslinks and an increase in the uniformity of the crosslink diameter as the sucrose concentration increased (Figures 3 and 4). These results are consistent with observations reported by Normand et al (Normand, 2003).
Although the addition of sucrose generally increased the nanopore volume and surface area, an optimal sucrose concentration could exist to maximize the surface area per unit gel volume. At 65wt% sucrose, the samples with 1.5wt% and 5wt% agarose showed a significant drop in surface area, though still higher than the unmodified gels. This was expected, as the 65wt% is beyond the solubility limit of sucrose; and is evidenced by the formation of sugar crystals within the hydrogel. However, this phenomenon was not present for the 3wt% agarose-65wt% sucrose samples. Although the exact cause is unknown, it is hypothesized that a balance between the increased strength of the agarose network prevented the microstructural collapse. Because the 1.5wt% agarose-65wt% sucrose samples are composed of a more open and consequently weaker structure, sucrose crystals likely created macroscopic defects in the hydrogel network, reducing the overall surface area. Similarly, in the 5wt% agarose-65wt% sucrose samples, the increased volume fraction of solid agarose dissolved in the syrup decreased the solubility of sucrose, causing precipitation and macroscale defects.
4.3 Layer-by-Layer
The LbL process provides a method of controlled drug release by hydrogen-bond stabilization. When dissolved in acidic aqueous solutions, PAA and PEG are able to hydrogen bond and form complexes (Mehrotra et al., 2010; 2012; Shiratori & Rubner, 2000; Stockton & Rubner, 1997; Sukhishvili & Granick, 2002; Zhuk, Pavlukhina, & Sukhishvili, 2009). Briefly, by immersing a agarose hydrogel into a sequence of PAA and PEG monomer solutions, LbL layers are formed until a desired thickness is reached. Intercalating a layer of lysozyme between PEG/PAA bilayers can be achieved by integrating a lysozyme immersion step into the LbL sequence (Mehrotra et al., 2010). If kept in an acidic solution, the LbL layers remain stable and will not degrade. However, upon exposure to a neutral solution, the layers become unstable, slowly disassembling and releasing the lysozyme.
To study protein release from agarose hydrogels, our previously established technique was used (Mehrotra et al., 2010). Sucrose modified hydrogels showed a dramatic increase in the release of lysozyme when compared to the unmodified compositions (Figure 5, Table 2). This is important for drug delivery systems requiring high concentrations of proteins to reach therapeutic levels, as well as enabling tuning over a range of doses. For example, clinical relevance for central nervous system repair requires the delivery of 50 ng/mL of brain derived neurotrophic factor per day (Johnson, Barde, Schwab, & Thoenen, 1986). Additionally, higher weight percentage agarose hydrogels release larger lysozyme dosages over time, agreeing with previously published results (Mehrotra et al., 2010). From the BET analysis it is noted that as the samples increased in surface area (Figure 2), the cumulative release also increased likely due to an increase in the concentration of binding sites, allowing for a higher lysozyme uptake, loading and release compared to the unmodified compositions.
LbL layers are thought to build within the nano-to-meso pore range (Mehrotra et al., 2010). Previous studies have shown that this particular LbL system, when fully assembled on flat surfaces, is approximately 600nm thick (Mehrotra et al., 2010); significantly larger than the pore sizes reported by BJH desorption. Although these larger pores are likely filled during the LbL process, they are not the main contributors to the controlled release. As observed in SEM analysis, the hydrogel primarily consists of pores with diameters that are <100nm. These pores are believed to be the source of the increased lysozyme release in the sucrose-modified samples.
It is hypothesized that during LbL assembly, the layers preferentially deposit in the smallest pores first followed by larger and larger pores until practically all the hydrogel porosity is filled (Figure 7). Finally, once the entire internal porosity is filled, the layers deposit on the outer surface of the monolith. Using previous fluorescent imaging data (Mehrotra et al., 2010), an illustration of this theory is shown in Figure 7. Based on this theory, we believe the role hydrogel nanoporosity is made clear in that it increases the number of protein binding sites per unit volume. Moreover, the ability to tailor the size, morphology, and number or nanopores per unit volume is key in engineering controlled drug delivery from hydrogels modified by the LbL process.
Figure 7.
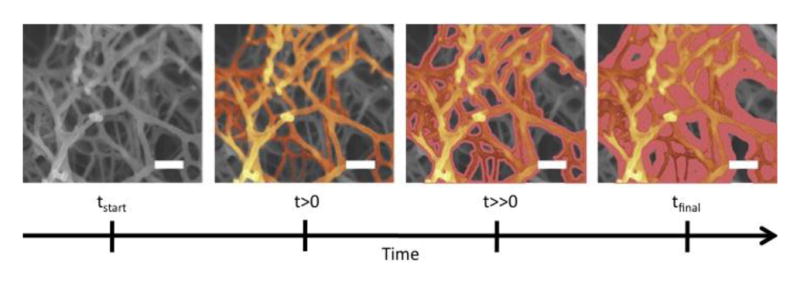
Deposition pattern of LbL. As deposition time increases, polymer adsorption builds from the nanopores into the mesopores and eventually onto the outer surface of the hydrogel. Scalebar is 100nm
5. Conclusions
Functionalizing hydrogels with the layer-by-layer process demonstrates the ability to provide controlled release of proteins in clinically relevant doses over meaningful time scales. In this study, we correlated the effect of increased surface area per unit of hydrogel superficial volume on the cumulative dose response. Specifically, it was found that the addition of sucrose to agarose hydrogels during gelation significantly altered the gel crosslink density, resulting in an increase in internal surface area. The increase in the internal surface area was confirmed by both lysozyme release assays and nitrogen adsorption measurements, and was visualized by SEM. It was determined that the maximum release was observed from the 5wt% agarose with 50wt% sucrose that achieved a total cumulative lysozyme release of 2556 μg/mL; a six-fold increase compared to unmodified 5wt% agarose. Moreover the nine-day release profiles exhibited controlled and relatively uniform dose response. We believe the increased hydrogel crosslink density and scale provided a larger number of protein binding sites per unit volume of gel, which resulted in higher release. To our knowledge, these data are some of the highest dose responses per unit volume of hydrogel reported to date.
Highlights.
Sucrose significantly augments internal surface area of agarose
Supercritical fluid extraction enabled unprecedented agarose pore characterization
Amplified surface area resulted in a substantial increase in dose response
Layer-by-layer technology compliments agarose with increased internal surface area
Acknowledgments
This work was supported by the NIH/NIBIB (R01EB014986) and the Veterans Administration.
Footnotes
Publisher's Disclaimer: This is a PDF file of an unedited manuscript that has been accepted for publication. As a service to our customers we are providing this early version of the manuscript. The manuscript will undergo copyediting, typesetting, and review of the resulting proof before it is published in its final citable form. Please note that during the production process errors may be discovered which could affect the content, and all legal disclaimers that apply to the journal pertain.
References
- Allen TM, Cullis PR. Drug delivery systems: entering the mainstream. Science. 2004;303:1818–1822. doi: 10.1126/science.1095833. [DOI] [PubMed] [Google Scholar]
- Almeida AJA, Souto EE. Solid lipid nanoparticles as a drug delivery system for peptides and proteins. Advanced Drug Delivery Reviews. 2007;59:478–490. doi: 10.1016/j.addr.2007.04.007. [DOI] [PubMed] [Google Scholar]
- Ariga K, Lvov YM, Kawakami K, Ji Q, Hill JP. Layer-by-layer self-assembled shells for drug delivery. Advanced Drug Delivery Reviews. 2011;63:762–771. doi: 10.1016/j.addr.2011.03.016. [DOI] [PubMed] [Google Scholar]
- Aymard PP, Martin DRD, Plucknett KK, Foster TJT, Clark AHA, Norton ITI. Influence of thermal history on the structural and mechanical properties of agarose gels. Biopolymers. 2001;59:131–144. doi: 10.1002/1097-0282(200109)59:3<131::AID-BIP1013>3.0.CO;2-8. [DOI] [PubMed] [Google Scholar]
- Bae Y, Diezi TA, Zhao A, Kwon GS. Mixed polymeric micelles for combination cancer chemotherapy through the concurrent delivery of multiple chemotherapeutic agents. Journal of Controlled Release. 2007;122:324–330. doi: 10.1016/j.jconrel.2007.05.038. [DOI] [PubMed] [Google Scholar]
- Bhattarai N, Gunn J, Zhang M. Chitosan-based hydrogels for controlled, localized drug delivery. Advanced Drug Delivery Reviews. 2010;62:83–99. doi: 10.1016/j.addr.2009.07.019. [DOI] [PubMed] [Google Scholar]
- Blasi PP, Giovagnoli SS, Schoubben AA, Ricci MM, Rossi CC. Solid lipid nanoparticles for targeted brain drug delivery. Advanced Drug Delivery Reviews. 2007;59:454–477. doi: 10.1016/j.addr.2007.04.011. [DOI] [PubMed] [Google Scholar]
- Brewer E, Coleman J, Lowman A. Emerging technologies of polymeric nanoparticles in cancer drug delivery. Journal of Nanomaterials. 2011;2011:1–10. [Google Scholar]
- Bromberg L. Polymeric micelles in oral chemotherapy. Journal of Controlled Release. 2008;128:99–112. doi: 10.1016/j.jconrel.2008.01.018. [DOI] [PubMed] [Google Scholar]
- Burdick JA, Prestwich GD. Hyaluronic Acid Hydrogels for Biomedical Applications. Advanced Materials. 2011;23:H41–H56. doi: 10.1002/adma.201003963. [DOI] [PMC free article] [PubMed] [Google Scholar]
- Chan JMJ, Valencia PMP, Zhang LL, Langer RR, Farokhzad OCO. Polymeric nanoparticles for drug delivery. Methods in Molecular Biology. 2010;624:163–175. doi: 10.1007/978-1-60761-609-2_11. [DOI] [PubMed] [Google Scholar]
- Damgé C, Maincent P, Ubrich N. Oral delivery of insulin associated to polymeric nanoparticles in diabetic rats. Journal of Controlled Release. 2007;117:163–170. doi: 10.1016/j.jconrel.2006.10.023. [DOI] [PubMed] [Google Scholar]
- Fatin-Rouge N, Milon A, Buffle J, Goulet RR, Tessier A. Diffusion and partitioning of solutes in agarose hydrogels: the relative influence of electrostatic and specific interactions. The Journal of Physical Chemistry B. 2003;107:12126–12137. [Google Scholar]
- Ganta S, Devalapally H, Shahiwala A, Amiji M. A review of stimuli-responsive nanocarriers for drug and gene delivery. Journal of Controlled Release. 2008;126:187–204. doi: 10.1016/j.jconrel.2007.12.017. [DOI] [PubMed] [Google Scholar]
- Girifalco LA, Good RJ. A theory for the estimation of surface and interfacial energies. I. Derivation and application to interfacial tension. Journal of Physical Chemistry. 1957;61:904–909. [Google Scholar]
- Good RJ, Girifalco LA. A Theory for Estimation of Interfacial Energies. III. Estimation of Surface Energies of Solids From Contact Angle Data. Journal of Physical Chemistry. 1960;64:561–565. [Google Scholar]
- Good RJ, Girifalco LA, Kraus G. A theory for estimation of interfacial energies. II. Application to surface thermodynamics of teflon and graphite. Journal of Physical Chemistry. 1958;62:1418–1421. [Google Scholar]
- Gupta P, Vermani K, Garg S. Hydrogels: from controlled release to pH-responsive drug delivery. Drug Discovery Today. 2002;7:569–579. doi: 10.1016/s1359-6446(02)02255-9. [DOI] [PubMed] [Google Scholar]
- Gutenwik J, Nilsson B, Axelsson A. Coupled diffusion and adsorption effects for multiple proteins in agarose gel. AIChE journal. 2004;50:3006–3018. [PubMed] [Google Scholar]
- Hamidi M, Azadi A, Rafiei P. Hydrogel nanoparticles in drug delivery. Advanced Drug Delivery Reviews. 2008;60:1638–1649. doi: 10.1016/j.addr.2008.08.002. [DOI] [PubMed] [Google Scholar]
- Hoare TR, Kohane DS. Hydrogels in drug delivery: Progress and challenges. Polymer. 2008;49:1993–2007. [Google Scholar]
- Jagur-Grodzinski J. Polymeric gels and hydrogels for biomedical and pharmaceutical applications. Polymers for Advanced Technologies. 2010;21:27–47. [Google Scholar]
- Jiang XP, Clark SL, Hammond PT. Side-by-side directed multilayer patterning using surface templates. Advanced Materials. 2001;13:1669–1673. [Google Scholar]
- Johnson JE, Barde YA, Schwab M, Thoenen H. Brain-derived neurotrophic factor supports the survival of cultured rat retinal ganglion cells. Journal of Neuroscience. 1986;6:3031–3038. doi: 10.1523/JNEUROSCI.06-10-03031.1986. [DOI] [PMC free article] [PubMed] [Google Scholar]
- Kaur IP, Bhandari R, Bhandari S, Kakkar V. Potential of solid lipid nanoparticles in brain targeting. Journal of Controlled Release. 2008;127:97–109. doi: 10.1016/j.jconrel.2007.12.018. [DOI] [PubMed] [Google Scholar]
- Kharlampieva E, Kozlovskaya V, Sukhishvili SA. Layer-by-Layer Hydrogen-Bonded Polymer Films: From Fundamentals to Applications. Advanced Materials. 2009;21:3053–3065. [Google Scholar]
- Klouda L, Mikos AG. Thermoresponsive hydrogels in biomedical applications. European Journal of Pharmaceutics and Biopharmaceutics. 2008;68:34–45. doi: 10.1016/j.ejpb.2007.02.025. [DOI] [PMC free article] [PubMed] [Google Scholar]
- Kumari A, Yadav SK, Yadav SC. Biodegradable polymeric nanoparticles based drug delivery systems. Colloids and Surfaces B: Biointerfaces. 2010;75:1–18. doi: 10.1016/j.colsurfb.2009.09.001. [DOI] [PubMed] [Google Scholar]
- Kurisawa M, Lee F, Wang LS, Chung JE. Injectable enzymatically crosslinked hydrogel system with independent tuning of mechanical strength and gelation rate for drug delivery and tissue engineering. Journal of Materials Chemistry. 2010;20:5371–5375. [Google Scholar]
- Liang S, Xu J, Weng L, Dai H, Zhang X, Zhang L. Protein diffusion in agarose hydrogel in situ measured by improved refractive index method. Journal of Controlled Release. 2006;115:189–196. doi: 10.1016/j.jconrel.2006.08.006. [DOI] [PubMed] [Google Scholar]
- Lynam D, Bednark B, Peterson C, Welker D, Gao M, Sakamoto JS. Precision microchannel scaffolds for central and peripheral nervous system repair. Journal Of Materials Science-Materials In Medicine. 2011;22:2119–2130. doi: 10.1007/s10856-011-4387-3. [DOI] [PubMed] [Google Scholar]
- Maaloum M, Pernodet N, Tinland B. Agarose gel structure using atomic force microscopy: gel concentration and ionic strength effects. Electrophoresis. 1998;19:1606–1610. doi: 10.1002/elps.1150191015. [DOI] [PubMed] [Google Scholar]
- Maeda H. SMANCS and polymer-conjugated macromolecular drugs: advantages in cancer chemotherapy. Advanced Drug Delivery Reviews. 2001;46:169–185. doi: 10.1016/s0169-409x(00)00134-4. [DOI] [PubMed] [Google Scholar]
- Mehrotra S, Lynam D, Liu C, Shahriari D, Lee I, Tuszynski M, et al. Time Controlled Release of Arabinofuranosylcytosine (Ara-C) from Agarose Hydrogels using Layer-by-Layer Assembly: An In Vitro Study. Journal of Biomaterials Science-Polymer Edition. 2012;23:439–463. doi: 10.1163/092050610X552221. [DOI] [PMC free article] [PubMed] [Google Scholar]
- Mehrotra S, Lynam D, Maloney R, Pawelec KM, Tuszynski MH, Lee I, et al. Time Controlled Protein Release from Layer-by-Layer Assembled Multilayer Functionalized Agarose Hydrogels. Advanced Functional Materials. 2010;20:247–258. doi: 10.1002/adfm.200901172. [DOI] [PMC free article] [PubMed] [Google Scholar]
- Mishra B, Patel BB, Tiwari S. Colloidal nanocarriers: a review on formulation technology, types and applications toward targeted drug delivery. Nanomedicine: Nanotechnology, Biology and Medicine. 2010;6:9–24. doi: 10.1016/j.nano.2009.04.008. [DOI] [PubMed] [Google Scholar]
- Miyoshi E. Rheological and thermal studies of gel-sol transition in gellan gum aqueous solutions. Carbohydrate Polymers. 1996;30:109–119. [Google Scholar]
- Nakayama MM, Okano TT, Miyazaki TT, Kohori FF, Sakai KK, Yokoyama MM. Molecular design of biodegradable polymeric micelles for temperature-responsive drug release. Journal of Controlled Release. 2006;115:46–56. doi: 10.1016/j.jconrel.2006.07.007. [DOI] [PubMed] [Google Scholar]
- Nishinari K, Watase M, Kohyama K, Nishinari N, Oakenfull D, Koide S, et al. The effect of sucrose on the thermo-reversible gel-sol transition in agarose and gelatin. Polymer Journal. 1992;24:871–871. [Google Scholar]
- Normand V. Effect of sucrose on agarose gels mechanical behaviour. Carbohydrate Polymers. 2003;54:83–95. [Google Scholar]
- Reddy PD, Swarnalatha D. Recent advances in novel drug delivery systems. International Journal of PharmTech Research. 2010;2:2025–2027. [Google Scholar]
- Samad A, Sultana Y, Aqil M. Liposomal drug delivery systems: an update review. Current Drug Delivery. 2007;4:297–305. doi: 10.2174/156720107782151269. [DOI] [PubMed] [Google Scholar]
- Shiratori S, Rubner M. pH-dependent thickness behavior of sequentially adsorbed layers of weak polyelectrolytes. Macromolecules. 2000;33:4213–4219. [Google Scholar]
- Soppimath KS, Aminabhavi TM, Kulkarni AR, Rudzinski WE. Biodegradable polymeric nanoparticles as drug delivery devices. Journal of Controlled Release. 2001;70:1–20. doi: 10.1016/s0168-3659(00)00339-4. [DOI] [PubMed] [Google Scholar]
- Stockton WB, Rubner MF. Molecular-level processing of conjugated polymers. 4. Layer-by-layer manipulation of polyaniline via hydrogen-bonding interactions. Macromolecules. 1997;30:2717–2725. [Google Scholar]
- Stokols S, Sakamoto J, Breckon C, Holt T, Weiss J, Tuszynski M. Templated agarose scaffolds support linear axonal regeneration. Tissue Engineering. 2006;12:2777–2787. doi: 10.1089/ten.2006.12.2777. [DOI] [PubMed] [Google Scholar]
- Sukhishvili S, Granick S. Layered, erasable polymer multilayers formed by hydrogen-bonded sequential self-assembly. Macromolecules. 2002;35:301–310. [Google Scholar]
- Teo AL, Shearwood C, Ng KC, Lu J, Moochhala S. Transdermal microneedles for drug delivery applications. Materials Science and Engineering: B. 2006;132:151–154. [Google Scholar]
- Tsoga A, Kasapis S, Richardson RK. The rubber-to-glass transition in high sugar agarose systems. Biopolymers. 1999;49:267–275. [Google Scholar]
- Van Tomme SR, Storm G, Hennink WE. In situ gelling hydrogels for pharmaceutical and biomedical applications. International Journal of Pharmaceutics. 2008;355:1–18. doi: 10.1016/j.ijpharm.2008.01.057. [DOI] [PubMed] [Google Scholar]
- Wang ChauHui, Wang CH, Hsiue GH. Polymeric micelles with a pH-responsive structure as intracellular drug carriers. Journal of Controlled Release. 2005;108:140–149. doi: 10.1016/j.jconrel.2005.07.017. [DOI] [PubMed] [Google Scholar]
- Wang J, Wang Z, Gao J, Wang L, Yang Z, Kong D, Yang Z. Incorporation of supramolecular hydrogels into agarose hydrogels—a potential drug delivery carrier. Journal of Materials Chemistry. 2009;19:7892–7896. [Google Scholar]
- Wang Nuo, Wu XS. A novel approach to stabilization of protein drugs in poly(lactic-co-glycolic acid) microspheres using agarose hydrogel. International Journal of Pharmaceutics. 1998;166:1–14. [Google Scholar]
- Watase M, Nishinari K, Williams PA, Phillips GO. Agarose gels: effect of sucrose, glucose, urea, and guanidine hydrochloride on the rheological and thermal properties. Journal of Agricultural and Food Chemistry. 1990;38:1181–1187. [Google Scholar]
- Xiong JY, Narayanan J, Liu XY, Chong TK, Chen SB, Chung TS. Topology evolution and gelation mechanism of agarose gel. The Journal of Physical Chemistry B. 2005;109:5638–5643. doi: 10.1021/jp044473u. [DOI] [PubMed] [Google Scholar]
- Zhuk A, Pavlukhina S, Sukhishvili SA. Hydrogen-Bonded Layer-by-Layer Temperature-Triggered Release Films. Langmuir. 2009;25:14025–14029. doi: 10.1021/la901478v. [DOI] [PubMed] [Google Scholar]


