

Significance
In eukaryotic cells, up to 90% of genomic DNA is occluded by nucleosomes, fundamental units of chromatin in which DNA is tightly bent around the surface of a histone octamer. We present evidence that many nucleosomes in a single-cell eukaryote, Saccharomyces cerevisiae, are wrapped only partially, allowing them to invade genomic territories of their neighbors. These findings significantly extend the canonical view of nucleosomes as separate “beads on a string” and raise the question of how cellular functions are carried out in this crowded environment.
Keywords: partially unwrapped nucleosomes, DNA accessibility, gene regulation
Abstract
Nucleosomes may undergo a conformational change in which a stretch of DNA peels off the histone octamer surface as a result of thermal fluctuations or interactions with chromatin remodelers. Thus, neighboring nucleosomes may invade each other’s territories by DNA unwrapping and translocation, or through initial assembly in partially wrapped states. A recent high-resolution map of distances between dyads of neighboring nucleosomes in Saccharomyces cerevisiae reveals that nucleosomes frequently overlap DNA territories of their neighbors. This conclusion is supported by lower-resolution maps of S. cerevisiae nucleosome lengths based on micrococcal nuclease digestion and paired-end sequencing. The average length of wrapped DNA follows a stereotypical pattern in genes and promoters, correlated with the well-known distribution of nucleosome occupancy: nucleosomal DNA tends to be shorter in promoters and longer in coding regions. To explain these observations, we have developed a biophysical model that uses a 10–11-bp periodic histone–DNA binding energy profile. The profile is based on the pattern of histone–DNA contacts in nucleosome crystal structures, as well as the idea of linker length discretization caused by higher-order chromatin structure. Our model is in agreement with the observed genome-wide distributions of interdyad distances, wrapped DNA lengths, and nucleosome occupancies. Furthermore, our approach explains in vitro measurements of the accessibility of nucleosome-covered target sites and nucleosome-induced cooperativity between DNA-binding factors. We rule out several alternative scenarios of histone–DNA interactions as inconsistent with the genomic data.
Eukaryotic genomes are organized into arrays of nucleosomes (1). Each nucleosome consists of a stretch of genomic DNA wrapped around a histone octamer core (2). The resulting complex of DNA with histones and other regulatory and structural proteins is called chromatin (1). Arrays of nucleosomes form 10-nm fibers that resemble beads on a string and, in turn, fold into higher-order structures (3). Depending on the organism and cell type, 75–90% of genomic DNA is packaged into nucleosomes (1). Because nucleosomal DNA is wrapped tightly around the histone octamer, its accessibility to various DNA-binding proteins, such as repair enzymes, transcription factors (TFs), polymerases, and recombinases, is suppressed. The question of how cellular functions are carried out on the chromatin template is one of the outstanding puzzles in eukaryotic biology.
Recently, nucleosome dyad positions and distances between dyads of neighboring nucleosomes were mapped genome-wide with high precision in Saccharomyces cerevisiae (4). The in vivo map was obtained by chemical modification of engineered histones, DNA backbone cleavage by hydroxyl radicals, and high-throughput sequencing (Fig. 1A). Although more precise than methods based on micrococcal nuclease (MNase) digestion, whose accuracy is affected by MNase sequence preferences and the possibility of DNA over- or underdigestion (5, 6), the map is subject to unknown hydroxyl radical cutting preferences for two alternate sites on each DNA strand, at −1 bp and +6 bp with respect to the dyad (4, 7). Thus, distances between neighboring dyads are only approximately equal to measured distances between hydroxyl cut sites.
Fig. 1.

Genome-wide distribution of distances between hydroxyl cut sites marking neighboring nucleosomes. (A) Overview of the chemical method for mapping nucleosome dyad positions and interdyad distances (4, 23). Mutant H4 histones (S47C) were modified by covalent attachment of a sulfhydryl-reactive, copper-chelating label to the cysteines. With the addition of copper and hydrogen peroxide, a localized cloud of hydroxyl radicals was produced that specifically cleaved the DNA backbone at sites symmetrically flanking nucleosome dyads. The cleavage products that correspond to DNA fragments linking neighboring nucleosomes were size-selected on an agarose gel, purified, sequenced using paired-end reads, and mapped to the S. cerevisiae genome. Note that the size-selection step likely causes depletion of very short and very long fragments from the sample. Each mapped pair of reads yields a measurement (biased by hydroxyl cleavage preferences) of the distance between dyads of neighboring nucleosomes positioned on the same chromosome. In the dinucleosome conformation shown, the interdyad distance is 100 bp (dyads are marked by red dots). Starting from the top dyad, 40 bp of DNA are wrapped around the histone octamer, followed by a 30-bp linker (green) and by 30 bp of DNA wrapped around the other octamer. (B) Histone–DNA binding/higher-order structure energy profile. The energy of a DNA segment  bp in length positioned symmetrically with respect to the dyad is given by
  . The minima and maxima of the energy landscape are based on a crystal structure of the nucleosome core particle (9, 10). Dark gray bars show where the histone binding motifs interact with the DNA minor groove in the structure. Light gray bars show where the DNA major groove faces the histones. The energy profile was obtained by a polynomial fit (SI Appendix, Model A). (C) Normalized histogram of DNA fragment lengths from the high-resolution chemical map described in A (4) (blue) and from the models with partially (red) and fully (gray) wrapped DNA. In the latter,
  . RMS, total root-mean-square deviation between the model and the data. (D) Oscillations in the observed (blue) and predicted (red) distributions of DNA fragment lengths, obtained by subtracting a smooth background from the data and the model with partially wrapped DNA in C. The smooth background was found by applying a Savitzky–Golay filter of polynomial order 3 with 31-bp length. Correlation refers to rosc, the linear correlation coefficient between measured and predicted oscillations.
Surprisingly, 38.7% of the distances between hydroxyl cleavage sites marking neighboring nucleosomes are less than 147 bp, indicating that nucleosomes frequently invade each other’s territories (8). This is possible only if the DNA of at least one nucleosome in the pair is partially unwrapped (Fig. 1A). Furthermore, there are distinct 10–11-bp periodic oscillations in the histogram of DNA fragment lengths, consistent with the pattern of histone–DNA contacts in nucleosome crystal structures (2, 9, 10). The observed nucleosome crowding may be the result of fully wrapped nucleosomes being transiently unwrapped and translocated, or disassembled and reassembled, by thermal fluctuations and chromatin remodeling enzymes. Alternatively, chromatin initially may have been assembled with many nucleosomes in partially wrapped states.
We present a statistical mechanics framework that is in agreement with the observed crowding of genomic nucleosomes (4), as well as earlier experiments that probed differential accessibility of nucleosome-covered binding sites (11–14), and studied nucleosome-induced cooperativity between DNA-binding factors (15–17). Our model attributes short interdyad distances seen in the experiment to intrinsic energetics of histone–DNA interactions. It significantly extends previous work (18–21) by considering sequence-dependent formation of partially wrapped nucleosome arrays and by proposing a histone–DNA binding energy profile based on nucleosome crystal structures. Using our approach, we reproduce nucleosome occupancies and average lengths of wrapped DNA in the vicinity of transcription start sites (TSSs). We also predict sequence-specific free energies of nucleosome formation in the presence of nucleosome crowding, using paired-end high-throughput nucleosome maps based on MNase digestion as input.
Results
Histone–DNA Binding Energy.
We model energetics of histone–DNA interactions by representing the total free energy  of a nucleosome with the DNA sequence
  of length N as a sum of a sequence-independent term
  and a sequence-dependent correction
  (SI Appendix). The sequence-independent term describes favorable interactions between histone side chains and the DNA phosphate backbone, as well as a free energy cost of bending DNA into the nucleosomal superhelix averaged over all sequences of length N in the genome. The sequence-dependent term represents deviation from this average due to the effects of a particular sequence
  (22).
(22).
We introduce a simple model for  , based on the 10–11-bp periodic pattern of histone contacts with the minor groove of the nucleosomal DNA (9, 10) (Fig. 1B and SI Appendix, Model A). As DNA is peeled off each contact patch, its free energy increases because hydrogen bonds and favorable electrostatic contacts between histone side chains and the DNA phosphate backbone are lost. However, once DNA breaks free from the contact patch, it may adopt multiple conformations, which allows it to increase its entropy and thus lower its total free energy. The favorable entropic term grows until the next contact patch is reached, completing one cycle in the oscillatory energy profile. The oscillations are superimposed on a straight line whose slope equals the average free energy lost when a DNA base pair is detached from the histone octamer surface.
We predict the distribution of interdyad distances using the sequence-independent model described above. We compute the conditional probability  of finding a nucleosome dyad at base pair
  , given that the previous dyad is at base pair c (SI Appendix). Because interdyad distances cannot be used to distinguish whether nucleosomal DNA is wrapped symmetrically or asymmetrically with respect to the dyad, we assume the former for simplicity. The model is fit to the observed distribution of distances between hydroxyl cut sites (SI Appendix). The free parameters of the model include the amplitude of the oscillations, the slope of the free energy profile, and
  , the minimum (maximum) effective length of the nucleosome particle (SI Appendix, Model A). The minimum length of wrapped DNA is controlled by
  , whereas
  is allowed to exceed
  to account for the effects of higher-order chromatin structure and linker histone deposition. We also fit the chemical potential of histone octamers and the relative frequency f of DNA cleavage by hydroxyl radicals at
  with respect to the dyad (SI Appendix). We obtain
  , which implies that after averaging over hydroxyl cleavage preferences, interdyad distances are predicted to be 5 bp longer than the distances between hydroxyl cleavage sites marking neighboring nucleosomes (SI Appendix). With this correction, 25.8% of all interdyad distances are less than 147 bp. Our model reproduces both the overall shape and the fine oscillatory structure of the observed histogram of DNA fragment lengths (Fig. 1 C and D). In contrast, a model in which nucleosomes are always fully wrapped cannot fit the data (gray line in Fig. 1C).
Higher-Order Chromatin Structure and Linker Histone Energetics.
The effective length of the particle found in the fit,  , is greater than 147 bp, the length of the DNA in the nucleosome core (10). Indeed,
  is incompatible with the observed histogram of DNA fragment lengths (Fig. S3 A and B). The model is less sensitive to the value of
  , because such short lengths of wrapped DNA are energetically unfavorable and therefore are not seen frequently in the data. The overall shape of the distribution is strongly affected by the slope of the energy profile in Fig. 1B (Fig. S3C). The fitted value of the slope yields
  (where kB is the Boltzmann constant, and T is the room temperature) for the average energy of a fully wrapped nucleosome.
Because  is greater than 147 bp, the energy profile in Fig. 1B describes both DNA attachment to the histone octamer (up to 73 bp from the dyad) and the effects of higher-order chromatin structure, including binding of Hho1p, the H1 linker histone of S. cerevisiae (24–26), or histone tails (27) to the DNA immediately outside the nucleosome core. Although Hho1p is less abundant in yeast than in higher eukaryotes, it is involved in higher-order chromatin organization, including chromatin compaction in stationary phase (26, 28). Relatively little is known about the molecular mechanism of H1 binding, including the length and symmetry of its DNA footprint (24, 25). H1 binding and other factors that mediate chromatin folding into higher-order structures cause linker lengths to be discretized (1, 29). Linker length discretization may be described by a periodic decaying two-body effective potential between neighboring nucleosomes, with the first minimum ∼5 bp away from the nucleosome edge (1, 30, 31).
Based on these observations, we have constructed two models for the energy profile outside the nucleosome core region. The first model is a polynomial fit that extends the quasiperiodic profile of the histone–DNA binding energy through another cycle (Fig. 1B and SI Appendix, Model A). The depth and position of the first minimum outside the nucleosome core are additional free parameters. As may be seen in Fig. S4, our fit robustly predicts the first minimum to be positioned 5–6 bp outside the nucleosome core, in agreement with previous studies (1, 30, 31). The depth of this minimum is comparable to the depth of the other minima (Fig. S4 and SI Appendix, Model A).
The second model represents the energy profile outside the nucleosome core by a linear function (Fig. S5A and SI Appendix, Model B). The two free parameters are the slope and the range of the linear function, which are related to the H1–DNA interaction energy and the H1 footprint, respectively. This alternative scenario, although likely oversimplified, may be used to check the sensitivity of our results toward a particular energy profile outside the core region. We find that the linear profile fits the overall shape of the distribution of DNA fragment lengths less well than the oscillatory one (compare rms values in Fig. 1C and Fig. S5B), although the 10–11-bp periodic fine structure is reproduced in both cases (Fig. 1D and Fig. S5C). The optimal linear profile is 7 bp long, yielding a symmetric H1 footprint with two 7-bp half-sites (Fig. S5D) and the H1–DNA interaction energy of  (Fig. S5E).
Alternative Models of Histone–DNA Interactions.
Next, we tested the sensitivity of our fits to the functional form of the histone–DNA binding energy. Although our primary model follows nucleosome crystal structures in creating a quasiperiodic energy profile with both 10- and 11-bp modes, strictly periodic 10- or 11-bp sinusoidal profiles yield nearly the same quality of the fit (Fig. S6 and SI Appendix, Models C and D). Because the initial phase of the oscillations is not determined by the crystal structure, it becomes another fitting parameter. The fitted initial phases in the 10- and 11-bp models make the periodic curves match the crystal structure further away from the dyad (Fig. S6A). The phases diverge closer to the dyad, where they are not as strongly constrained by the data. Rms deviation is less sensitive to the initial phase than rosc, the linear correlation between predicted and observed oscillations in the histograms of DNA fragment lengths (Fig. S7).
Because the distribution of distances between hydroxyl cut sites has a prominent oscillatory component, it is not surprising that a linear model, in which histone–DNA binding energy per base pair is constant, does not fit the data equally well, although it does match its overall shape (Fig. S8A and SI Appendix, Model E). Less trivially, it was suggested on the basis of single-nucleosome unzipping experiments that nucleosome unwrapping proceeds with 5-bp periodicity because histones interact with each DNA strand separately where the DNA minor groove faces the histone octamer surface, creating two distinct contact “subpatches” (32). These single-molecule data were fit to a model with a stepwise free energy profile (33). Each step in the profile corresponds to breaking a point histone–DNA contact, and the steps occur every 5.25 bp on average. We do not find any evidence of 5-bp periodicity of histone–DNA interactions in the genomic data. Indeed, both 5-bp stepwise and 5-bp periodic sinusoidal profiles fit the data poorly, about as well as the linear model (Fig. S8 B and C and SI Appendix, Models F and G). Even the 10-bp stepwise energy profile, although clearly having the right periodicity, does not fit the data as well as the structure-based model (Fig. S8D and SI Appendix, Model H). These observations suggest that the picture of a gradual loss of favorable finite-range histone–DNA interactions followed by gain in DNA conformational entropy is closer to reality than abrupt disruption of short-range histone–DNA contacts. A direct comparison of single-molecule and genome-wide energy profiles unfortunately is obscured by the fact that the reported single-nucleosome unzipping experiments are specific to the 601-nucleosome–forming sequence (34), in contrast to our methodology, which provides the average, sequence-independent picture of histone–DNA energetics.
Extensive Crowding of Genomic Nucleosomes.
Fig. 2A, in which genes are sorted by the intergenic length and aligned by the TSS, shows a canonical picture of nucleosomes depleted in promoters and well-positioned over coding regions (38). Interestingly, interdyad distances tend to be shorter in promoters (Fig. 2B). When averaged over all genes, the number of dyads at a given base pair and the average interdyad distance at that base pair are strongly correlated with each other (compare blue and red lines in Fig. 2C) and with the distribution of wrapped DNA lengths in an MNase-based assay, which mapped both nucleosomes and subnucleosome-size particles by paired-end sequencing (Fig. S9A and green line in Fig. 2C) (35). The observed behavior is the opposite of the initial expectation that nucleosome crowding should increase with occupancy but can be reproduced in a simple sequence-independent model in which nucleosomes phase off a potential barrier placed in the promoter region (Fig. S10) (39).
Fig. 2.

Nucleosome crowding in the vicinity of transcription start sites. (A) Distribution of nucleosome dyad counts (4) near the TSS. Dyads are marked by the positions of hydroxyl cut sites. Four thousand seven hundred and sixty-three verified S. cerevisiae ORFs were aligned by their TSS and sorted by upstream intergenic lengths. Each horizontal line corresponds to one ORF. (B) Distribution of average distances between hydroxyl cut sites marking neighboring nucleosomes. ORFs are sorted as in A. In A and B, values at base pairs without mapped cut sites are obtained by interpolation, and heat maps are smoothed using a 2D Gaussian kernel with  pixels. (C) Data in A, B, and Fig. S9 A–C averaged over all genes. Blue, nucleosome dyad counts; red, average distance between hydroxyl cut sites marking neighboring dyads; green, average length of DNA-bound particles mapped by MNase digestion (35) (see Fig. S9A for details). Curve with light gray background, combined occupancy of nine PICs (TATA-binding protein, TFIIA, TFIIB, TFIID, TFIIE, TFIIF, TFIIH, TFIIK, RNA polymerase II) (36); curve with light pink background, average histone turnover rate (37). The peaks in the dyad count profile (blue) are marked with orange ovals representing nucleosomes, and peak-to-peak distances are shown.
Crowded nucleosomes tend to have elevated histone turnover rates (37), both around TSSs and genome-wide (Fig. 2C and Fig. S9 B and D). Nucleosomes at loci enriched in transcription preinitiation complexes (PICs) (36) also are more crowded (Fig. 2C and Fig. S9C). Finally, interdyad distances tend to increase with the fraction of adenine/thymine (A/T) nucleotides (Fig. S9E). We note that it is misleading to equate internucleosome distances with peak-to-peak distances in the average profile of nucleosome dyad counts (blue line in Fig. 2C). The peak-to-peak distances are 164–165 bp, whereas the average distance between hydroxyl cut sites for the nucleosomes in the [TSS, TSS + 1,000] region is 149.6 bp (i.e., the average interdyad distance is 154.6 bp). Nucleosome crowding is prominent in many types of genomic functional regions (Fig. S11). Thus, nucleosome crowding and partial overlap of nucleosomal territories are more common than could be predicted by mapping single-nucleosome positions alone.
Accessibility of Nucleosomal DNA to Factor Binding.
Partial unwrapping of nucleosomal DNA results in differential accessibility of factor binding sites with respect to their position inside the nucleosome: sites on the edges are more accessible than those closer to the dyad. In contrast, all-or-none nucleosome formation should not be sensitive to the binding site position—a nucleosome, once unfolded, liberates its entire DNA sequence. Polach and Widom (11) studied the differential accessibility of six restriction enzymes to their target sites. The sites were placed at various locations throughout the 5S rRNA nucleosome positioning sequence (Fig. 3A). A later study used the 601 sequence and an extended set of 11 restriction enzymes (Fig. 3B) (12). These studies measured equilibrium constants for site exposure,  , which are related to the probability that a site will be accessible for binding:
  (20).
(20).
Fig. 3.

Probability of binding site exposure within a nucleosome. The solid blue and dashed green lines represent model predictions with and without DNA unwrapping, respectively. In the latter case,  bp and all other parameters are as in the model with unwrapping. The dyad is fixed at base pair 74. (A) Restriction enzyme sites inserted into the 5S rRNA sequence at locations indicated by the centers of vertical red bars (11). (B) Restriction enzyme sites inserted into the 601 sequence at locations indicated by the centers of vertical red bars in the middle of each group (12). Each group of three bars corresponds to independent measurements in which the 601 sequence was flanked by different DNA sequences. In A and B, the height of each bar is the equilibrium constant for site exposure averaged over multiple experiments (error bars show standard deviations).
We use our crystal structure-based model of histone–DNA energetics (Fig. 1B and SI Appendix, Model A) to fit the data on site accessibility (11, 12). Here, the system consists of a single nucleosome, and asymmetric unwrapping of its DNA tails is allowed (i.e., wrapped DNA does not have to be centered around the dyad). We assume that a site becomes accessible for the enzyme only after an additional number of base pairs, d, have been unwrapped from the histone octamer surface (20). We also assume that once the dyad is unwrapped from either end, the entire nucleosome unfolds. Then the probability that a binding site is accessible is given by
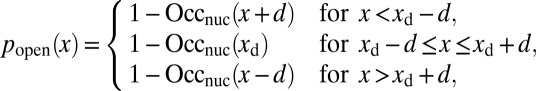 |
where  ,
,  is the position of the dyad, and the nucleosome occupancy is computed using Eq. 3.
Besides d, the fitting parameters of the model are the overall slope of the binding energy, ε, and the histone chemical potential, μ (all other parameters are as in SI Appendix, Model A, except for  ). For the 5S rRNA measurements (11), we obtain
  ,
,  , and
, and  . For the 601 measurements (12),
  ,
,  , and
, and  . As expected, the nucleosome formation energy of the 601 sequence is
  more favorable than that of the 5S sequence, in agreement with the experimentally measured difference of
  (40). The nucleosome formation energy of the 601 sequence is
  , close to the
  estimate made on the basis of 601 unzipping experiments (33). Interestingly, the 601 DNA has to unwrap more extensively past the binding site to allow access to restriction enzymes.
Overall, our model reproduces the observed differential accessibility of restriction enzyme binding sites with respect to the nucleosome dyad (Fig. 3). The only outliers are StyI and BfaI sites in the 601 series, which were not used in the fit. Because DNA unwrapping proceeds from nucleosome edges, these sites cannot be made more accessible than the PmlI site, which is located closer to the edge. It is possible that StyI and BfaI require less extensive unwrapping past their sites (smaller d) or have some affinity for nucleosome-wrapped DNA.
Nucleosome-Induced Cooperativity.
If multiple binding sites reside within a single nucleosome, binding of one factor makes the other sites more accessible. This phenomenon is known as nucleosome-induced cooperativity (15, 16, 18). The cooperativity disappears in the absence of nucleosomes and reduces in extent with the distance between consecutive binding sites (15). Moreover, the cooperativity is not observed if the two sites are on the opposite sides of the nucleosome dyad (17).
We can use our model of histone–DNA energetics (SI Appendix, Model A with  ) to capture all these aspects of nucleosome-induced cooperativity in a single-nucleosome model (Fig. 4). Specifically, for sites located more than
  away from the dyad site, accessibility is strongly enhanced if DNA unwrapping is allowed (Fig. 4A). Interestingly, cooperativity between two TFs bound on the same side of the dyad is observed both with and without unwrapping (Fig. 4B). However, without unwrapping, it is impossible to show that binding on the opposite sides of the dyad is not cooperative, as observed in experiments (17) (Fig. 4C). Furthermore, the decrease of cooperativity with distance (15) cannot be reproduced (Fig. 4D). Thus, modeling partially wrapped nucleosomes is necessary for understanding how TFs and other DNA-binding proteins gain access to their nucleosome-covered sites.
Fig. 4.

Nucleosome-induced cooperativity between DNA-binding factors. (A) TF and nucleosome occupancy with and without unwrapping. The TF binding site occupies base pairs 11–20. (Inset) TF binding probability as a function of the distance between the nucleosome dyad and the proximal edge of the TF site, with and without unwrapping. (B) TF titration curves for one TF site vs. two TF sites located on the same side of the dyad. Site 1 occupies base pairs 11–20, site 2 occupies base pairs 31–40. (Inset) Binding site locations. (C) Same as B, but with the two TF binding sites located on the opposite sides of the dyad. Site 1 occupies base pairs 11–20, site 2 occupies base pairs 117–126. (Inset) Binding site locations. (D) Nucleosome-induced cooperativity as a function of the distance between two TF binding sites. The binding probability of the second TF is shown. Site 1 occupies base pairs 11–20, whereas the position of the second site is variable. (Inset) Definition of the distance between the two binding sites. In all panels, free energy of a fully wrapped nucleosome is  , histone chemical potential is
  , and
, and  to all other sites. TF chemical potential is
  unless varied (19). Asymmetric unwrapping is allowed; in the model without unwrapping,
  , and all other parameters are as in the model with unwrapping.
Sequence Dependence of Nucleosome Energetics.
We now focus on the sequence-dependent correction to the average free energy of nucleosome formation,  . We assume that
  depends only on the number of mono- and dinucleotides in the nucleosomal DNA (41, 42) (SI Appendix). We consider three in vivo nucleosome maps in S. cerevisiae based on paired-end sequencing (35, 43, 44) and one in vitro map in which nucleosomes were assembled on yeast genomic DNA and sequenced using single-end reads (45). In the latter case, we assume that all nucleosomes have a canonical length of 147 bp. All four maps used MNase digestion to isolate mononucleosomes. We compute the total free energy of nucleosome formation
  using Eq. 4 and fit the sequence-dependent model to
  , with the sequence-independent contribution
  obtained previously (Fig. 1B and SI Appendix, Model A). This procedure was adopted because resolution of MNase-based nucleosome maps is insufficient for predicting
  . The resulting energy parameters are listed in Table S9.
The number of partially wrapped nucleosome species may be as high as several thousand, depending on the minimum length of the DNA segment attached to the histones and the symmetry of its position with respect to the dyad. Because available read coverage levels (total number of reads divided by the genome length) are relatively low (Table S9), it is possible that robust predictions of  and
and  cannot be carried out using current datasets. To address this concern in the absence of high-resolution, high-coverage experimental data, we have tested our ability to predict nucleosome positioning and energetics by using a realistic model system (Fig. S12). We find that we can infer
  even at a coverage of 1 read per base pair (Fig. S12 A and B). Nucleosome occupancies and dyad positions are reproduced reasonably well starting with 10 reads per base pair, but at least 100 reads per base pair are required to recover the energy parameters (Fig. S12C).
Discussion and Conclusions
Recent MNase-based maps of nucleosome positions in yeast that use paired-end sequencing have identified numerous subnucleosome-size particles (35, 43, 44). However, shorter particles may not correspond to nucleosomes, and some DNA fragments may have been overdigested by MNase. These challenges were overcome in an experiment in which hydroxyl radicals were used to map nucleosome dyads in S. cerevisiae (4, 23). Used in conjunction with paired-end sequencing, this experiment provided information about both genomic dyad positions and the distances between dyads of neighboring nucleosomes. The histogram of distances between hydroxyl cut sites shows that DNA in many nucleosomes is wrapped only partially (Fig. 1C). Over regulatory and coding regions, the distribution of wrapped DNA lengths oscillates in phase with the nucleosome occupancy profile so that more wrapped nucleosomes also are more stable.
We have developed a statistical mechanics description of nucleosome arrays that allows neighboring nucleosomes to overlap each other’s territories. We have shown that the prominent 10–11-bp periodicity in the distribution of interdyad distances (4) is consistent with a binding energy profile based on the pattern of histone–DNA contacts in nucleosome crystal structures. We could rule out several alternative scenarios, including stepwise and 5-bp periodic binding profiles. Furthermore, predicting the distribution of interdyad lengths required us to account for linker length discretization, commonly thought to be imposed by chromatin fiber formation (29). Our approach reproduces the stereotypical distribution of wrapped DNA lengths in the vicinity of TSSs, if potential barriers are placed at gene promoters. The barriers may be created in vivo by PICs (36) and other DNA-bound factors.
Our model yields estimates of nucleosome formation energies consistent with previous biophysical experiments. It also accounts for single-nucleosome observations, which showed that restriction enzymes and other factors can bind their nucleosome-occluded sites because of transient DNA unwrapping (11, 12, 15, 17). Moreover, nucleosome-covered binding sites closer to the edge of the nucleosome are more accessible to DNA-binding factors, and binding of the first factor enhances binding of subsequent factors on the same side of the dyad. The extent of nucleosome crowding in the yeast genome suggests that partially unwrapped nucleosomes should be considered in all future models of nucleosome positioning and chromatin energetics.
Materials and Methods
Here, we outline the exact theory for T molecular species simultaneously interacting with 1D DNA (details are provided in SI Appendix). The DNA-bound particles are subject to steric exclusion and also may be partially unwrapped. Let 
 denote the binding energy of a particle of type t occupying base pairs k to l. The one-body distribution of such particles is given by
where Z is the grand canonical partition function and  (
( is the inverse temperature,
  is the chemical potential of particles of type s, and
  is the Kronecker symbol). If the DNA length is L, vectors
  are TL-dimensional with 1 at position
  and 0 everywhere else. Similarly, the nearest-neighbor two-body distribution is given by
where  is the Heaviside step function.
  and
and  are partial partition functions for the DNA segments [1,k) and (k,L], respectively.
  ,
,  , and Z can be computed recursively (SI Appendix). Using Eq. 1, the particle occupancy is
 |
where 
 is the minimum (maximum) length of DNA wrapped around a particle of type t.
The inverse problem of predicting DNA binding energies from one-particle distributions can also be solved. We obtain
where  are found recursively using only the one-particle distribution
  as input (SI Appendix).
Supplementary Material
Acknowledgments
We thank Leonid Mirny for insightful discussions. This research was supported by the National Institutes of Health (R01 HG004708 to A.V.M.). A.V.M. is an Alfred P. Sloan Research Fellow.
Footnotes
The authors declare no conflict of interest.
This article is a PNAS Direct Submission.
This article contains supporting information online at www.pnas.org/lookup/suppl/doi:10.1073/pnas.1321001111/-/DCSupplemental.
References
- 1.van Holde KE. Chromatin. New York: Springer; 1989. [Google Scholar]
- 2.Luger K, Mäder AW, Richmond RK, Sargent DF, Richmond TJ. Crystal structure of the nucleosome core particle at 2.8 Å resolution. Nature. 1997;389(6648):251–260. doi: 10.1038/38444. [DOI] [PubMed] [Google Scholar]
- 3.Felsenfeld G, Groudine M. Controlling the double helix. Nature. 2003;421(6921):448–453. doi: 10.1038/nature01411. [DOI] [PubMed] [Google Scholar]
- 4.Brogaard K, Xi L, Wang JP, Widom J. A map of nucleosome positions in yeast at base-pair resolution. Nature. 2012;486(7404):496–501. doi: 10.1038/nature11142. [DOI] [PMC free article] [PubMed] [Google Scholar]
- 5.Dingwall C, Lomonossoff GP, Laskey RA. High sequence specificity of micrococcal nuclease. Nucleic Acids Res. 1981;9(12):2659–2673. doi: 10.1093/nar/9.12.2659. [DOI] [PMC free article] [PubMed] [Google Scholar]
- 6.Chung HR, et al. The effect of micrococcal nuclease digestion on nucleosome positioning data. PLoS One. 2010;5(12):e15754. doi: 10.1371/journal.pone.0015754. [DOI] [PMC free article] [PubMed] [Google Scholar]
- 7.Flaus A, Luger K, Tan S, Richmond TJ. Mapping nucleosome position at single base-pair resolution by using site-directed hydroxyl radicals. Proc Natl Acad Sci USA. 1996;93(4):1370–1375. doi: 10.1073/pnas.93.4.1370. [DOI] [PMC free article] [PubMed] [Google Scholar]
- 8.Engeholm M, et al. Nucleosomes can invade DNA territories occupied by their neighbors. Nat Struct Mol Biol. 2009;16(2):151–158. doi: 10.1038/nsmb.1551. [DOI] [PMC free article] [PubMed] [Google Scholar]
- 9.Davey CA, Sargent DF, Luger K, Maeder AW, Richmond TJ. Solvent mediated interactions in the structure of the nucleosome core particle at 1.9 a resolution. J Mol Biol. 2002;319(5):1097–1113. doi: 10.1016/S0022-2836(02)00386-8. [DOI] [PubMed] [Google Scholar]
- 10.Richmond TJ, Davey CA. The structure of DNA in the nucleosome core. Nature. 2003;423(6936):145–150. doi: 10.1038/nature01595. [DOI] [PubMed] [Google Scholar]
- 11.Polach KJ, Widom J. Mechanism of protein access to specific DNA sequences in chromatin: A dynamic equilibrium model for gene regulation. J Mol Biol. 1995;254(2):130–149. doi: 10.1006/jmbi.1995.0606. [DOI] [PubMed] [Google Scholar]
- 12.Anderson JD, Thåström A, Widom J. Spontaneous access of proteins to buried nucleosomal DNA target sites occurs via a mechanism that is distinct from nucleosome translocation. Mol Cell Biol. 2002;22(20):7147–7157. doi: 10.1128/MCB.22.20.7147-7157.2002. [DOI] [PMC free article] [PubMed] [Google Scholar]
- 13.Li G, Widom J. Nucleosomes facilitate their own invasion. Nat Struct Mol Biol. 2004;11(8):763–769. doi: 10.1038/nsmb801. [DOI] [PubMed] [Google Scholar]
- 14.Tims HS, Gurunathan K, Levitus M, Widom J. Dynamics of nucleosome invasion by DNA binding proteins. J Mol Biol. 2011;411(2):430–448. doi: 10.1016/j.jmb.2011.05.044. [DOI] [PMC free article] [PubMed] [Google Scholar]
- 15.Adams CC, Workman JL. Binding of disparate transcriptional activators to nucleosomal DNA is inherently cooperative. Mol Cell Biol. 1995;15(3):1405–1421. doi: 10.1128/mcb.15.3.1405. [DOI] [PMC free article] [PubMed] [Google Scholar]
- 16.Miller JA, Widom J. Collaborative competition mechanism for gene activation in vivo. Mol Cell Biol. 2003;23(5):1623–1632. doi: 10.1128/MCB.23.5.1623-1632.2003. [DOI] [PMC free article] [PubMed] [Google Scholar]
- 17.Moyle-Heyrman G, Tims HS, Widom J. Structural constraints in collaborative competition of transcription factors against the nucleosome. J Mol Biol. 2011;412(4):634–646. doi: 10.1016/j.jmb.2011.07.032. [DOI] [PMC free article] [PubMed] [Google Scholar]
- 18.Mirny LA. Nucleosome-mediated cooperativity between transcription factors. Proc Natl Acad Sci USA. 2010;107(52):22534–22539. doi: 10.1073/pnas.0913805107. [DOI] [PMC free article] [PubMed] [Google Scholar]
- 19.Teif VB, Ettig R, Rippe K. A lattice model for transcription factor access to nucleosomal DNA. Biophys J. 2010;99(8):2597–2607. doi: 10.1016/j.bpj.2010.08.019. [DOI] [PMC free article] [PubMed] [Google Scholar]
- 20.Prinsen P, Schiessel H. Nucleosome stability and accessibility of its DNA to proteins. Biochimie. 2010;92(12):1722–1728. doi: 10.1016/j.biochi.2010.08.008. [DOI] [PubMed] [Google Scholar]
- 21.Möbius W, Osberg B, Tsankov AM, Rando OJ, Gerland U. Toward a unified physical model of nucleosome patterns flanking transcription start sites. Proc Natl Acad Sci USA. 2013;110(14):5719–5724. doi: 10.1073/pnas.1214048110. [DOI] [PMC free article] [PubMed] [Google Scholar]
- 22.Morozov AV, et al. Using DNA mechanics to predict in vitro nucleosome positions and formation energies. Nucleic Acids Res. 2009;37(14):4707–4722. doi: 10.1093/nar/gkp475. [DOI] [PMC free article] [PubMed] [Google Scholar]
- 23.Brogaard KR, Xi L, Wang JP, Widom J. A chemical approach to mapping nucleosomes at base pair resolution in yeast. Methods Enzymol. 2012;513:315–334. doi: 10.1016/B978-0-12-391938-0.00014-8. [DOI] [PMC free article] [PubMed] [Google Scholar]
- 24.Zlatanova J, Seebart C, Tomschik M. The linker-protein network: Control of nucleosomal DNA accessibility. Trends Biochem Sci. 2008;33(6):247–253. doi: 10.1016/j.tibs.2008.04.001. [DOI] [PubMed] [Google Scholar]
- 25.Syed SH, et al. Single-base resolution mapping of H1-nucleosome interactions and 3D organization of the nucleosome. Proc Natl Acad Sci USA. 2010;107(21):9620–9625. doi: 10.1073/pnas.1000309107. [DOI] [PMC free article] [PubMed] [Google Scholar]
- 26.Georgieva M, Roguev A, Balashev K, Zlatanova J, Miloshev G. Hho1p, the linker histone of Saccharomyces cerevisiae, is important for the proper chromatin organization in vivo. Biochim Biophys Acta. 2012;1819(5):366–374. doi: 10.1016/j.bbagrm.2011.12.003. [DOI] [PubMed] [Google Scholar]
- 27.Moore SC, Ausió J. Major role of the histones H3-H4 in the folding of the chromatin fiber. Biochem Biophys Res Commun. 1997;230(1):136–139. doi: 10.1006/bbrc.1996.5903. [DOI] [PubMed] [Google Scholar]
- 28.Schäfer G, McEvoy CR, Patterton HG. The Saccharomyces cerevisiae linker histone Hho1p is essential for chromatin compaction in stationary phase and is displaced by transcription. Proc Natl Acad Sci USA. 2008;105(39):14838–14843. doi: 10.1073/pnas.0806337105. [DOI] [PMC free article] [PubMed] [Google Scholar]
- 29.Widom J. A relationship between the helical twist of DNA and the ordered positioning of nucleosomes in all eukaryotic cells. Proc Natl Acad Sci USA. 1992;89(3):1095–1099. doi: 10.1073/pnas.89.3.1095. [DOI] [PMC free article] [PubMed] [Google Scholar]
- 30.Wang JP, et al. Preferentially quantized linker DNA lengths in Saccharomyces cerevisiae. PLOS Comput Biol. 2008;4(9):e1000175. doi: 10.1371/journal.pcbi.1000175. [DOI] [PMC free article] [PubMed] [Google Scholar]
- 31.Chereji RV, Tolkunov D, Locke G, Morozov AV. Statistical mechanics of nucleosome ordering by chromatin-structure-induced two-body interactions. Phys Rev E Stat Nonlin Soft Matter Phys. 2011;83(5 Pt 1):050903. doi: 10.1103/PhysRevE.83.050903. [DOI] [PMC free article] [PubMed] [Google Scholar]
- 32.Hall MA, et al. High-resolution dynamic mapping of histone-DNA interactions in a nucleosome. Nat Struct Mol Biol. 2009;16(2):124–129. doi: 10.1038/nsmb.1526. [DOI] [PMC free article] [PubMed] [Google Scholar]
- 33.Forties RA, et al. A quantitative model of nucleosome dynamics. Nucleic Acids Res. 2011;39(19):8306–8313. doi: 10.1093/nar/gkr422. [DOI] [PMC free article] [PubMed] [Google Scholar]
- 34.Thåström A, et al. Sequence motifs and free energies of selected natural and non-natural nucleosome positioning DNA sequences. J Mol Biol. 1999;288(2):213–229. doi: 10.1006/jmbi.1999.2686. [DOI] [PubMed] [Google Scholar]
- 35.Henikoff JG, Belsky JA, Krassovsky K, MacAlpine DM, Henikoff S. Epigenome characterization at single base-pair resolution. Proc Natl Acad Sci USA. 2011;108(45):18318–18323. doi: 10.1073/pnas.1110731108. [DOI] [PMC free article] [PubMed] [Google Scholar]
- 36.Rhee HS, Pugh BF. Genome-wide structure and organization of eukaryotic pre-initiation complexes. Nature. 2012;483(7389):295–301. doi: 10.1038/nature10799. [DOI] [PMC free article] [PubMed] [Google Scholar]
- 37.Dion MF, et al. Dynamics of replication-independent histone turnover in budding yeast. Science. 2007;315(5817):1405–1408. doi: 10.1126/science.1134053. [DOI] [PubMed] [Google Scholar]
- 38.Mavrich TN, et al. A barrier nucleosome model for statistical positioning of nucleosomes throughout the yeast genome. Genome Res. 2008;18(7):1073–1083. doi: 10.1101/gr.078261.108. [DOI] [PMC free article] [PubMed] [Google Scholar]
- 39.Chereji RV, Morozov AV. Statistical mechanics of nucleosomes constrained by higher-order chromatin structure. J Stat Phys. 2011;144(2):379–404. doi: 10.1007/s10955-011-0214-y. [DOI] [PMC free article] [PubMed] [Google Scholar]
- 40.Thåström A, Lowary PT, Widom J. Measurement of histone-DNA interaction free energy in nucleosomes. Methods. 2004;33(1):33–44. doi: 10.1016/j.ymeth.2003.10.018. [DOI] [PubMed] [Google Scholar]
- 41.Locke G, Tolkunov D, Moqtaderi Z, Struhl K, Morozov AV. High-throughput sequencing reveals a simple model of nucleosome energetics. Proc Natl Acad Sci USA. 2010;107(49):20998–21003. doi: 10.1073/pnas.1003838107. [DOI] [PMC free article] [PubMed] [Google Scholar]
- 42.Locke G, Haberman D, Johnson SM, Morozov AV. Global remodeling of nucleosome positions in C. elegans. BMC Genomics. 2013;14:284. doi: 10.1186/1471-2164-14-284. [DOI] [PMC free article] [PubMed] [Google Scholar]
- 43.Cole HA, Howard BH, Clark DJ. The centromeric nucleosome of budding yeast is perfectly positioned and covers the entire centromere. Proc Natl Acad Sci USA. 2011;108(31):12687–12692. doi: 10.1073/pnas.1104978108. [DOI] [PMC free article] [PubMed] [Google Scholar]
- 44.Nagarajavel V, Iben JR, Howard BH, Maraia RJ, Clark DJ. Global ‘bootprinting’ reveals the elastic architecture of the yeast TFIIIB-TFIIIC transcription complex in vivo. Nucleic Acids Res. 2013;41(17):8135–8143. doi: 10.1093/nar/gkt611. [DOI] [PMC free article] [PubMed] [Google Scholar]
- 45.Kaplan N, et al. The DNA-encoded nucleosome organization of a eukaryotic genome. Nature. 2009;458(7236):362–366. doi: 10.1038/nature07667. [DOI] [PMC free article] [PubMed] [Google Scholar]
Associated Data
This section collects any data citations, data availability statements, or supplementary materials included in this article.