

Significance
Ancient plant polyploids contain dissimilar subgenomes. Subgenomes that have lost fewer genes are subgenomes that tend to express their genes to higher mRNA levels: “genome dominance.” Genome dominance is heritable through multiple rounds of polyploidy and over tens of millions of years. Twenty-four–nucleotide RNA coverage of noncoding, transposon DNA upstream of genes marks the recessive subgenomes of Brassica rapa and Arabidopsis with only a small effect of gene expression. We hypothesize that the “diploid” parent of a tetraploidy with the lowest transposon load was to become the dominant subgenome. The balance of transposon position effects on genes is important for the regulation of quantity (and perhaps to solve the heterosis and C-value paradoxes).
Keywords: Brassica, epigenetics
Abstract
Whole-genome duplications happen repeatedly in a typical flowering plant lineage. Following most ancient tetraploidies, the two subgenomes are distinguishable because one subgenome, the dominant subgenome, tends to have more genes than the other subgenome. Additionally, among retained pairs, the gene on the dominant subgenome tends to be expressed more than its recessive homeolog. Using comparative genomics, we show that genome dominance is heritable. The dominant subgenome of one postpolyploidy event remains dominant through a subsequent polyploidy event. We show that transposon-derived 24-nt RNAs target and cover the upstream region of retained genes preferentially when located on the recessive subgenome, and with little regard for a gene’s level of expression. We hypothesize that small RNA (smRNA)-mediated silencing of transposons near genes causes position-effect down-regulation. Unlike 24-nt smRNA coverage, transposon coverage tracks gene expression, so not all transposons behave identically. We propose that successful ancient tetraploids begin as wide crosses between two lines, each evolved for different tradeoffs between transposon silencing and negative position effects on gene expression. We hypothesize that following a chaotic wide-cross/new tetraploid period, genes acquire their new expression balances based on differences in transposon coverage in the parents. We envision patches of silenceable transposon as quantitative cis-regulators of baseline transcription rate. Attractive solutions to heterosis and the C-value paradox are mentioned.
Whole-genome duplications (WGDs) have occurred in many eukaryotic lineages, particularly plants (1). Twenty-four ancient plant polyploidies have been documented within plant genomes as of January 2014 (http://genomevolution.org/wiki/index.php/Plant_paleopolyploidy). In maize, some crucifers, and perhaps all new plant polyploids, fractionation (loss of duplicated genes) and diploidization (return to diploid meiotic behavior) happen within a few million years of the WGD (2). In the grasses, both fractionation and diploidization are relatively rapid (3). The general mechanism of fractionation is known for the most recent tetraploidy in the maize var. B73 lineage (4) and the paleohexaploidy in the Brassica rapa var. Chiifu lineage (5, 6); this mechanism is deletion following intrachromosomal recombination.
It is useful to partition post-WGD genomes into subgenomes when discussing fractionation. By doing so, it has been found that subgenomes generated upon ancient WGD in both the Arabidopsis (7) and maize (4) lineages do not behave in the same way: One of the two subgenomes loses significantly more genes than the other. This phenomenon, called fractionation bias (7), has been generalized to all eukaryotes (8, 9). In studies comparing gene expression from genes retained as pairs (homeologs, also known as syntenic paralogs) in maize (10) and B. rapa (11), subgenomes that had fewer genes (more highly fractionated) are enriched for genes that were expressed at relatively lower mRNA levels compared with their homeologs; these two studies explain how subgenomes are logically assembled like a puzzle with a unique solution. This whole-subgenome inverse correlation of expression level with gene loss defines genome dominance. Most ancient polyploidies (probably allopolyploids) demonstrate genome dominance (i.e., this inverse correlation), but some (probably autopolyploids) do not (12).
Although functional DNA in maize was deleted preferentially from the recessive homeolog, nonfunctional DNA (e.g., transposons, nonconserved intron sequence) was deleted from the two subgenomes at the same frequency, leading to a working hypothesis: Genes expressed less than their homeologs are easier to delete because their removal is less likely to lower fitness, so they escape purifying selection (10). Maize genes with a documented phenotype tend to be on the dominant subgenome (13), and conserved noncoding sequences are preferentially deleted from the recessive subgenome of maize (14) and B. rapa (6). Plant allotetraploids happening less than 1 Mya express genome dominance (15–17), but data from synthetic allotetraploids are ambiguous (18, 19). Genome dominance may take many generations to stabilize epigenetically, like inbreeding depression (20).
The gene expression component of genome dominance is usually determined using RNA-sequencing (RNA-seq) data from the shoot, a particularly complex organ system composed of many organs, developmental times, and cell expression end points. Among suitable plant polyploids with sequenced genomes, maize (Zea mays var. B73) RNA-seq data are the richest (http://qteller.com/qteller3/); maize RNA-seq data best separate out gene expression into specific end points. SI Appendix, Fig. 1 compares expression [fragments per kilobase of transcript per million mapped fragments (FPKM)] between a homoeologous pair of maize genes retained from the most recent WGD, using 37 expression datasets generated by seven different laboratories. This figure illustrates a general rule: Homeolog expression is often biased, and that bias tends to be reflected at every end point (http://qteller.com/qteller3/scatter_plot.php?name1=GRMZM2G057973&name2=GRMZM2G004140&xmax=80&ymax=80&info). This result is the most accurate definition of gene dominance. Because the dominant gene of a pair tends to reside on a particular subgenome, cases of gene dominance accumulate into an argument for genome dominance. Another homeolog expression plot has been published by Tang et al. (5). Implied here is that rates of transcription and rates of turnover have been more or less stable in all developmental end points since the polyploidy stabilized.
B. rapa, the focus of this study, has three subgenomes compared with its fellow crucifer, Arabidopsis (Arabidopsis thaliana) (Fig. 1), with one subgenome dominant over the other two subgenomes (5, 11, 21). Gene dominance is also observed in B. rapa, but the RNA-seq data for B. rapa afford poor resolution. We have a reasonable expectation: A gene should have a variable resistor, a rheostat ( ), that is gene-specific rather than developmental end point-specific, and this element should set the default balance of this gene’s expression compared with other genes in a coregulated network. Of course, genetic diversity in many other components of a gene influence specific expression levels in specific times, places, and cells.
Fig. 1.
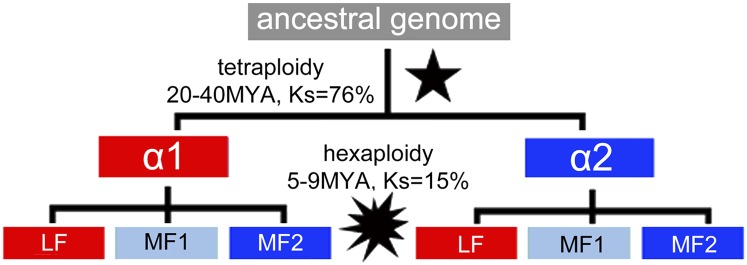
Phylogeny of genome polyploidy events in the crucifers. Both Arabidopsis and B. rapa share the α-tetraploidy event (black star) that occurred 20–40 Mya, after which Brassica underwent a hexaploidy event 5–9 Mya (black starburst), giving rise to up to six copies of every pre-α ancestral gene. Synonymous substitutions per synonymous site (Ks) values are between homologous genes.
A clue to the nature of this metaphorical “rheostat” came from the laboratory of Brandon Gaut (22, 23), comparing the genomes of two reference Arabidopsis species, A. thaliana and A. lyrata. These workers found a negative correlation between (i) small RNA (smRNA)-mediated methylation of transposons near the transcriptional unit and (ii) mRNA levels (22, 23). The general conclusion was that silenced transposons near genes exert a whole-genome, negative effect on gene expression. They also found that the effect was more pronounced in A. thaliana than in A. lyrata, suggesting that silencing may be more efficient in this smaller genome species relative to that of A. lyrata. They derived the hypothesis that there is a fitness tradeoff between keeping transposons controlled and the mRNA level of adjacent genes; small genomes like A. thaliana, those more efficient at transposon silencing, maintain relatively low levels of mRNA in comparison to the larger, more highly expressed A. lyrata. The work of Gaut’s laboratory (22, 23) inspired us to think of whole-genome position effects and how biased fractionation and genome dominance might originate. The classic genetic phenomenon of position effect (24) and the position effects on transgenes in plants (16), where euchromatic genes are sometimes silenced when translocated near the silent transposons of heterochromatin, inform the results of Gaut’s group (22, 23). The silenced transposons may act as islands of heterochromatin, as will be discussed elsewhere in this paper and as this laboratory has hypothesized previously (20).
Given this tradeoff hypothesis, we postulated that genome dominance occurs because genes from different parental genomes brought their smRNA-modulated transposon islands (heterochromatin) along with them into the tetraploid; one genome had a larger transposon load than the other, so its genes tended to be relatively suppressed by position effect. This report provides data testing this hypothesis.
What we found, potentially, is a solution to a more general question: What is the mechanism used by plants (or eukaryotes) to change quantitative balances of gene expression rapidly? Not surprisingly, relatively rapid changes in transposon content play the starring roles in our genome dominance mechanism.
Results
Gene Retention in the Dominant B. rapa and A. thaliana Subgenomes Suggests Heritable Biased Fractionation.
Approximately 20–40 Mya, the ancestor of both A. thaliana (Arabidopsis) and B. rapa underwent a WGD event called “alpha” (α) (Fig. 1). After Arabidopsis and Brassica diverged, the B. rapa lineage underwent another whole-genome triplication event 5–9 Mya (21) (Fig. 1), giving rise to a hexaploidy. Therefore, although Arabidopsis has a maximum of two copies for each ancestral, pre-α gene, Brassica has up to six copies of each ancestral, pre-α gene (Fig. 1). We asked if, following the hexaploidy event, there were a difference in gene retention between the less fractionated, dominant α-subgenome, α1, and the more fractionated, recessive α-subgenome, α2, as defined in the Introduction. We selected only retained duplicate pairs of Arabidopsis α, where both genes had at least one retained B. rapa ortholog. Because we chose to follow only α-retained pairs, the Brassica lineages descending from each of these paired genes are expected to behave the same; decedents into Brassica are expected to retain genes at a ratio of 1:1, and this was not the case. There were more triplets of retained homeologs than expected in the α1 subgenome lineage (Table 1), whereas there were fewer than expected retained posthexaploidy triplets in the α2 subgenome lineage (P = 0.004) (Table 1). Doublets of posthexaploidy homeologs showed a similar trend (P = 0.162). Lastly, there were more singly retained genes in the α2 (recessive) subgenome lineage than in the α1 subgenome lineage (P = 0.213). Altogether, these data are consistent with the hypothesis that the fractionation bias set up post-α may be heritable through the paleohexaploidy event (5) in the Brassica lineage and has influenced the gene content of B. rapa.
Table 1.
Inheritance of fractionation dominance, as measured by gene counts per subgenome [α1 (dominant) and α2] from retained homeologous pairs of the α-tetraploidy through the Brassica lineage hexaploidy into B. rapa singlets, doublets, and triplets
| Posthexaploidy in B. rapa homeologs | B. rapa genes from α1 lineage | B. rapa genes from α2 lineage | P* (exp. 1:1) |
| Triplet | 298 | 232 | 0.004 |
| Doublet | 717 | 665 | 0.162 |
| Singlet | 923 | 977 | 0.215 |
| Total Brassica genes | 1,938 | 1,874 | 0.300 |
| Total retained α | 2,374 | 2,374 | — |
Because the number of genes per retained α-pair is 1:1, we expect that the ratio of gene retention posthexaploidy would also be 1:1 if genome dominance were not heritable.
Genome Dominance Post–α-Tetraploidy Is Heritable Through the Brassica Paleohexaploidy.
Because fractionation occurs in both nondominant subgenomes in the Brassica lineage (Table 1), we asked if genome dominance, as reflected by differences in mRNA levels, was heritable. Using the α-pairs of Table 1, we obtained Arabidopsis leaf RNA-seq data from the Short Read Archive (GEO accessions in SI Appendix, Methods) and rendered them into FPKM using the qTeller pipeline (http://qteller.com/arabidopsis/faq.php) as described in SI Appendix, Methods. For B. rapa var. Chiifu gene expression, we examined leaf, root, and stem RNA-seq data generated in the laboratory of one of the authors (X.W.) (11), and also rendered these data using the qTeller pipeline. We measured genome dominance in two ways. First, we ran strict horse races between homeologs, where a win was declared no matter how close the race (Table 2, rows 2–4.) Then, we modified the horse race so that we only counted wins that were significant at P < 0.05. Of course, this modification reduced the number of qualifying races (Table 2, rows 5–7). For consistency, we focused on the retained genes in the less fractionated (dominant) B. rapa subgenome (LF) (Fig. 1). On average, α1 genes are expressed more than α2 genes. When a gene in α1 is expressed more than its α2 homeolog in Arabidopsis (i.e., α1 > α2 in Table 2), the B. rapa LF orthologs of α1 posthexaploidy (LF1) tend to be expressed more than the posthexaploid orthologs of α2 (LF2) (LF1 > LF2: rows 2 and 5 of Table 2). Similarly, whenever Arabidopsis α2 is expressed more than Arabidopsis α1 (α1 < α2), B. rapa LF orthologs of α2 tend to be expressed more than the orthologs of α1 (LF2 > LF1).
Table 2.
Inheritance of mRNA levels per gene marking subgenome from the α-paleotetraploidy through the hexaploidy, as measured in B. rapa
| Horse race type | LF* (Br) | α1 > α2 (At) | α2 > α1 (At) | P by χ2 (exp. 1:1) |
| Any margin | LF1 > LF2 | 290 | 126 | 9E-16 |
| Any margin | LF2 > LF1 | 150 | 270 | 45E-09 |
| Any margin | Total LF | 440 | 396 | 0.13 |
| P < 0.05 only† | LF1 > LF2 | 131 | 22 | 1E-18 |
| P < 0.05 only | LF2 > LF1 | 30 | 118 | 5E-13 |
| P < 0.05 only | Total LF | 161 | 140 | 0.23 |
| Total retained α | 2,374 | 2,374 | — |
At, Arabidopsis thaliana; Br, Brassica rapa.
LF1 is the dominant B. rapa ortholog of Arabidopsis α1; LF2 is the dominant B. rapa ortholog of Arabidopsis α2.
The lower threshold of significance required to record these horse races.
Together, these data show that genome dominance, monitored as either gene fractionation or expression amount, is heritable through multiple rounds of genome duplication through nearly 30 My of crucifer evolution. Horse races that only include wins by a significant margin did not change outcome.
Twenty-Four–Nucleotide smRNAs Preferentially Target the More Fractionated Subgenomes in B. rapa.
Because genome dominance is heritable, there must have been some original signal that differentiated subgenomes when they were first formed, as well as a heritable signal that is passed down to differentiate the subgenomes. This heritable signal must be somehow connected to the original event that differentiated α1 from α2. Identification of such a heritable tag does not mean that this tag was the initial cause of the differences between subgenomes. Here, we focus on the involvement of smRNA-directed DNA methylation. The reason for this was described in the Introduction (22, 23). We asked first if smRNAs preferentially target near genes on the more fractionated, less expressed subgenomes of B. rapa. We sequenced smRNAs extracted from three seedling organs: leaf, stem, and root from B. rapa var. Chiifu (taking mRNA for RNA-seq from the same preparations). First, we looked at the distribution of each size class of smRNAs flanking B. rapa genes. After removing adaptor sequence and low-quality reads, we aligned filtered reads to transposable element (TE) sequences (i.e., all sequence in the genome except transposon sequence was masked) and non-TE genomic sequences separately (SI Appendix, Methods). Only unique, perfectly mapped reads were reported, and stacks of identical RNA molecules were removed as outliers (box pile outliers in SI Appendix, section 1 and Methods). The number of nonredundant smRNAs upstream and downstream of each gene was then averaged in a 100-bp sliding window moving in 10-bp increments. To observe the mapping status of reads around B. rapa genes, we first defined the flanking regions of genes as the 5-kb sequences upstream of the transcription start site (+1) at the 5′ UTR of genes and also as the 5-kb sequences downstream of the 3′ UTR (SI Appendix, Methods). By looking at the smRNAs of different lengths, we found that 24-bp smRNAs targeted much more to TEs than to non-TE genomic sequences in flanking regions. There was also significant enrichment of smRNAs associated with TE sequences in the 2-kb flanking B. rapa genes, especially in the 5′ upstream region (Fig. 2A). The 23-nt RNAs showed similar results but were much less abundant than 24-nt RNA, and RNAs of other lengths were not as significantly targeted to TEs as the 24-nt RNAs (SI Appendix, Fig. 2). This indicates that the 24-nt RNAs are associated with TEs and are found preferentially upstream of the 5′ UTR.
Fig. 2.

Twenty-four–nucleotide smRNAs were enriched in TEs flanking LF B. rapa genes. In the y axis, the number of unique, perfectly mapped 24-nt RNAs was averaged in a 100-bp sliding window moving in 10-bp increments through each flanking region of B. rapa genes. All genes have an Arabidopsis ortholog. In the x axis, kilobytes from the start and end of transcription are shown; the dashed line indicates excluded gene space. (A) Overall targeting level distribution of 24-nt RNA molecules to flanking sequences of the average B. rapa gene, with (green) and without (red) known transposons being hard-masked. (B) Overall targeting level distribution of 24-nt RNA molecules to flanking TE sequences outside of the gene (everything but TEs masked) of B. rapa genes, with subgenome location of these genes differentiated by LF (red) or MFs (blue, MF1 and MF2). Genes from subgenome LF and MFs were calculated separately.
We next looked at the relationship between TE-derived smRNAs of all lengths and the subgenomes in B. rapa. Because 24-nt RNAs are the predominant smRNA associated with TE sequence in B. rapa and were the main class that showed subgenome differences, we focused on the 24-nt RNA size class for the remainder of this study. In B. rapa, the LF subgenome undergoes less fractionation than the other two subgenomes (21) [but the recessive more fractionated B. rapa genome (MF1) is dominant over MF2] and LF’s posthexaploidy retained genes tend to maintain higher mRNA levels than do its homeologs in the two recessive subgenomes (11). Using a 100-bp window moving in 10-bp steps across the flanking regions of genes, we calculated the average number of our unique TE-derived 24-nt RNA reads for all genes for each subgenome. The flanking sequences of genes from the dominant subgenome LF had fewer TE-derived, 24-nt smRNAs targeting than did those of the MF (more recessive) subgenomes, with 5′ upstream showing the most targeting (Fig. 2B). Genes marking the dominant subgenome LF are targeted less for 24-nt RNAs than are genes in the MF1 and MF2 recessive subgenomes.
Table 3 displays the relationship between TE-derived, 24-nt smRNA density when aligned to our genes, located to subgenome, and the influence of the relative expression levels on these data. We focused on 24-nt smRNAs mapping uniquely to −1 to −500 bp upstream from the transcription start site, because those are in the peak of the smRNA distribution over the composite genes of Fig. 2. We studied cases in B. rapa where two of the three posthexaploidy homeologs were retained (doublets), one of them being from the dominant LF, with the homeolog being either MF1 or MF2. For the three B. rapa var. Chiifu organs with smRNA data, we now use the corresponding mRNA-seq data. For each doublet, we performed an RNA-seq FPKM horse race, where the winner is the gene that is most expressed (SI Appendix, section 1 and Fig. 2). We performed another horse race on these pairs to find out which gene in a pair was more highly targeted by TE-derived, 24-nt smRNA reads. Examining Table 3, row 1, of the 2,174 LF/MF doublets in B. rapa, the MF gene is significantly (P by χ2 = 0.0006) more targeted with smRNAs than is the LF gene, by a margin of 13%. This is true even when we only count races where, contrary to expectations, MF wins the race (Table 3, row 5), and it is especially true when MF wins definitively (Table 3, row 7). It matters little how overexpressed LF is compared with MF. Does this targeting of the MF subgenome doublets reverse when, contrary to expectations, the MF gene expresses more than the LF gene? No, genes on the MF subgenome always win (Table 3, all rows with winners). However, when LF genes overexpress MF genes most definitively (Table 3, row 4), the MF win is damped to below the 5% level of significance. We thus conclude that when the degree of 24-nt RNA targeting is quantified, the most targeted genes of a doublet are located on the recessive subgenome, with some small regard for the history of RNA expression. Data for the Arabidopsis α-subgenomes (SI Appendix, Table 1A; RNA-seq data from the Gene Expression Omnibus contributed by four different laboratories) are similar but less dramatic, with more “no winner” rows. Again, the degree of 24-nt smRNA targeting on Arabidopsis retained pairs tags the recessive (α2) subgenome.
Table 3.
Two-gene horse race experiment comparing the 500-bp upstream region of B. rapa doublet genes per subgenome as a target for 24-nt RNA reads
| 24-nt smRNA reads | No. of doublets | P by χ2 of win* | LF winner | MF winner | P by χ2 of 1:1 | Margin of win, % |
| All doublets (gene pairs) | 2,174 | No limit | 1,039 | 1,194 | 0.0004 | MF 13 |
| LF expressed > MF | 1,198 | No limit | 567 | 648 | 0.02 | MF 13 |
| LF expressed > MF | 608 | <0.05 | 280 | 328 | 0.05 | MF 15 |
| LF expressed > MF | 365 | <0.001 | 175 | 190 | 0.4 | No winner |
| MF expressed > LF | 976 | No limit | 432 | 502 | 0.03 | MF 14 |
| MF expressed > LF | 456 | <0.05 | 196 | 260 | 0.003 | MF 25 |
| MF expressed > LF | 267 | <0.001 | 116 | 151 | 0.03 | MF 23 |
The lower threshold of significance for FPKM, smRNA, or TEs required to record these horse races.
Removing either simple or low-complexity sequences (using WindowMasker) (25) did not alter either gene or genome dominance (SI Appendix, Fig. 4) in any horse race.
TE Targeting Is Correlated with Both the Nondominant Genome and Gene Expression.
Perhaps it is not so much the degree of 24-nt RNA targeting but whether or not there is at least one smRNA for the targeted transposon that matters. To test this idea, we measured 24-bp smRNA coverage in the 500-bp upstream region in both B. rapa (Table 4) and Arabidopsis (SI Appendix, Table 1B). This “one smRNA may be as useful as many” idea seems to be correct. The MF subgenome is tagged by either of these measures and, for most genes, about equally well. There does seem to be an exaggeration of the margin of the MF win in those few genes where, contrary to expectations, MF expresses more than LF (Table 4, last 3 rows). However, the glaring result is that both measures of 24-bp smRNA action, degree of targeting (Table 3), and coverage (Table 4), tag genes located on the recessive subgenome (MFs) with only modest regard for the relative expression of those genes.
Table 4.
Two-gene horse race experiment comparing the 500-bp upstream region of B. rapa doublet genes per subgenome as a target for 24-nt RNA coverage (base pairs)
| 24-nt smRNA coverage, bp | No. of doublets | P by χ2 of win* | LF winner | MF winner | P by χ2 of 1:1 | Margin of win, % |
| All doublets (gene pairs) | 2,238 | No limit | 1,035 | 1,203 | 0.0004 | MF 14 |
| LF expressed > MF | 1,217 | No limit | 556 | 661 | 0.003 | MF 16 |
| LF expressed > MF | 765 | <0.05 | 355 | 410 | 0.05 | MF 13 |
| LF expressed > MF | 563 | <0.001 | 265 | 298 | 0.2 | No winner |
| MF expressed > LF | 937 | No limit | 437 | 500 | 0.04 | MF 13 |
| MF expressed > LF | 560 | <0.05 | 252 | 308 | 0.003 | MF 18 |
| MF expressed > LF | 402 | <0.001 | 180 | 222 | 0.04 | MF 19 |
The lower threshold of significance for FPKM, smRNA, or TEs required to record these horse races.
The 24-bp RNAs are derived from the transposon sequence (Fig. 2B); thus, perhaps transposon coverage in the 500-bp upstream region will also tag the recessive subgenome.
The average number of base pairs covered by TEs in the 500-bp region upstream of the median B. rapa gene is 131 bp. Table 5 displays these TE coverage data for B. rapa doublets. TE (Table 5, row 1) coverage indeed tags the recessive subgenome with a 19% margin of win for the “no limit” horse races (horse races not modified to require some significance to be a win). However, that margin of win is fully dependent on differences in gene expression. In those cases where expression win is the opposite of expected (MF > LF for the doublet), the MF subgenome tag disappears in the unmodified horse race (Table 5, row 5, no limit) and is reversed to an LF tag when modified horse races demand a more definitive win (Table 5, rows 6 and 7). Although there appears to be an underlying genome dominance, overlaid is a major sensitivity to gene expression that was not seen when smRNAs (Tables 3 and 4) were evaluated as subgenome tags. Because 24-nt smRNAs are associated with transposon sequence does not mean that they target every transposon that affects gene expression, as will be discussed.
Table 5.
Two-gene horse race experiment comparing the 500-bp upstream region of B. rapa doublet genes per subgenome as a target for TE coverage
| TE coverage, bp | No. of doublets | P by χ2 of win* | LF winner | MF winner | P by χ2 of 1:1 | Margin of win, % |
| All doublets (gene pairs) | 2,813 | No limit | 1,257 | 1,556 | 2.00E-18 | MF 19 |
| LF expressed > MF | 1,515 | No limit | 586 | 929 | 0 | MF 37 |
| LF expressed > MF | 996 | <0.05 | 350 | 646 | 7.00E-21 | MF 46 |
| LF expressed > MF | 773 | <0.001 | 267 | 506 | 8.00E-18 | MF 47 |
| MF expressed > LF | 1,217 | No limit | 628 | 589 | 0.3 | No winner |
| MF expressed > LF | 777 | <0.05 | 417 | 360 | 0.04 | LF 16 |
| MF expressed > LF | 574 | <0.001 | 311 | 263 | 0.05 | LF 18 |
The lower threshold of significance for FPKM, smRNA, or TEs required to record these horse races.
TE coverage data for Arabidopsis (SI Appendix, Table 1C) are consistent with these B. rapa data, but less dramatic.
Discussion
Genome dominance, as defined by both fractionation and mRNA level differences in the tetraploid, once established, may be inherited and reinforced through subsequent polyploidies spanning tens of millions of years (Fig. 1 and Tables 1 and 2). The second paragraph of the Introduction defines genome dominance. We show that the genome dominance relationships of an earlier polyploidy (α) have a clear influence on the later Brassica hexaploidy. There is a tendency for the genes on the dominant subgenome to become even more dominant after the second paleopolyploidy, but genome dominance is inherited over tens of millions of years.
We show that unique sequence 24-nt smRNAs targeting the B. rapa genome have almost zero homologies when known TEs are hard-masked (Fig. 2B) and that 24-nt RNAs are able to target preferentially, in unique reads (exact definitions of our units are provided in SI Appendix, section 1), regions flanking genes on the recessive subgenome (Fig. 2B). They then use these data to pick a 500-bp window upstream of the start of transcription to use in our horse race experiments.
Because 24-nt smRNAs are amplified from transposons and because smRNA coverage, presumably to transposons, tags the gene on the recessive subgenome even when that gene is, unexpectedly, expressed more than its homeolog, perhaps transposon coverage is the real driver of genome dominance. The TE coverage data of Table 5 disprove this supposition. Transposon coverage is able to pick the dominant and recessive subgenomes, but when gene expression is unexpectedly reversed, transposon coverage reverses as well. That is, TE coverage tracks gene expression, and thus gene dominance, to a greater degree than it does genome dominance. We are now able to differentiate gene dominance from genome dominance; thus, the complicated definition of genome dominance presented in the Introduction may now be retired. Based on the data in Tables 3 and 4, either degree of uniquely mapping 24-nt smRNA targeting (Table 3) or coverage (Table 4), within the 500-bp window upstream of B. rapa doublets, unambiguously defines dominance for any subgenome. Data suggest that this biased RNA silencing is maintained by both the Pol V interactor DEFECTIVE IN MERISTEM SILENCING 4 and the RNA-dependent RNA polymerase enzyme RNA-DEPENDENT RNA POLYMERASE 2 (SI Appendix, Fig. 5), both of which are involved in TE silencing via the RNA-directed DNA methylation pathway (26, 27; reviewed in ref. 28).
One result absolutely differentiates genome dominance from gene expression (or “gene dominance”). An unexpected result occurred during our horse race experiments following 24-nt RNA degree of targeting and coverage (Tables 3 and 4, last 2 rows of data for each). These data follow those special reversed doublets where the MF gene is expressed to higher mRNA levels in shoots than is the LF homeolog. These data are for the modified horse races that follow the no limit horse race; modified races record a win only if the win is above a set threshold of significance. The results of these modified horse races are repeatable, significant, and incompletely understood: (i) Understood is that these data prove unequivocally that genome dominance is apart from gene expression and that both measures of 24-nt RNA track the recessive subgenome, and not low gene expression, and (ii) not understood is how ever higher significance of the reversed races (MF beats LF) correlates with more smRNA targeting and more smRNA coverage. Perhaps transposons near genes are not always down-regulators. When this situation exists, such genes may be more resistant to the effects of genome dominance. This result should spur continued research.
Almost all species contain mechanisms to silence TEs. TE insertion precedes the smRNA mechanisms that silence TEs. Because the two subgenomes of an allotetraploid originate from two different genomes existing tens of millions of years ago, each with what must have been different transposon populations, bloom histories, distributions, and levels, we hypothesize that a differential load of TEs in the parental lines is a sufficient explanation for the origin of subgenome dominance. Hollister et al. (22) provided strong evidence that TE silencing represents a tradeoff between the primary selection to reduce transposon expression and the consequent reduction in levels of gene expression for genes near transposons via a position effect whereby the silencing of the transposon spreads to an adjacent gene’s promoter. In the words of evolutionary biology, the tendency to lower adjacent gene expression (the position effect) is a spandrel of positive selection for TE control, which was stronger in the A. thaliana lineage than in the A. lyrata lineage in the Gaut laboratory studies (22). We hypothesize that when two genomes come together in an allotetraploid, one genome has invariably made compromises to a different level than the other based on differences in transposon bloom-and-purge history and the degree of selection against TE amplification. SI Appendix, section 2 theorizes a wide cross between very different genomes and follows it into the new polyploid population where new tradeoffs are made, resulting in, we hypothesize, genome dominance. In short, the parental genome with the greater TE content will tend to have genes with higher transposon coverage in the upstream positions and will become the recessive subgenome in the stabilized allotetraploid. This model is taken step by step in SI Appendix, section 2. It follows that an ancient autotetraploid should not display genome dominance, and there is evidence for this (12).
Once genome dominance is established during the initial inbreeding generations following the polyploidy event itself, genes on one subgenome tend to express less than genes on the other. We predict that this essential inequality begins a cascade of mutational differences based on nothing more profound than “a less expressed gene is easier to mutate” or alter by recombination. A gene’s lineage might have begun by being on a recessive subgenome but subsequently accumulates mutations that lower expression further (e.g., various enhancer deletions, less efficient splice joints, point mutations in the core promoter), including continued accumulation of TE insertions and the mutations caused upon TE excisions. It seems fortunate that we could even measure genome dominance as separate from gene expression.
Consider the initial wide hybrid as being between two lines of the same species that exhibited a heterotic phenotype somehow because of the many differences between alleles. The tetraploidy makes permanent the “heterozygosity” (but perhaps not the heterosis). Might allelic diversity within breeding populations further contribute to the initiation of genome dominance? Certainly, but we must keep in mind that genome dominance is a characteristic, so far, of ancient polyploids rather than synthetic polyploids, presumably because synthetic polyploids have not had a chance to monitor their transposons and reestablish the tradeoffs between gene expression and transposon silencing that precede stability. Resolving different alleles, rather than just genes on subgenomes, will be a challenge.
One explanation, and the only one we can now envision, for the differences between smRNA coverage [that tags subgenomes but is nearly insensitive to gene expression (Tables 3 and 4)] and TE coverage [genome dominance exists but is obscured by large sensitivity to gene expression (Table 5)] is that not all B. rapa transposons are functionally identical. Some apparently affect gene expression but are not silenced via the smRNA pathway. Transposon families may not be equally represented in the 500-bp windows, or the position relative to the TSS matters for position-effect down-regulation, or orientation with respect to the direction of transcriptional regulators. Maize data indicate that different transposons down-regulate nearby genes differently (29). SI Appendix, Table 2 provides a summary of how various transposon classes cover B. rapa genes differentially depending on subgenome. Preliminary results are that MuDR and helitron TEs may be more effective than average at predicting subgenome.
A premier conclusion from our results on the origin of genome dominance is that a TE cluster acts as variable resistor, or rheostat (), of a typical eukaryotic gene, as diagrammed in SI Appendix, Fig. 6; we put the rheostat in the approximate position of our 500-bp window, just upstream of the core promoter, but there may not be any exact position. Fig. 1 and its explanation in the Introduction argue for the existence of a quantitative cis-regulator capable of upward or downward quantitative changes in mRNA levels that operate the same in all organs and inductive conditions. The rheostat is this element.
For setting and adjusting balance between homeologs or among networked genes, we see TE coverage as the balancing mechanism supported by our data, as discussed. If two genes are balanced by a ratio of, say, 2:1 of transposons in the rheostat position of the gene, then the balance between these two genes will be set no matter how much silencing takes place. The balance of gene products, per se, has been proved to be under selection (30).
SI Appendix, section 3 describes how the gene balance mechanism supported here, using transposon bulk as ballast (to set balances), suggests testable solutions to both heterosis and the C-value paradox.
Methods
Detailed methods can be found in SI Appendix. Briefly, for all smRNA-seq studies, reads were mapped using the Bowtie program (31). Only unique and perfectly mapped reads were included; no mismatches were allowed. We used the coverageBed script from BEDTools (32) to find smRNA and TE coverage 500 bp upstream of the 5′ UTR for the genes in this study. For mRNA-seq studies, mRNA reads were mapped using the qTeller method described in http://qteller.com/arabidopsis/faq.php, with units in FPKM.
Supplementary Material
Acknowledgments
We thank the many research teams worldwide that generated the reads we downloaded and used in various parts of this research. We especially thank James Birchler of the University of Missouri for his helpful comments and suggestions. Funding in China was provided from 973 Programs 2012CB113900 and 2013CB127000, the 863 Program 2012AA100101 (to X.W.), and National Natural Science Foundation of China Grant 31301771 (to F.C.). Funding in the United States was provided by National Science Foundation (NSF) (Plant Genome Research Program) Grant IOS1248106 (to M.F.), NSF Grant DEB1146603 (to J.C.P.), and NSF Grant IOS1237931 (to D.L.).
Footnotes
The authors declare no conflict of interest.
This article contains supporting information online at www.pnas.org/lookup/suppl/doi:10.1073/pnas.1402475111/-/DCSupplemental.
References
- 1.Van de Peer Y. A mystery unveiled. Genome Biol. 2011;12(5):113. doi: 10.1186/gb-2011-12-5-113. [DOI] [PMC free article] [PubMed] [Google Scholar]
- 2.Mandáková T, Joly S, Krzywinski M, Mummenhoff K, Lysak MA. Fast diploidization in close mesopolyploid relatives of Arabidopsis. Plant Cell. 2010;22(7):2277–2290. doi: 10.1105/tpc.110.074526. [DOI] [PMC free article] [PubMed] [Google Scholar]
- 3.Schnable JC, Freeling M, Lyons E. Genome-wide analysis of syntenic gene deletion in the grasses. Genome Biol Evol. 2012;4(3):265–277. doi: 10.1093/gbe/evs009. [DOI] [PMC free article] [PubMed] [Google Scholar]
- 4.Woodhouse MR, et al. Following tetraploidy in maize, a short deletion mechanism removed genes preferentially from one of the two homologs. PLoS Biol. 2010;8(6):e1000409. doi: 10.1371/journal.pbio.1000409. [DOI] [PMC free article] [PubMed] [Google Scholar]
- 5.Tang H, et al. Altered patterns of fractionation and exon deletions in Brassica rapa support a two-step model of paleohexaploidy. Genetics. 2012;190(4):1563–1574. doi: 10.1534/genetics.111.137349. [DOI] [PMC free article] [PubMed] [Google Scholar]
- 6.Subramaniam S, Wang X, Freeling M, Pires JC. The fate of Arabidopsis thaliana homeologous CNSs and their motifs in the Paleohexaploid Brassica rapa. Genome Biol Evol. 2013;5(4):646–660. doi: 10.1093/gbe/evt035. [DOI] [PMC free article] [PubMed] [Google Scholar]
- 7.Freeling M, Thomas BC. Gene-balanced duplications, like tetraploidy, provide predictable drive to increase morphological complexity. Genome Res. 2006;16(7):805–814. doi: 10.1101/gr.3681406. [DOI] [PubMed] [Google Scholar]
- 8.Sankoff D, Zheng C, Wang B. A model for biased fractionation after whole genome duplication. BMC Genomics. 2012;13(Suppl 1):S8. doi: 10.1186/1471-2164-13-S1-S8. [DOI] [PMC free article] [PubMed] [Google Scholar]
- 9.Sankoff D, Zheng C, Zhu Q. The collapse of gene complement following whole genome duplication. BMC Genomics. 2010;11:313. doi: 10.1186/1471-2164-11-313. [DOI] [PMC free article] [PubMed] [Google Scholar]
- 10.Schnable JC, Springer NM, Freeling M. Differentiation of the maize subgenomes by genome dominance and both ancient and ongoing gene loss. Proc Natl Acad Sci USA. 2011;108(10):4069–4074. doi: 10.1073/pnas.1101368108. [DOI] [PMC free article] [PubMed] [Google Scholar]
- 11.Cheng F, et al. Biased gene fractionation and dominant gene expression among the subgenomes of Brassica rapa. PLoS ONE. 2012;7(5):e36442. doi: 10.1371/journal.pone.0036442. [DOI] [PMC free article] [PubMed] [Google Scholar]
- 12.Garsmeur O, et al. Two evolutionarily distinct classes of paleopolyploidy. Mol Biol Evol. 2014;31(2):448–454. doi: 10.1093/molbev/mst230. [DOI] [PubMed] [Google Scholar]
- 13.Schnable JC, Freeling M. Genes identified by visible mutant phenotypes show increased bias toward one of two subgenomes of maize. PLoS ONE. 2011;6(3):e17855. doi: 10.1371/journal.pone.0017855. [DOI] [PMC free article] [PubMed] [Google Scholar]
- 14.Schnable JC, Wang X, Freeling M, Pires JC. Escape from preferential retention following repeated polyoloidies. Frontiers in Plant Genetics and Genomics. 2012 doi: 10.3389/fpls.2012.00094. [DOI] [PMC free article] [PubMed] [Google Scholar]
- 15.Chang PL, Dilkes BP, McMahon M, Comai L, Nuzhdin SV. Homoeolog-specific retention and use in allotetraploid Arabidopsis suecica depends on parent of origin and network partners. Genome Biol. 2010;11(12):R125. doi: 10.1186/gb-2010-11-12-r125. [DOI] [PMC free article] [PubMed] [Google Scholar]
- 16.Matzke AJ, Matzke MA. Position effects and epigenetic silencing of plant transgenes. Curr Opin Plant Biol. 1998;1(2):142–148. doi: 10.1016/s1369-5266(98)80016-2. [DOI] [PubMed] [Google Scholar]
- 17.Buggs RJ, et al. Tissue-specific silencing of homoeologs in natural populations of the recent allopolyploid Tragopogon mirus. New Phytol. 2010;186(1):175–183. doi: 10.1111/j.1469-8137.2010.03205.x. [DOI] [PubMed] [Google Scholar]
- 18.Flagel LE, et al. Phylogenetic, morphological, and chemotaxonomic incongruence in the North American endemic genus Echinacea. Am J Bot. 2008;95(6):756–765. doi: 10.3732/ajb.0800049. [DOI] [PubMed] [Google Scholar]
- 19.Yoo M-J, Szadkowski EP, Wendel JF. Homoeolog expression bias and expression level dominance in allopolyploid cotton. Heredity (Edinb) 2013;110(2):171–180. doi: 10.1038/hdy.2012.94. [DOI] [PMC free article] [PubMed] [Google Scholar]
- 20.Freeling M, et al. Fractionation mutagenesis and similar consequences of mechanisms removing dispensable or less-expressed DNA in plants. Curr Opin Plant Biol. 2012;15(2):131–139. doi: 10.1016/j.pbi.2012.01.015. [DOI] [PubMed] [Google Scholar]
- 21.Wang X, et al. Brassica rapa Genome Sequencing Project Consortium The genome of the mesopolyploid crop species Brassica rapa. Nat Genet. 2011;43(10):1035–1039. doi: 10.1038/ng.919. [DOI] [PubMed] [Google Scholar]
- 22.Hollister JD, et al. Transposable elements and small RNAs contribute to gene expression divergence between Arabidopsis thaliana and Arabidopsis lyrata. Proc Natl Acad Sci USA. 2011;108(6):2322–2327. doi: 10.1073/pnas.1018222108. [DOI] [PMC free article] [PubMed] [Google Scholar]
- 23.Hollister JD, Gaut BS. Epigenetic silencing of transposable elements: A trade-off between reduced transposition and deleterious effects on neighboring gene expression. Genome Res. 2009;19(8):1419–1428. doi: 10.1101/gr.091678.109. [DOI] [PMC free article] [PubMed] [Google Scholar]
- 24.Wilson C, Bellen HJ, Gehring WJ. Position effects on eukaryotic gene expression. Annu Rev Cell Biol. 1990;6:679–714. doi: 10.1146/annurev.cb.06.110190.003335. [DOI] [PubMed] [Google Scholar]
- 25.Morgulis A, Gertz EM, Schäffer AA, Agarwala R. WindowMasker: Window-based masker for sequenced genomes. Bioinformatics. 2006;22(2):134–141. doi: 10.1093/bioinformatics/bti774. [DOI] [PubMed] [Google Scholar]
- 26.Xie Z, et al. Genetic and functional diversification of small RNA pathways in plants. PLoS Biol. 2004;2(5):E104. doi: 10.1371/journal.pbio.0020104. [DOI] [PMC free article] [PubMed] [Google Scholar]
- 27.He XJ, et al. A conserved transcriptional regulator is required for RNA-directed DNA methylation and plant development. Genes Dev. 2009;23(23):2717–2722. doi: 10.1101/gad.1851809. [DOI] [PMC free article] [PubMed] [Google Scholar]
- 28.Kasschau KD, et al. Genome-wide profiling and analysis of Arabidopsis siRNAs. PLoS Biol. 2007;5(3):e57. doi: 10.1371/journal.pbio.0050057. [DOI] [PMC free article] [PubMed] [Google Scholar]
- 29.Eichten SR, et al. Spreading of heterochromatin is limited to specific families of maize retrotransposons. PLoS Genet. 2012;8(12):e1003127. doi: 10.1371/journal.pgen.1003127. [DOI] [PMC free article] [PubMed] [Google Scholar]
- 30.Birchler JA, Veitia RA. The gene balance hypothesis: Implications for gene regulation, quantitative traits and evolution. New Phytol. 2010;186(1):54–62. doi: 10.1111/j.1469-8137.2009.03087.x. [DOI] [PMC free article] [PubMed] [Google Scholar]
- 31.Langmead B, Trapnell C, Pop M, Salzberg SL. Ultrafast and memory-efficient alignment of short DNA sequences to the human genome. Genome Biol. 2009;10(3):R25. doi: 10.1186/gb-2009-10-3-r25. [DOI] [PMC free article] [PubMed] [Google Scholar]
- 32.Quinlan ARH, Hall IM. BEDTools: A flexible suite of utilities for comparing genomic features. Bioinformatics. 2010;26(6):841–842. doi: 10.1093/bioinformatics/btq033. [DOI] [PMC free article] [PubMed] [Google Scholar]
Associated Data
This section collects any data citations, data availability statements, or supplementary materials included in this article.