Abstract
We applied a visible-light spectroscopic optical coherence tomography (vis-OCT) for in vivo retinal oximetry. To extract hemoglobin oxygen saturation (sO2) in individual retinal vessels, we established a comprehensive analytical model to describe optical absorption, optical scattering, and blood cell packing factor in the whole blood and fit the acquired vis-OCT signals from the bottom of each imaged vessel. We found that averaged sO2 values in arterial and venous bloods were 95% and 72%, respectively.
Currently, retinal disorders (e.g., glaucoma, age-related macular degeneration, and diabetic retinopathy) are the leading cause of blindness in the U.S. To better understand the pathophysiology of early disorders, one essential physiological parameter is the retinal blood oxygen saturation rate (sO2). However, retinal sO2 is often over-looked mainly due to the lack of an accurate quantitative imaging tool. Attempts to noninvasively quantify retinal sO2 date back to the 1950s [1]. The most prevalent approach is multiwavelength fundus photography in which retinal images are acquired at several illuminating wavelengths. Owing to the distinct absorption spectrum of oxygenated hemoglobin (HbO2) and deoxygenated hemoglobin (Hb), optical densities of retinal vessels are calculated and then used to estimate sO2. This approach can be inaccurate because of several confounding factors, including blood cell scattering, vessel diameter, and fundus pigmentation absorption [1]. The fundamental limitation of fundus photography is the lack of axial resolution so that optical scattering signals, either from inside or outside vessels, are inseparable. Recently photoacoustic microscopy emerged as another tool capable of sO2 quantification [2]; however, there is still a long way to go before it can be applied to patients.
Being the “gold standard” in clinical retinal imaging, optical coherence tomography (OCT) has provided investigators with unprecedented capabilities to tackle virtually all the major blinding diseases owing to its excellent axial resolution, relatively low cost, ease of use, and versatility to measure a variety of anatomical and functional parameters in the eye. Since a broadband light source is employed in OCT, depth-resolved spectroscopic information can potentially be extracted to quantify sO2. Several in vitro demonstrations, using an illuminating source around the isosbestic wavelength at 815 nm, have reported that the wavelength-dependent optical attenuation coefficient of blood varies with sO2 [3-5]. The grand challenge, however, is the weak absorption of blood within the near-infrared spectral range, which provides insufficient contrast and hinders in vivo applications. Recently, we and other groups took advantage of the strong hemoglobin absorption within the visible spectral range to quantify sO2 by visible-light OCT (vis-OCT) [6-8]. So far, these attempts considered only the absorption spectrum while the oxygenation-dependent scattering from whole blood was ignored. Building upon these early results and considering the fact that blood optical scattering can greatly affect the spectrum of detected backscattered OCT signals [9], we developed a more sophisticated method to analyze OCT signals to estimate optical absorption properties of whole blood.
In this Letter, we report our in vivo retinal oximetry by vis-OCT based on a comprehensive analytical model describing both the scattering and absorption from whole blood, as well as blood vessel scattering. The packing factor due to multiple optical scattering by blood cells was also included in our model.
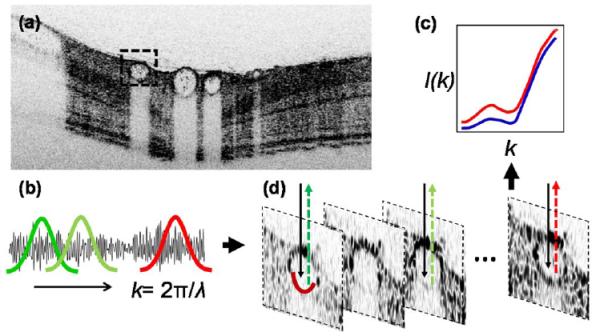
The principle of vis-OCT oximetry is illustrated in Fig. 1. The incident light reflected from the bottom vessel wall double-passed the vessel lumen. The spectrum of reflected light can be extracted by a series of short-time Fourier transforms (STFTs) [10], which can be formulated as
| (1) |
where I0 is the incident intensity on the retina. We ignored the optical attenuation by ocular lens and vitreous chamber and thus took the source spectrum as I0; R0 is the reference arm reflectance; n is the mean refractive index of the blood (~1.35); d [mm] is the vessel diameter; r [dimensionless] is the reflectance at the vessel wall, whose scattering spectrum can be modeled as a power law under the first-order Born approximation r(λ) = Aλ−α, where A is a constant [11,12]. The optical attenuation coefficient μ [mm−1] combines the absorption (μa) and scattering coefficients (μs) of whole blood, which are both wavelength- and oxygenation-dependent. The subscripts Hb and HbO2 denote the contribution from deoxygenated and oxygenated blood, respectively. By taking the natural log and plugging in the above expressions, Eq. (1) becomes
| (2) |
Fig. 1.

Illustration of vis-OCT retinal oximetry. (a) A typical in vivo B-scan image of a pigmented rat eye using inversed contrast; (b), (c) by STFT, OCT spectra from the bottom of a vessel wall were extracted; and (d) illustration of reflection spectra from artery and vein (red and blue), from which LS fit can be performed to estimate sO2.
A least-squares (LS) fit can then be performed to fit the spectrum and obtain sO2, α, and ln(AR0). The spectra of μ is equal to μ = μa + Wμs, where W is blood cell packing factor that weights the scattering spectrum. The details of μHbO2 and μHb will be described later.
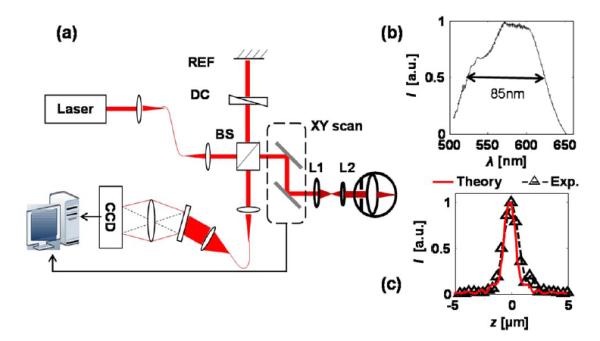
Our experimental setup consisted of a free-space spectral-domain OCT system [Fig. 2(a)], implemented with a supercontinuum source (SuperK, NKT photonics). The spectral range centers at 585 nm with an 85 nm FWHM bandwidth [Fig. 2(b)]. The theoretical axial resolution is 1.5 μm in air and was measured to be 1.7 μm [Fig. 2(c)]. A 2 k pixel line scan CCD (Aviiva, SM2, e2v) was used in a homemade spectrometer. The A-line rate was 24 kHz. To acquire a three-dimensional (3D) image consisting 256 × 256 A-lines, the acquisition time was 2.7 s.
Fig. 2.

Experimental system. (a) Schematic of the free-space vis-OCT. Lens L1 and L2 relay the beam onto the pupil. BS, beam splitter; REF, reference mirror; DC, dispersion control. (b) Illumination spectrum, and (c) theoretical and experimental axial resolutions.
We imaged pigmented rats (Long Evans rat, 500 g, Harlan Laboratories) in our in vivo experiments. Before imaging, animals were anesthetized by a mixture of 1.5% isoflurane and regular air at a flow rate of 2 liter/min. The animals were then placed in a homemade animal holder. We also applied 0.5% tetracaine hydrochloride ophthalmic solution for local eye anesthesia and 1% tropicamide ophthalmic solution for pupil dilation. Commercial eye drops were used to moisturize the cornea. The rats were removed from the holder immediately after the experiments and recovered without noticeable retinal damage in follow-up examinations. All experimental procedures were approved by Northwestern University’s IACUC and conformed to the Association for Research in Vision and Ophthalmology Statement on Animal Research.
We processed the vis-OCT data in the following steps. The raw spectra were first normalized by the source spectrum and the DC components were subtracted. After 3D images were acquired, the fundus image was obtained by mean intensity projection and the center line of each blood vessel was digitally identified. Finally, OCT spectra were extracted from the bottom vessel wall along the center lines by STFT with a Gaussian window size kw = 0.32 μm−1 (17 nm at 585 nm) [12], relaxing the axial resolution (in air) to ~8.9 μm. We averaged the spectra from each vessel for a robust estimation, and applied LS from 540 to 610 nm to retrieve sO2.
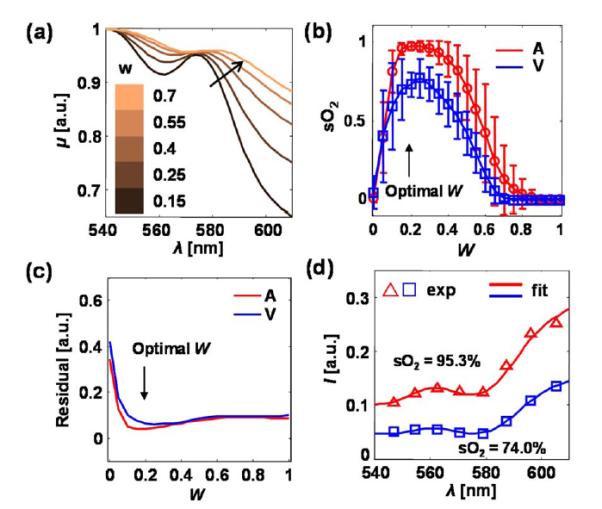
Figure 3 shows how blood optical scattering and blood cell packing factor affect the spectrum of μ. According to the Kramers–Kronig relationship, the absorption of hemoglobin affects blood optical scattering, and thus causes an oxygenation-dependent optical scattering spectrum. We calculated the spectra of μa and μs from oxygenated and deoxygenated blood according to the method reported in [9], with plasma refractive index set at 1.35. Furthermore, due to multiple scattering effects of densely packed blood cells, the scattering coefficient in whole blood was weighted by a packing factor W(0 ≤ W ≤ 1) [13,14]. The expression of μ is corrected as μ = μa + W μs, where W depends on the volume fraction of the red blood cells in whole blood (hematocrit) H [5,14]. Thus, the spectrum of μ is a function of W. As shown in Fig. 3(a), with increasing packing factor, the spectrum of μ redshifted and the entire spectral shape altered as well. We varied the value of W from 0 to 1 and performed LS fit, while the mean value and standard deviation of sO2 from the major arteries and veins were plotted in Fig. 3(b). We also calculated the mean spectral residuals from LS fit for every vessel, and averaged all the mean residuals for arteries and veins [Fig. 3(c)]. We found that when W = 0.2, the variation of calculated oxygenation (error bar) from both arteries and veins reaches their minima as well as the fitting residuals. The fitting results from an artery and vein [Nos. 3 and 6 in Fig. 4(a)] were exampled in Fig. 3(d). When W = 0.2, the hematocrit was calculated as 35% in the cylindrical particle model, 30% in the spherical particle model [5].
Fig. 3.

(a) Spectrum of μ with different values of blood cell packing factor W in whole blood. The spectra were normalized to their respective maximum values. The sO2 is set to be 90%. (b) Mean sO2 values, and (c) averaged LS spectral fitting residuals from all the arteries (A) and veins (V). Error bar = standard deviation. (d) Examples of spectral data from an artery (red) and a vein (blue).
Fig. 4.

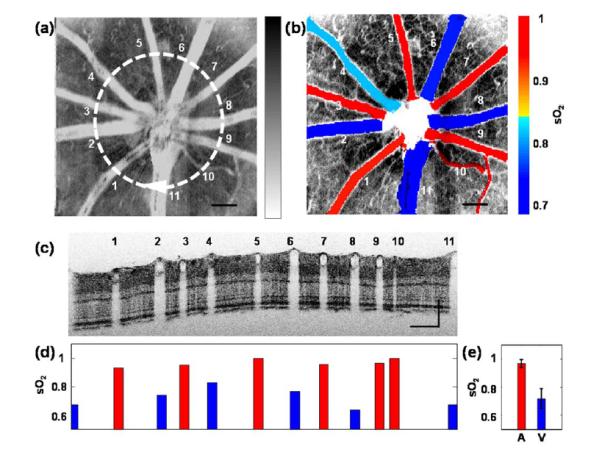
in vivo experimental results. (a) vis-OCT fundus image. The white circle highlights a circular scanning trajectory for the B-scan image shown in panel c. (b) Fused vasculature image and sO2 map in major vessels, (d) individual quantification of sO2 in every vessel shown in panel c, and (e) the average arterial and venous sO2 values. Error bar = standard deviation. Bar = 200 um.
Figure 4 shows in vivo results of vis-OCT oximetry. An OCT fundus image is displayed in gray scale [Fig. 4(a)] in inversed contrast. The bright blood vessel structure corresponds to the strong optical attenuation in blood. As a comparison, we sectioned the 3D OCT volume from depth range 160–250 μm (correspond to the IS/OS junction to the RPE layer) and projected the mean intensity. As a result, the contrast from the microvasculature was enhanced [Fig. 4(b)]. Also, mean sO2 values in major vessels were quantified and the pseudocolor map of sO2 was overlaid in Fig. 4(b). We further used a circular scanning pattern around the optic disk [the circle in Fig. 4(a)] with 4096 A-lines, so that all the major vessels could be sampled. We expanded the circular scan into a B-scan image [Fig. 4(c)] where the vessel index corresponds to the numbers in Fig. 4(a). The values of sO2 in individual vessels are given in Fig. 4(d) with red and blue color labeling arteries and veins. On average, sO2 from arteries and veins were 95 ± 3% and 72 ± 7%, respectively. The standard deviation from the veins was higher than for arteries, which was mostly caused by the flatter spectrum of μ. The alternating artery and vein pattern can be confirmed by the size of the vessels (i.e., arteries have smaller diameter than veins due to their contractility).
The algorithm and model proposed herein are based on the fact that the bottom blood vessel wall can be imaged with a high signal-to-noise ratio (SNR). In the current work, we can achieve sufficient SNR for sO2 calculation in vessels with diameters between 30 and 130 μm. It can be challenging in larger vessels because light is strongly attenuated due to longer optical path length and therefore little can be reflected from the bottom vessel wall. In this case, the backscattering from red blood cells within vessels carries the optical absorption information and can potentially be analyzed with different models. On the other hand, the quantification of capillaries of sizes close to 10 μm is challenging due to low optical absorption. A much denser spatial sampling over small vessels may be needed.
In the future, we intend to implement vis-OCT on a fiber-based system. Also, the temporal stability of the supercontinnum source can be improved so that more localized sO2 measurement can be realized. Furthermore animal and human applications on quantifying sO2 in various retinal diseases are of great interest.
Acknowledgments
The authors acknowledge the financial support from National Institutes of Health grants R01CA128641 and R01EB003682 to V. Backman, and RC4EY021357 and R01EY019951 to H. F. Zhang; and National Science Foundation grant CBET-1240416 to V. Backman, and CBET-1055379 and CBET-1066776 to H. F. Zhang.
References
- 1.Harris A, Dinn RB, Kagemann L, Rechtman E. Ophthalmic Surg. Lasers Imaging. 2003;34:152. [PubMed] [Google Scholar]
- 2.Zhang HF, Maslov K, Stoica G, Wang LV. Nat. Biotechnol. 2006;24:848. doi: 10.1038/nbt1220. [DOI] [PubMed] [Google Scholar]
- 3.Kagemann L, Wollstein G, Wojtkowski M, Ishikawa H, Townsend KA, Gabriele ML, Srinivasan VJ, Fujimoto JG, Schuman JS. J. Biomed. Opt. 2007;12:041212. doi: 10.1117/1.2772655. [DOI] [PMC free article] [PubMed] [Google Scholar]
- 4.Lu C-W, Lee C-K, Tsai M-T, Wang Y-M, Yang CC. Opt. Lett. 2008;33:416. doi: 10.1364/ol.33.000416. [DOI] [PubMed] [Google Scholar]
- 5.Faber DJ, Mik EG, Aalders MCG, van Leeuwen TG. Opt. Lett. 2005;30:1015. doi: 10.1364/ol.30.001015. [DOI] [PubMed] [Google Scholar]
- 6.Robles FE, Chowdhury S, Wax A. Biomed. Opt. Express. 2010;1:310. doi: 10.1364/boe.1.000310/. [DOI] [PMC free article] [PubMed] [Google Scholar]
- 7.Robles FE, Wilson C, Grant G, Wax A. Nat. Photonics. 2011;5:744. doi: 10.1038/nphoton.2011.257. [DOI] [PMC free article] [PubMed] [Google Scholar]
- 8.Yi J, Li X. Opt. Lett. 2010;35:2094. doi: 10.1364/OL.35.002094. [DOI] [PubMed] [Google Scholar]
- 9.Faber DJ, Aalders MCG, Mik EG, Hooper BA, van Gemert MJC, van Leeuwen TG. Phys. Rev. Lett. 2004;93:028102. doi: 10.1103/PhysRevLett.93.028102. [DOI] [PubMed] [Google Scholar]
- 10.Leitgeb R, Wojtkowski M, Kowalczyk A, Hitzenberger C, Sticker M, Fercher A. Opt. Lett. 2000;25:820. doi: 10.1364/ol.25.000820. [DOI] [PubMed] [Google Scholar]
- 11.Wu TT, Qu JY, Xu M. Opt. Lett. 2007;32:2324. doi: 10.1364/ol.32.002324. [DOI] [PubMed] [Google Scholar]
- 12.Yi J, Backman V. Opt. Lett. 2012;37:4443. doi: 10.1364/OL.37.004443. [DOI] [PMC free article] [PubMed] [Google Scholar]
- 13.Twersky V. J. Opt. Soc. Am. 1970;60:1084. doi: 10.1364/josa.60.001084. [DOI] [PubMed] [Google Scholar]
- 14.Schmitt JM, Kumar G. Appl. Opt. 1998;37:2788. doi: 10.1364/ao.37.002788. [DOI] [PubMed] [Google Scholar]


