

Abstract
Alzheimer’s disease (AD) is the most common neurodegenerative disorder characterized by the presence of extracellular plaques of β-amyloid peptides and intracellular tangles of hyperphosphorylated tau proteins in the brain. The vast majority of cases are late onset AD (LOAD), which are genetically heterogeneous and occur sporadically. High blood cholesterol is suggested to be a risk factor for this disease. Several neuropathological changes of LOAD can be reproduced by supplementing a rabbit’s diet with 2% cholesterol for 12 weeks. Accumulating data in the literature suggest that microRNAs (miRNA) participate in the development of AD pathology. The present study focuses on the survey of changes of miRNA expression in rabbit brains during the progression of AD-like pathology using microarray followed by Taq-Man qRT-PCR analyses. Out of 1769 miRNA probes used in the experiments, 99 miRNAs were found to be present in rabbit brain, 57 were newly identified as miRNAs from rabbit brain. Eleven miRNAs showed significant changes over AD-like pathology progression. Among them, the changes of miR-125b, miR-98, miR-107, miR-30, along with 3 members of the let-7 family were similar to those observed in human AD samples, whereas the expression patterns of miR-15a, miR-26b, miR-9 and miR-576-3p were unique to this rabbit LOAD model. The significant up regulation of miR-26b is consistent with the decrease of leptin levels in the brains of cholesterol fed rabbit model for AD, confirming that miR-26b is indeed regulated by leptin and that both leptin and miR-26b may be involved in cholesterol induced AD-like pathology.
Keywords: Alzheimer’s disease, rabbit AD model, MicroRNA, Let-7, miR-26b, leptin
Introduction
Alzheimer’s disease (AD) is a progressive neurodegenerative disorder that manifests clinical symptoms of cognitive impairment and dementia. Pathologically, AD is characterized by the accumulation of extracellular β-amyloid plaques, composed of Aβ peptide, and intracellular neurofibrillary tangles, containing aggregated and hyperphosphorylated Tau protein [1]. Early onset Alzheimer’s disease, also known as familial AD (FAD) can be triggered by genetic factors such as mutations on three different genes APP, PSEN 1 and PSEN 2 [2]. However 90-95% of the cases are late onset Alzheimer’s disease (LOAD), which are genetically heterogeneous and occur sporadically [3]. Much of our understanding of disease progression of AD has been driven by studies of animal models, which enable controlled studies of physiopathology and biomarker identification, as well as allow for the differentiation between causes and consequences. For many years, transgenic rodents have been used as the main model for AD in pre-clinical studies; however, their lack of correct APP protein sequence and the cleavage enzymes to trigger the formation of Aβ peptide render them unsuitable as natural models for LOAD. Recent clinical trials in human seem to imply that Aβ-dependent signalling pathways are insufficient to cause the severe neurodegeneration and dementia seen in AD patients [4-6]. Since altered cholesterol metabolism has been linked to increased Aβ production and AD pathogenesis and hypercholesterolemia is an early risk factor for AD [7-10], rabbits fed a cholesterol-enriched diet have been employed to model LOAD. Rabbits naturally produce cleavage enzymes for Aβ peptide and the rabbit Aβ peptide sequence is identical to human. Studies by several groups demonstrate that when rabbits are fed a diet supplemented with 2% cholesterol alone, or 1% cholesterol plus trace amounts of copper in drinking water, they develop full-blown AD pathology. This includes cortical Aβ deposits and tangles, and up to twelve other pathological markers also seen in human AD brains [11-16].
MicroRNAs (miRNAs) are small non-coding functional RNAs of approximately 22 nucleotides that down-regulate gene expression post-transcriptionally [17]. This is achieved by inhibiting translation initiation or degradation of their respective mRNA via the binding of the miRNAs to the 3’ untranslated region (UTR) of their target genes [18]. The interaction between a miRNA and its target mRNA does not require perfect sequence complementarity. Therefore, a single miRNA has the potential to regulate many mRNAs and one mRNA can be regulated by numerous miRNAs [19]. It is estimated that 30 to 60% of all protein coding genes can be regulated by miRNAs, depending on the developmental, cellular and physiological context [20,21]. Approximately 70% of presently identified miRNAs are expressed in the brain in a spatially and temporally controlled manner [22].
In the past few years a number of published reports have linked aberrant expression and dysfunction of brain enriched miRNAs to the development of neurodegenerative diseases, such as Alzheimer’s disease and Parkinson’s disease [23,24]. While some miRNA profiling experiments have shown a trend towards the identification of AD or neurodegenerative disease-signature miRNA set, others demonstrate that aberrant regulation of miRNA-dependent gene expression is involved in molecular events responsible for Aβ production [24-26]. Global miRNA profiling was performed on AD transgenic mice and mouse hippocampal neurons treated with Aβ peptide [27,28]. These studies found several dysregulated miRNAs were similarly shown to be affected in human AD brains, suggesting that miRNA changes equally occur in transgenic AD disease models, yet some miRNA changes are also specific to these mouse paradigms [29]. In the present study, we aimed to identify aberrant expression of microRNAs during the progression of Alzheimer’s disease in this rabbit LOAD model. The miRNA microarray analyses and subsequent qRT-PCR experiments were performed on small brain RNA samples from control and cholesterol treated rabbits. Data analysis revealed that 11 microRNAs showed differential expression between the control and the cholesterol-treated group during the 12 week period and 5 changed miRNAs appeared to be unique to this LOAD model.
Materials and methods
Experimental animals and laboratory procedures
Male New Zealand white rabbits were used in this study (2 year old, weighing 3-4 kg). Animals were randomly assigned to two different groups. Group 1 was fed normal chow. Group 2 was fed chow supplemented with 2% cholesterol (Harlan Teklad Global Diets, Madison, WI). Diets were kept frozen at -10°C to reduce the risk of oxidation. The animals were allowed water filtered through activated carbon filters. One control and two cholesterol-treated rabbits were euthanized with ear intravenous injection of euthasol at 2, 4, 6, 8, 10 or 12 weeks of diet regiments. At necropsy, animals were perfused with Dulbecco’s phosphate-buffered saline at 37°C and the brains were promptly removed. Frontal Cortex tissue was then dissected for further analysis. All animal procedures were carried out in accordance with the U.S. Public Health Service Policy on the Humane Care and Use of Laboratory Animals and were approved by the Institutional Animal Care and Use Committee at the University of North Dakota.
Microarray production
The miRCURY LNATM microRNA probe set, version 11, containing 1769 ready-to-spot human, mouse & rat probe and 10 different spike-in microRNAs (Exiqon, Denmark) were printed onto epoxysilane coated Nexterion® slide E (Schott North America, KY, USA) using a Nano-Plotter (NP2.1, GeSiM, Germany). The LNATM probes were resuspended in 2X Nexterion spotting buffer, spotted at 8 ± 2°C and a relative humidity of 50%. After printing, the slides were left in the printer for 2 hours. The slides were then incubated at 42°C and 50% humidity for overnight before storage in a desiccator until use. The spotted probe set on the slide was verified by hybridizing a sample slide with Cy3-9mer (QIAGEN, Valencia, CA). Missing or low density spots, due to low probe concentration were flagged.
MicroRNA microarray analysis
Small RNA isolation was performed after the extraction of the total RNA from 18 frontal cortex samples. This was carried out using the mirVana™ miRNA Isolation Kit according to the manufacturer’s instruction (Ambion, TX, USA). The quality of large and small RNAs was verified by electrophoresis with 15% acrylamide gel. Extracted small RNAs (250 ng per sample) from control or cholesterol treated rabbit brains were labeled with Cy3 or Cy5 fluorescent dye using Flashtag RNA labeling kit (Genisphere, PA, USA). The Cy3 and Cy5 labeled samples were mixed pair-wise and hybridized to the miRCURY™ LNA arrays in a manner that results in an equal number of data set for each dye and each sample. A total of 36 different microarrays were performed for this experiment (Table 1). The hybridization was performed using a SlideBooster SB400 hybridization station at 56°C. The slides were washed twice in 2X SSC/0.2% SDS/0.1 mM DTT buffer at 56°C for 5 min, twice in 1X SSC/0.1 mM DTT at room temperature for 2 min, followed by a final wash in 0.1X SSC at room temperature for 2 min. The slides were then scanned for the fluorescence intensities using a GenePix 4200A Scanner.
Table 1.
Experimental design for two-colour microarray experiment
| Control vs. Treated group 1 | Control vs. Treated group 2 | ||
|---|---|---|---|
|
| |||
| Cy3 | Cy5 | Cy3 | Cy5 |
| T2 | C2 | T12 | C6 |
| T2 | C4 | T12 | C1 |
| C2 | T4 | C2 | T1 |
| T4 | C4 | T10 | C1 |
| T4 | C6 | T10 | C2 |
| C4 | T6 | C4 | T6 |
| T6 | C6 | T8 | C2 |
| T6 | C8 | T8 | C3 |
| C6 | T8 | C6 | T5 |
| T8 | C8 | T6 | C3 |
| T8 | C10 | T6 | C4 |
| C8 | T10 | C8 | T4 |
| T10 | C10 | T4 | C4 |
| T10 | C12 | T4 | C5 |
| C10 | T12 | C10 | T3 |
| T12 | C12 | T2 | C5 |
| T12 | C2 | T2 | C6 |
| C12 | T2 | C12 | T2 |
C corresponds to the control group. T represents the treated groups. The number next to C and T corresponds to the weeks of cholesterol treatment.
Data analysis and normalization
Data extraction and image analysis were performed using GenePix Pro software (Axon Instruments, Molecular Devices Corp. USA). The resulting data was processed by applying a local background subtraction. Only Cy3-labelled data were used for further analysis (Cy5-labelled data was not used due to low dye intensity). Replicate spots from the same array, from the control groups and from the two different treated groups of the same week of cholesterol treatments were averaged. For a microRNA to be considered as present in rabbit brain, the following criteria need to be fulfilled: the signal to noise ratio needed to be more than 2 and 60% of the pixels of the spot intensity had to be higher than 2 standard deviations above background. It also required 12 or more readings from the 108 data points. A list of microRNAs showing significant differences between control and treated group after cholesterol treatment were collected after normalization with an algorithm called Cyclic Loess using the Limma package in Bioconductor. The default parameters were used during this normalization. A p value of less than 0.05 and a minimum intensity threshold requirement of 8 (from a 16 pixels scanning) for at least one data point were used to generate such a list.
Quantitative RT-PCR
The RT-PCR experiments were performed on miRNA samples at 4 week-intervals during the time course, consisting of the existing two samples for each time point used from the microarray experiments and three additional control and cholesterol treated samples for each time point, except the 8 week cholesterol treatment (with 2 left, one 8 week animal died during treatment). Small RNA samples (10 ng) were converted to single strand cDNA using TaqMan microRNA reverse transcription kit according to manufacturer’s instructions (Life Technologies, Carlsbad, CA). Real time PCR amplifications of miRNAs were accomplished by using TaqMan 2X universal PCR master mix and Applied Biosystems 7500 fast real-time PCR system (Applied Biosystems Inc. Foster City, CA). Three separate qRT-PCR runs with three replicate on each sample were performed and the ploted data represent averaged values of the qRT-PCR readouts. The control and selected microRNA assays and related reagents were from Life Technologies. U47 and U48 snRNAs were used to normalize miRNA expression.
Results
Novel microRNAs in rabbit brain
Since miRNAs are highly conserved not only in phylogenetically related species but also among distanced species [30,31], we were able to use the probe set from human, rats and mice to analyze the expression of miRNAs in rabbit brain. Although rabbits (Oryctolagus cuniculus) are widely used in medical research and safety test of consumer products because of its genetics and physiological similarity to human, its miRNA repertoire is still absent in miRBase. Therefore, our first task was to use the data from the microarray analysis to identify the microRNAs found in the rabbit brain. For a miRNA to be listed as detectable in rabbit brain, it must meet the following criteria: 1). signal to noise ratio must be higher than 2, 2). at least 60% of the pixels intensity had to be greater than 2 standard deviations above background, 3). it also required 12 or more valid readings from all data points. Following the application of these criteria, a total of 99 microRNAs were identified (Table 2). After comparing the 99 microRNAs from the present study with the microRNAs reported to be found in rabbit brain by Li et al. [30] and Liu et al. [31], 57 microRNAs were identified as novel microRNAs present in rabbit brain (Table 3). Several miRNAs, miR146a, mir146b, miR101, miR106 and miR107 that were detected in rabbit brain previously [31] did not show any signals passed the selection criteria in our experiments, due to low oligo concentration of these spots on the slides, which were flagged by quality control test.
Table 2.
MiRNAs in rabbit brain found during the present study
| Species | microRNA |
|---|---|
| Homo sapiens | miR-1246 |
| Homo sapiens | miR-1826 |
| Mus musculus / Rattus norvegicus | let-7a |
| Homo sapiens / Mus musculus / Rattus norvegicus | let-7f |
| Homo sapiens / Mus musculus / Rattus norvegicus | miR-9 |
| Homo sapiens / Mus musculus | miR-34b |
| Homo sapiens | let-7a |
| Homo sapiens / Mus musculus / Rattus norvegicus | let-7c |
| Homo sapiens / Mus musculus / Rattus norvegicus | let-7b |
| Homo sapiens / Mus musculus / Rattus norvegicus | let-7d |
| Homo sapiens / Mus musculus / Rattus norvegicus | miR-26b |
| Homo sapiens | miR-665 |
| Mus musculus | miR-883a-5p |
| Homo sapiens / Mus musculus / Rattus norvegicus | miR-124 |
| Homo sapiens / Mus musculus / Rattus norvegicus | let-7e |
| Homo sapiens | miR-1255a |
| Mus musculus | miR-883b-5p |
| Homo sapiens / Mus musculus | miR-668 |
| Homo sapiens / Mus musculus / Rattus norvegicus | miR-24-1* |
| Homo sapiens | miR-923 |
| Mus musculus | miR-503* |
| Homo sapiens | miR-1827 |
| Homo sapiens / Mus musculus / Rattus norvegicus | miR-128 |
| Mus musculus / Rattus norvegicus | miR-672 |
| Homo sapiens / Mus musculus / Rattus norvegicus | miR-26a |
| Homo sapiens / Mus musculus / Rattus norvegicus | miR-125b-5p |
| Homo sapiens | miR-888* |
| Homo sapiens | miR-939 |
| Homo sapiens | miR-933 |
| Homo sapiens / Mus musculus / Rattus norvegicus | miR-370 |
| Homo sapiens / Mus musculus | let-7g |
| Mus musculus | miR-715 |
| Homo sapiens | miR-630 |
| Mus musculus / Rattus norvegicus | miR-325 |
| Homo sapiens / Mus musculus / Rattus norvegicus | miR-126 |
| Homo sapiens | miR-549 |
| Homo sapiens / Mus musculus / Rattus norvegicus | miR-98 |
| Homo sapiens | miR-576-3p |
| Homo sapiens | miR-1236 |
| Homo sapiens / Mus musculus / Rattus norvegicus | miR-29a |
| Homo sapiens / Mus musculus / Rattus norvegicus | miR-130b |
| Homo sapiens / Rattus norvegicus | miR-363* |
| Homo sapiens / Mus musculus / Rattus norvegicus | miR-423-3p |
| Homo sapiens / Mus musculus / Rattus norvegicus | let-7i |
| Homo sapiens | miR-1259 |
| Homo sapiens | miR-638 |
| Homo sapiens | miR-23b |
| Homo sapiens | miR-1249 |
| Homo sapiens / Mus musculus / Rattus norvegicus | miR-24 |
| Homo sapiens | miR-1264 |
| Homo sapiens | miR-432 |
| Homo sapiens / Mus musculus / Rattus norvegicus | miR-21 |
| Homo sapiens / Mus musculus / Rattus norvegicus | miR-296* |
| Homo sapiens | miR-519d |
| Homo sapiens | miR-1308 |
| Homo sapiens | miR-935 |
| Homo sapiens | miR-1290 |
| Homo sapiens | miR-1237 |
| Homo sapiens / Mus musculus / Rattus norvegicus | miR-299 |
| Homo sapiens | miR-32* |
| Mus musculus | miR-712* |
| Homo sapiens | miR-518b |
| Homo sapiens / Mus musculus / Rattus norvegicus | miR-138 |
| Homo sapiens / Mus musculus / Rattus norvegicus | miR-138* |
| Homo sapiens / Mus musculus / Rattus norvegicus | miR-204 |
| Mus musculus / Rattus norvegicus | miR-322 |
| Homo sapiens | miR-943 |
| Homo sapiens | miR-625* |
| Mus musculus | miR-547 |
| Homo sapiens / Mus musculus / Rattus norvegicus | miR-129 |
| Homo sapiens | miR-1227 |
| Homo sapiens / Mus musculus | miR-615-5p |
| Mus musculus / Rattus norvegicus | miR-23b |
| Homo sapiens | miR-765 |
| Homo sapiens | miR-576-5p |
| Homo sapiens | miR-582-5p |
| Mus musculus | miR-327 |
| Mus musculus / Rattus norvegicus | miR-483 |
| Homo sapiens | miR-885-5p |
| Mus musculus | miR-466d-5p |
| Homo sapiens / Mus musculus / Rattus norvegicus | miR-223 |
| Homo sapiens / Mus musculus / Rattus norvegicus | miR-218 |
| Mus musculus | miR-294 |
| Homo sapiens | miR-636 |
| Homo sapiens / Mus musculus / Rattus norvegicus | miR-365 |
| Homo sapiens / Mus musculus | miR-15a |
| Homo sapiens | miR-550 |
| Homo sapiens | miR-1281 |
| Homo sapiens / Mus musculus / Rattus norvegicus | miR-30c |
| Homo sapiens / Mus musculus / Rattus norvegicus | miR-7a |
| Homo sapiens | miR-664 |
| Mus musculus | miR-698 |
| Homo sapiens / Mus musculus / Rattus norvegicus | miR-361 |
| Homo sapiens | miR-483-3p |
| Homo sapiens | miR-1248 |
| Homo sapiens | miR-18b* |
| Homo sapiens | miR-486-5p |
| Homo sapiens / Mus musculus / Rattus norvegicus | miR-34a |
| Homo sapiens | miR-223* |
Table 3.
Newly identified miRNAs in rabbit brain
| Species | miRNA |
|---|---|
| Homo sapiens | mir-1246 |
| Homo sapiens | mir-1826 |
| Homo sapiens / Mus musculus / Rattus norvegicus | mir-9 |
| Homo sapiens | mir-665 |
| Mus musculus | mir-883a-5p |
| Homo sapiens | mir-1255a |
| Mus musculus | mir-883b-5p |
| Homo sapiens / Mus musculus | mir-668 |
| Homo sapiens | mir-923 |
| Homo sapiens | mir-1827 |
| Homo sapiens | mir-888* |
| Homo sapiens | mir-939 |
| Homo sapiens | mir-933 |
| Homo sapiens / Mus musculus / Rattus norvegicus | mir-370 |
| Homo sapiens / Mus musculus | let-7g |
| Mus musculus | mir-715 |
| Homo sapiens | mir-630 |
| Mus musculus / Rattus norvegicus | mir-325 |
| Homo sapiens | mir-549 |
| Homo sapiens | mir-576-3p |
| Homo sapiens | mir-1236 |
| Homo sapiens / Mus musculus / Rattus norvegicus | let-7i |
| Homo sapiens | mir-1259 |
| Homo sapiens | mir-638 |
| Homo sapiens | mir-23b |
| Homo sapiens | mir-1249 |
| Homo sapiens | mir-1264 |
| Homo sapiens | mir-519d |
| Homo sapiens | mir-1308 |
| Homo sapiens | mir-935 |
| Homo sapiens | mir-1290 |
| Homo sapiens | mir-1237 |
| Mus musculus | mir-712* |
| Homo sapiens | mir-518b |
| Mus musculus / Rattus norvegicus | mir-322 |
| Homo sapiens | mir-943 |
| Homo sapiens | mir-625* |
| Mus musculus | mir-547 |
| Homo sapiens | mir-1227 |
| Homo sapiens / Mus musculus | mir-615-5p |
| Mus musculus / Rattus norvegicus | mir-23b |
| Homo sapiens | mir-765 |
| Homo sapiens | mir-576-5p |
| Homo sapiens | mir-582-5p |
| Mus musculus | mir-327 |
| Mus musculus / Rattus norvegicus | mir-483 |
| Homo sapiens | mir-885-5p |
| Homo sapiens / Mus musculus / Rattus norvegicus | mir-223 |
| Homo sapiens | mir-636 |
| Homo sapiens | mir-550 |
| Homo sapiens | mir-1281 |
| Homo sapiens | mir-664 |
| Mus musculus | mir-698 |
| Homo sapiens | mir-483-3p |
| Homo sapiens | mir-1248 |
| Homo sapiens | mir-486-5p |
| Homo sapiens | mir-223* |
After comparing the miRNAs found in our study with the miRNAs previously reported in the rabbit brain (Li 2010, Liu 2010), 57 novel miRNAs were identified.
MicroRNAs expression profile during the time course of Alzheimer’s disease progression defined by microarray analysis
In order to identify differentially expressed microRNAs during the progression of Alzheimer’s disease, we examined the expression profiles of miRNA at two-week intervals during the course (spanning 12 weeks) of the cholesterol treatment. Data analysis revealed that 21 microRNAs showed changes in expression between the control and the treated groups. These results are represented as a heatmap of the log2 ratio of the treated versus the control group (Figure 1). Seven miRNAs showed trend of upregulation. Among them, three miRNAs from the let-7 family were notably upregulated after 8 weeks of cholesterol treatment. Six miRNAs appeared to have bi-phasic changes in expression; decreased in earlier time points, but become upregulated in 8 and 12 week samples. Five miRNAs were down regulated in most treated samples; all of them were significantly decreased in 12 week cholesterol treated samples, when the AD pathology and neurodegeneration had become apparent [11-15]. Three miRNAs showed up and down variations throughout the cholesterol treatment. We were not certain whether these changes were random animal variations or bona fide differences, thus decided to include them in the heatmap, pending Q-PCR verification.
Figure 1.

Heatmap of expression profile of miRNAs in rabbit brain during the progression of Alzheimer’s disease. After feeding rabbits with diets supplemented with 2% cholesterol over a period of 12 weeks, small RNAs were extracted from their cortex and studied by microarray analysis. Up regulated microRNAs are shown in red and down regulated miRNAs are shown in green. The different intensities of the colours are proportional to the log2 of the ratio of the miRNAs between the treated and control samples. The column labeled C represents the average of all the control samples. The columns labeled T represent the average of the two treated samples. The number next to T corresponds to the weeks of treatment. 21 miRNAs showed changes in expression between the control and the treated groups. >1 is more than 2 fold up, <-1 is more than 2 fold down relative to control. The control is 0 in all cases.
Quantitative RT-PCR validation of candidate miRNAs
The expression levels of all 21 changed miRNAs, putatively identified by microarray experiments, were verified by TaqMan based quantitative RT-PCR (qRT-PCR) analysis using pre-designed TaqMan microRNA assays that are universal to human, rat and mouse. Of all the miRNAs tested by qRT-PCR, assay mixture for miR-1827, miR-519d and miR363* did not produce any amplification product. This is likely due to base pair mismatches between the rabbit miRNAs and those of human/rat/mouse. MiR-128, miR-124, miR-138, miR-204, miR935, miR-26a and miR-130b did not show significant changes. The qRT-PCR results of miR-1246 had large variation among animals in the same treatment group, which make the interpretation of the results impossible. Six miRNAs were confirmed to be genuinely upregulated. MiR-125b, let-7a and miR-98 were upregulated 12 weeks after cholesterol treatment (Figure 2A-C), while let-7e and miR-30C showed up regulation in both 8 and 12 weeks samples (Figure 2D and 2E). Let-7b however, started to increase as early as 4 weeks after treatment, agreeing with the microarray results (Figure 2F). In the group of miRNAs showed bi-phasic expression pattern by microarray analysis, miR-9, miR-15a and miR-26b were confirmed to first decrease in the 4 weeks treated samples and then became upregulated in 12 week treated samples (Figure 3A-C). One miRNA, miR-576-3p was confirmed to be gradually down regulated starting 4 weeks after cholesterol treatment (Figure 4A). Previous reports indicate that miR-146b and miR-107 are down regulated in human AD brains and the decrease of miR-107 may accelerate disease progression through regulation of BACE1 [26,32]. Unfortunately the microarray hybridization signals for these miRNAs were not reliable due to poor spotting qualities. We therefore used TaqMan qRT-PCR assays to assess the expression levels of these miRNAs in our rabbit model. Our results showed that miR-146b did not change its expression level significantly, whereas miR-107 did show a gradual decrease from 4 to 12 weeks after treatment (Figure 4B).
Figure 2.

q-RT-PCR results of miRNAs up regulated after cholesterol treatment. miRNAs were extracted from the cortex of control and cholesterol treated rabbits. The Taq-Man qRT-PCR experiments were performed on miRNA samples at 4 week-intervals during the time course (n=4 for 8 week cholesterol treated and n=5 for all other time points). Each treated group was measured against the control group, set at 100%. Percentage of each treated group was calculated by mean 100x 2-ΔCt, where ΔCt is the cycle number difference between treated group and the control group. The qRT-PCR experiments were performed in triplicate for each sample. Asterisks indicate a significant difference (** - p<0.01, * - p<0.05). A. qRT-PCR results of miR-125b-5p. B. qRT-PCR results of let-7a. C. qRT-PCR results of miR-98. D. qRT-PCR results of miR-30c. E. qRT-PCR results of let-7e. F. qRT-PCR results of let-7b.
Figure 3.

q-RT-PCR results of miRNAs showed bi-phasic changes after cholesterol treatment. miRNAs were extracted from the cortex of control and cholesterol treated rabbits. The Taq-Man qRT-PCR experiments were performed on miRNA samples at 4 week-intervals during the time course (n=4 for 8 week cholesterol treated and n=5 for all other time points). Each treated group was measured against the control group, set at 100%. Percentage of each treated group was calculated by mean 100x 2-ΔCt, where ΔCt is the cycle number difference between treated group and the control group. The qRT-PCR experiments were performed in triplicate for each sample. Asterisks indicate a significant difference (** - p<0.01, * - p<0.05). A. qRT-PCR results of miR-9. B. qRT-PCR results of 15a. C. qRT-PCR results of miR-26b.
Figure 4.
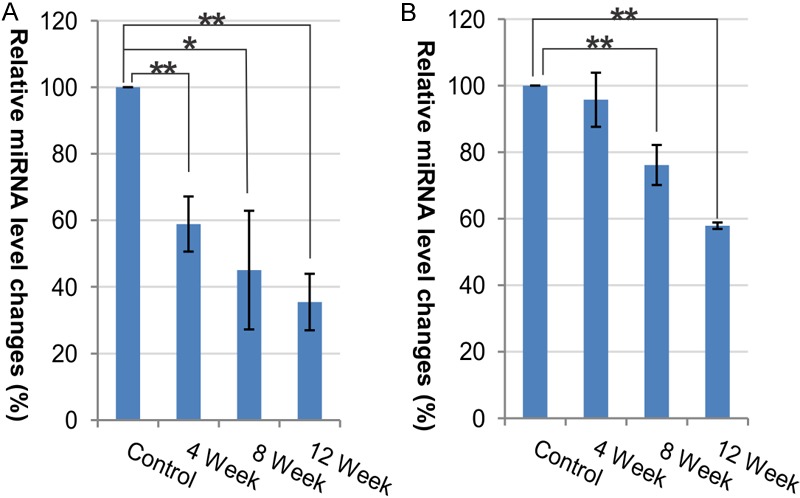
q-RT-PCR results of miRNAs down regulated after cholesterol treatment. miRNAs were extracted from the cortex of control and cholesterol treated rabbits. The Taq-Man qRT-PCR experiments were performed on miRNA samples at 4 week-intervals during the time course (n=4 for 8 week cholesterol treated and n=5 for all other time points). Each treated group was measured against the control group, set at 100%. Percentage of each treated group was calculated by mean 100x 2-ΔCt, where ΔCt is the cycle number difference between treated group and the control group. The qRT-PCR experiments were performed in triplicate for each sample. Asterisks indicate a significant difference (** - p<0.01, * - p<0.05). A. qRT-PCR results of miR-576-3p. B. qRT-PCR results of miR-107.
Discussions
MiRNAs suppress gene expression by selectively binding to the 3’ non-coding region of specific mRNAs through base-pairing. As a result, miRNAs play an important role in the regulation of a significant part of the transcriptome by targeting mRNAs encoding signaling proteins, enzymes and transcription factors. In order to identify critical factors and pathways playing roles during AD-like pathology development in the rabbit LOAD model, our group is in the process of developing a rabbit-specific oligo nucleotide DNA microarray for the profiling of the time-course cholesterol treated rabbit brain tissues. While this study is still ongoing, we decided to take advantage of the evolutionarily conserved characteristics of miRNA by using existing human, rat and mouse miRNA-LNA probe set to profile for the changes of miRNA expression in this rabbit LOAD model. It is hoped that the identification of differentially expressed miRNAs from the same tissue samples will help us discover deferentially expressed target mRNAs regulated by these miRNAs.
In this study, we found 99 miRNAs in the rabbit brains hybridized with the LNA probe set. Among them, there are a number of known brain-expressed miRNAs, such as, miR-30c, miR-124, various let-7s, miR-125b, miR-21, miR-24, miR-26a, etc [31]. We found 57 new miRNAs have never been reported previously in rabbits. After further validation of our results by RT-PCR and sequencing of the miRNAs generated in this study, a total of 99 miRNAs can be deposited into the miRBase as miRNAs from rabbit brain, which will benefit future miRNA studies.
The present study demonstrated that 11 miRNA changed their expression levels during the course of LOAD development. Some of them were known to be involved in human AD; other miRNAs have been newly identified in this rabbit model by our study. Our results are consistent with previous reports that miR-98, Let-7e and b were upregulated in AD mouse model and miR-30C and 125b were similarly shown to be affected in human AD brains [32,33]. The expression levels of Let-7e and miR-125b were shown to be positively correlated to neurofibrillary tangle counts [33]. However, the expression patterns of miR-9, miR-15a and miR-26b were unique to this LOAD model, where they were first slightly down regulated and became markedly up regulated at the end point (12 week cholesterol treatment). In human AD brains, miR-9 was reported up [34] or down [32,35], whereas miR-15a and miR-26b were only reported to be down regulated in human AD Brain. One possibility for this discrepancy is that the present study includes a wide time-course of AD progression, the chosen time points may not match the disease stages of those AD patients used in previous studies. MiR-106b, previously shown to be down-regulated in human AD brains [32], did not change in the rabbit brains throughout the course of the cholesterol treatment, whereas miR-576-3p was found to be specifically down regulated during the progression of AD in our rabbit models, suggesting the existence of distinct pathophysiology in this LOAD model.
The gradual down regulation of miR-107 throughout the time course is particularly interesting, because not only is miR-107 also decreased in human AD and AD Tg mice brains, playing a role in cytoskeletal pathology in AD [36,37], but also predicted to play a role in the regulation of acetyl-CoA and lipid metabolism [38]. Although miR-107 is located within the intron of the pantothenate kinase 1 gene (PANK1), miR-107/PANK1 levels have not been correlated. It is therefore tempting to speculate that the gradual down regulation of miR-107 in the rabbit brain is triggered by the high cholesterol diet. It would be interesting to investigate whether miR-107 down regulation is linked to historical high blood cholesterol levels and ApoE alleles in AD patients. Similarly, miR-26b has been linked to obesity-related inflammation responses and insulin resistance [39]. Leptin, an adipocytokine involved in cell survival and learning has been reported to negatively regulate miR-26b expression [39]. Furthermore, our previous study on leptin in the rabbit LOAD model demonstrated that cholesterol metabolism and leptin are tightly associated [40]. High cholesterol diet and cholesterol metabolite, oxysterol 27-OHC, reduce leptin expression levels and treatment with leptin reverses the increase in Aβ and phosphorylated tau levels. Our present result of marked upregulation of miR-26b is consistent with our previous data on 12 week cholesterol treated rabbits, where the levels of leptin are reduced by approximately 80%; here, miR-26b is up regulated by nearly 77%.
In a recent report, Chen and colleagues demonstrated that mir-107 modulates the stability of let-7 family by binding to the conserved internal loop region sequence, leading to the let-7 miRNA degradation [41]. Mir-107 promotes tumor progression by targeting the let-7 miRNAs in mice and human. In the present study, we found the members of let-7 family up regulated in rabbits fed with high cholesterol diet. The expression patterns of Let-7b and 7e appeared in opposite trends as that of miR-107, and let-7a is also up regulated in 12 week cholesterol treated rabbits. It is conceivable that the accumulation of the let-7 family members are at least in part due to decreased levels of miR-107 in this rabbit LOAD model.
In conclusions, we have identified 11 microRNAs differentially expressed the cholesterol treated rabbit brains. Among them, 6 miRNAs were also previously reported to be involved in Alzheimer’s disease, suggesting that there exist similar pathological mechanisms between this rabbit LOAD model and human AD development. Five changed miRNAs were unique to this model. The most intriguing finding is the changes of miR-26b, whose up regulation is completely consistent with the decrease of leptin levels in the cholesterol treated rabbit brain. This result confirms that miR-26b is indeed regulated by leptin and both may be involved in cholesterol induced AD-like pathology. Future work on target identification of these unique miRNAs will help understand molecular mechanisms of cholesterol related AD development.
Acknowledgements
This work was supported in part by grant to OG from the NCRR (P20RR017699), a component of the NIH. The authors would like to thank Christian Luebbert for his technical assistance on microarray production, Dr. Jaya Prasanthi for sample handling.
References
- 1.Taylor JP, Hardy J, Fischbeck KH. Toxic proteins in neurodegenerative disease. Science. 2002;296:1991–1995. doi: 10.1126/science.1067122. [DOI] [PubMed] [Google Scholar]
- 2.St George-Hyslop PH. Molecular genetics of Alzheimer disease. Semin Neurol. 1999;19:371–383. doi: 10.1055/s-2008-1040852. [DOI] [PubMed] [Google Scholar]
- 3.Selkoe DJ. Alzheimer’s disease: genes, proteins, and therapy. Physiol Rev. 2001;81:741–766. doi: 10.1152/physrev.2001.81.2.741. [DOI] [PubMed] [Google Scholar]
- 4.Fan LY, Chiu MJ. Pharmacological treatment for Alzheimer’s disease: current approaches and future strategies. Acta Neurol Taiwan. 2010;19:228–245. [PubMed] [Google Scholar]
- 5.Golde TE, Schneider LS, Koo EH. Anti-abeta therapeutics in Alzheimer’s disease: the need for a paradigm shift. Neuron. 2011;69:203–213. doi: 10.1016/j.neuron.2011.01.002. [DOI] [PMC free article] [PubMed] [Google Scholar]
- 6.Sambamurti K, Greig NH, Utsuki T, Barnwell EL, Sharma E, Mazell C, Bhat NR, Kindy MS, Lahiri DK, Pappolla MA. Targets for AD treatment: conflicting messages from gamma-secretase inhibitors. J Neurochem. 2011;117:359–374. doi: 10.1111/j.1471-4159.2011.07213.x. [DOI] [PMC free article] [PubMed] [Google Scholar]
- 7.Miller LJ, Chacko R. The role of cholesterol and statins in Alzheimer’s disease. Ann Pharmacother. 2004;38:91–98. doi: 10.1345/aph.1D104. [DOI] [PubMed] [Google Scholar]
- 8.Puglielli L, Tanzi RE, Kovacs DM. Alzheimer’s disease: the cholesterol connection. Nat Neurosci. 2003;6:345–351. doi: 10.1038/nn0403-345. [DOI] [PubMed] [Google Scholar]
- 9.Wolozin B. A fluid connection: cholesterol and Abeta. Proc Natl Acad Sci U S A. 2001;98:5371–5373. doi: 10.1073/pnas.101123198. [DOI] [PMC free article] [PubMed] [Google Scholar]
- 10.Wolozin B. Cholesterol and the biology of Alzheimer’s disease. Neuron. 2004;41:7–10. doi: 10.1016/s0896-6273(03)00840-7. [DOI] [PubMed] [Google Scholar]
- 11.Ghribi O, Golovko MY, Larsen B, Schrag M, Murphy EJ. Deposition of iron and beta-amyloid plaques is associated with cortical cellular damage in rabbits fed with long-term cholesterol-enriched diets. J Neurochem. 2006;99:438–449. doi: 10.1111/j.1471-4159.2006.04079.x. [DOI] [PubMed] [Google Scholar]
- 12.Ghribi O, Larsen B, Schrag M, Herman MM. High cholesterol content in neurons increases BACE, beta-amyloid, and phosphorylated tau levels in rabbit hippocampus. Exp Neurol. 2006;200:460–467. doi: 10.1016/j.expneurol.2006.03.019. [DOI] [PubMed] [Google Scholar]
- 13.Ghribi O. Potential mechanisms linking cholesterol to Alzheimer’s disease-like pathology in rabbit brain, hippocampal organotypic slices, and skeletal muscle. J Alzheimers Dis. 2008;15:673–684. doi: 10.3233/jad-2008-15412. [DOI] [PMC free article] [PubMed] [Google Scholar]
- 14.Sparks DL. The early and ongoing experience with the cholesterol-fed rabbit as a model of Alzheimer’s disease: the old, the new and the pilot. J Alzheimers Dis. 2008;15:641–656. doi: 10.3233/jad-2008-15410. [DOI] [PubMed] [Google Scholar]
- 15.Woodruff-Pak DS, Agelan A, Del VL. A rabbit model of Alzheimer’s disease: valid at neuropathological, cognitive, and therapeutic levels. J Alzheimers Dis. 2007;11:371–383. doi: 10.3233/jad-2007-11313. [DOI] [PubMed] [Google Scholar]
- 16.Schreurs BG. Cholesterol and Copper Affect Learning and Memory in the Rabbit. Int J Alzheimers Dis. 2013;2013:518780. doi: 10.1155/2013/518780. [DOI] [PMC free article] [PubMed] [Google Scholar]
- 17.Valencia-Sanchez MA, Liu J, Hannon GJ, Parker R. Control of translation and mRNA degradation by miRNAs and siRNAs. Genes Dev. 2006;20:515–524. doi: 10.1101/gad.1399806. [DOI] [PubMed] [Google Scholar]
- 18.Bartel DP. MicroRNAs: genomics, biogenesis, mechanism, and function. Cell. 2004;116:281–297. doi: 10.1016/s0092-8674(04)00045-5. [DOI] [PubMed] [Google Scholar]
- 19.Filipowicz W, Bhattacharyya SN, Sonenberg N. Mechanisms of post-transcriptional regulation by microRNAs: are the answers in sight? Nat Rev Genet. 2008;9:102–114. doi: 10.1038/nrg2290. [DOI] [PubMed] [Google Scholar]
- 20.Friedman RC, Farh KK, Burge CB, Bartel DP. Most mammalian mRNAs are conserved targets of microRNAs. Genome Res. 2009;19:92–105. doi: 10.1101/gr.082701.108. [DOI] [PMC free article] [PubMed] [Google Scholar]
- 21.Lewis BP, Burge CB, Bartel DP. Conserved seed pairing, often flanked by adenosines, indicates that thousands of human genes are microRNA targets. Cell. 2005;120:15–20. doi: 10.1016/j.cell.2004.12.035. [DOI] [PubMed] [Google Scholar]
- 22.Fineberg SK, Kosik KS, Davidson BL. MicroRNAs potentiate neural development. Neuron. 2009;64:303–309. doi: 10.1016/j.neuron.2009.10.020. [DOI] [PubMed] [Google Scholar]
- 23.Chan AW, Kocerha J. The Path to microRNA Therapeutics in Psychiatric and Neurodegenerative Disorders. Front Genet. 2012;3:82. doi: 10.3389/fgene.2012.00082. [DOI] [PMC free article] [PubMed] [Google Scholar]
- 24.Satoh J. Molecular network of microRNA targets in Alzheimer’s disease brains. Exp Neurol. 2012;235:436–446. doi: 10.1016/j.expneurol.2011.09.003. [DOI] [PubMed] [Google Scholar]
- 25.Nelson PT, Wang WX, Rajeev BW. MicroRNAs (miRNAs) in Neurodegenerative Diseases. Brain Pathol. 2008;18:130–138. doi: 10.1111/j.1750-3639.2007.00120.x. [DOI] [PMC free article] [PubMed] [Google Scholar]
- 26.Wang WX, Rajeev BW, Stromberg AJ, Ren N, Tang G, Huang Q, Rigoutsos I, Nelson PT. The expression of microRNA miR-107 decreases early in Alzheimer’s disease and may accelerate disease progression through regulation of beta-site amyloid precursor protein-cleaving enzyme 1. J Neurosci. 2008;28:1213–1223. doi: 10.1523/JNEUROSCI.5065-07.2008. [DOI] [PMC free article] [PubMed] [Google Scholar]
- 27.Schonrock N, Ke YD, Humphreys D, Staufenbiel M, Ittner LM, Preiss T, Gotz J. Neuronal microRNA deregulation in response to Alzheimer’s disease amyloid-beta. PLoS One. 2010;5:e11070. doi: 10.1371/journal.pone.0011070. [DOI] [PMC free article] [PubMed] [Google Scholar]
- 28.Wang X, Liu P, Zhu H, Xu Y, Ma C, Dai X, Huang L, Liu Y, Zhang L, Qin C. miR-34a, a microRNA up-regulated in a double transgenic mouse model of Alzheimer’s disease, inhibits bcl2 translation. Brain Res Bull. 2009;80:268–273. doi: 10.1016/j.brainresbull.2009.08.006. [DOI] [PubMed] [Google Scholar]
- 29.Delay C, Hebert SS. MicroRNAs and Alzheimer’s Disease Mouse Models: Current Insights and Future Research Avenues. Int J Alzheimers Dis. 2011;2011:894938. doi: 10.4061/2011/894938. [DOI] [PMC free article] [PubMed] [Google Scholar]
- 30.Li SC, Chan WC, Hu LY, Lai CH, Hsu CN, Lin WC. Identification of homologous microRNAs in 56 animal genomes. Genomics. 2010;96:1–9. doi: 10.1016/j.ygeno.2010.03.009. [DOI] [PubMed] [Google Scholar]
- 31.Liu G, Fang Y, Zhang H, Li Y, Li X, Yu J, Wang X. Computational identification and microarray-based validation of microRNAs in Oryctolagus cuniculus. Mol Biol Rep. 2010;37:3575–3581. doi: 10.1007/s11033-010-0006-5. [DOI] [PubMed] [Google Scholar]
- 32.Cogswell JP, Ward J, Taylor IA, Waters M, Shi Y, Cannon B, Kelnar K, Kemppainen J, Brown D, Chen C, Prinjha RK, Richardson JC, Saunders AM, Roses AD, Richards CA. Identification of miRNA changes in Alzheimer’s disease brain and CSF yields putative biomarkers and insights into disease pathways. J Alzheimers Dis. 2008;14:27–41. doi: 10.3233/jad-2008-14103. [DOI] [PubMed] [Google Scholar]
- 33.Wang WX, Huang Q, Hu Y, Stromberg AJ, Nelson PT. Patterns of microRNA expression in normal and early Alzheimer’s disease human temporal cortex: white matter versus gray matter. Acta Neuropathol. 2011;121:193–205. doi: 10.1007/s00401-010-0756-0. [DOI] [PMC free article] [PubMed] [Google Scholar]
- 34.Lukiw WJ. Micro-RNA speciation in fetal, adult and Alzheimer’s disease hippocampus. Neuroreport. 2007;18:297–300. doi: 10.1097/WNR.0b013e3280148e8b. [DOI] [PubMed] [Google Scholar]
- 35.Hebert SS, Horre K, Nicolai L, Papadopoulou AS, Mandemakers W, Silahtaroglu AN, Kauppinen S, Delacourte A, De SB. Loss of microRNA cluster miR-29a/b-1 in sporadic Alzheimer's disease correlates with increased BACE1/beta-secretase expression. Proc Natl Acad Sci U S A. 2008;105:6415–6420. doi: 10.1073/pnas.0710263105. [DOI] [PMC free article] [PubMed] [Google Scholar]
- 36.Nelson PT, Wang WX. MiR-107 is reduced in Alzheimer’s disease brain neocortex: validation study. J Alzheimers Dis. 2010;21:75–79. doi: 10.3233/JAD-2010-091603. [DOI] [PMC free article] [PubMed] [Google Scholar]
- 37.Yao J, Hennessey T, Flynt A, Lai E, Beal MF, Lin MT. MicroRNA-related cofilin abnormality in Alzheimer’s disease. PLoS One. 2010;5:e15546. doi: 10.1371/journal.pone.0015546. [DOI] [PMC free article] [PubMed] [Google Scholar]
- 38.Wilfred BR, Wang WX, Nelson PT. Energizing miRNA research: a review of the role of miRNAs in lipid metabolism, with a prediction that miR-103/107 regulates human metabolic pathways. Mol Genet Metab. 2007;91:209–217. doi: 10.1016/j.ymgme.2007.03.011. [DOI] [PMC free article] [PubMed] [Google Scholar]
- 39.Xu G, Ji C, Shi C, Fu H, Zhu L, Zhu L, Xu L, Chen L, Feng Y, Zhao Y, Guo X. Modulation of hsa-miR-26b levels following adipokine stimulation. Mol Biol Rep. 2013;40:3577–3582. doi: 10.1007/s11033-012-2431-0. [DOI] [PubMed] [Google Scholar]
- 40.Marwarha G, Dasari B, Prasanthi JR, Schommer J, Ghribi O. Leptin reduces the accumulation of Abeta and phosphorylated tau induced by 27-hydroxycholesterol in rabbit organotypic slices. J Alzheimers Dis. 2010;19:1007–1019. doi: 10.3233/JAD-2010-1298. [DOI] [PMC free article] [PubMed] [Google Scholar]
- 41.Chen PS, Su JL, Cha ST, Tarn WY, Wang MY, Hsu HC, Lin MT, Chu CY, Hua KT, Chen CN, Kuo TC, Chang KJ, Hsiao M, Chang YW, Chen JS, Yang PC, Kuo ML. miR-107 promotes tumor progression by targeting the let-7 microRNA in mice and humans. J Clin Invest. 2011;121:3442–3455. doi: 10.1172/JCI45390. [DOI] [PMC free article] [PubMed] [Google Scholar]