

Summary
We investigated the homeostatic behavior of hematopoietic stem and progenitor cells (HSPCs) temporally defined according to their divisional histories using an HSPC-specific GFP label-retaining system. We show that homeostatic hematopoietic stem cells (HSCs) lose repopulating potential after limited cell divisions. Once HSCs exit dormancy and accrue divisions, they also progressively lose the ability to return to G0 and functional activities associated with quiescent HSCs. In addition, dormant HSPCs phenotypically defined as multipotent progenitor cells display robust stem cell activity upon transplantation, suggesting that temporal quiescence is a greater indicator of function than cell-surface phenotype. Our studies suggest that once homeostatic HSCs leave dormancy, they are slated for extinction. They self-renew phenotypically, but they lose self-renewal activity. As such, they question self-renewal as a characteristic of homeostatic, nonperturbed HSCs in contrast to self-renewal demonstrated under stress conditions.
Highlights
-
•
Homeostatic HSCs progressively lose self-renewal ability with cell division
-
•
G0 homeostatic HSCs lose functional ability in relation to their divisional history
-
•
Temporally defined quiescence reflects HSC functional abilities better than phenotype
-
•
Once dormant HSCs are activated without stress, they lose self-renewal activity
Moore and colleagues suggest that, during normal homeostasis, once HSCs exit dormancy, they lose robust repopulating activity in proportion to the number of times they divide, irrespective of cell-surface phenotype. They also lose the ability to return to quiescence in relationship to their divisional history as well as functional activity as G0 HSC.
Introduction
Hematopoiesis is a developmental system uniquely suited for studies of regulatory mechanisms governing complex programs of cellular differentiation. The blood consists of at least ten distinct cell types, all with finite life spans that require continuous replenishment throughout life. Hematopoietic stem cells (HSCs) anchor this hierarchical system. These cells can self-renew, die, or commit to programs of differentiation, which give rise to new classes of hematopoietic stem and progenitor cells (HSPCs) distinguished by more restricted self-renewal, proliferative, and differentiation abilities. Clearly, both intrinsic and extrinsic regulatory mechanisms collectively regulate the balance of self-renewal and differentiation in order to ensure life-long, balanced, and multilineage hematopoiesis.
Almost everything we know about HSPC activity has been defined in terms of in vivo transplantation assays. These have been extremely useful in elucidating phenotypically defined compartments of the hematopoietic hierarchy with respect to their long-term (LT) and short-term (ST) repopulating potentials as well as self-renewal abilities in the context of serial transplantation. However, they provide no direct insights into the behavior of HSPC populations during normal nonperturbed homeostasis. In actuality, transplantation assays measure a cell’s inherent ability to respond to the extreme stress of the assay itself. Because HSC proliferation and differentiation are inextricably linked, methods to study these cells as they proliferate in situ are necessary. Quiescence has emerged as a hallmark property of HSCs. Primitive HSCs generally reside in the G0 phase of the cell cycle but in broad ranges depending on their phenotype and experimental methodologies (Pietras et al., 2011). However, quiescence measurements provide only a “snapshot” of the immediate status of HSCs. They do not provide information about the duration of quiescence, previous divisional history, the time of entrance into quiescence, and how these aspects correlate with stem cell function. Previous studies have determined the in vivo proliferative status of HSPCs by the incorporation of DNA nucleoside analogs (Cheshier et al., 1999, Kiel et al., 2007). This methodology precludes functional assessment, yielding only correlative information reliant on cell phenotype. More recent studies of HSPC divisional kinetics and subsequent activity employ viable label-retaining cell (LRC) tracking systems. These methods include in vivo biotin labeling (Nygren and Bryder, 2008), in vitro labeling with fluorescent dyes (Takizawa et al., 2011), or dynamic chromosomal labeling with a controllable histone 2B GFP fusion product (H2BGFP) (Foudi et al., 2009, Schaniel and Moore, 2009, Wilson et al., 2008). These studies revealed HSCs with differential activities and abilities dependent on the context of either homeostasis or stress. Two studies using controllable H2BGFP labeling revealed dormant and activated HSC populations, with the former containing the majority of repopulating stem cell activity (Foudi et al., 2009, Wilson et al., 2008). Dormant HSCs divide very rarely, with less than 1% entering the cell cycle per day (Foudi et al., 2009, Wilson et al., 2008). In contrast, another study suggested that fast-cycling HSCs contribute to long-term hematopoiesis while slowing down over time (Takizawa et al., 2011). However, this study relied on in vitro labeling followed by transplantation into nonconditioned recipients, a process requiring a range of behaviors not occurring during normal homeostasis. In one study, injury-activated HSCs, defined phenotypically, but not functionally, were shown to go back to dormancy (Wilson et al., 2008). It remains to be demonstrated that homeostatic HSCs that have divided extensively and subsequently returned to quiescence maintain the same functional activities as those that remained dormant.
Our studies employ a transgenic system with H2BGFP expression controlled by an HSPC-specific human (hu) CD34 promoter (Radomska et al., 2002). In this Tet-off system, HSPCs continually incorporate H2BGFP until doxycycline (Dox) is administered (Schaniel and Moore, 2009). We have investigated the properties of HSPCs as they proceed through a divisional cascade defined by progressive label dilution during normal homeostasis. We find that dormancy is a better predictor of stem cell activity than cell-surface phenotypes or snapshot quiescence. Once HSCs leave dormancy and enter the active pool, they progressively lose repopulating and self-renewal activities. Our studies highlight the importance of the active pool in the maintenance of homeostatic hematopoiesis and suggest that, once dormant HSCs are activated, they are slated for extinction. As such, this would provide an important control mechanism for hematological malignancies and other disorders of the hematopoietic system.
Results
Characterization of Stem/Progenitor Cells in huCD34tTA/TetO-H2BGFP Mice
We measured GFP levels in phenotypically defined bone marrow (BM) HSPC subsets in huCD34tTA/TetO-H2BGFP (34/H2B) double transgenic mice prior to a Dox chase. Prospectively identified primitive compartments were analyzed at 6–8 weeks of age to ensure complete labeling and phenotypic stability (Osawa et al., 1996). GFP gating was determined by comparative analysis with single transgenic TetO-H2BGFP mice previously shown to have low levels of background fluorescence (Challen and Goodell, 2008). In 34/H2B mice, high levels of GFP were observed in all HSPC compartments with transplantable activities (Figure 1A). High GFP levels in CD34−CD135− Lineage− Sca-1+ cKit+ (LSK) cells confirm that the huCD34 promoter is active in mouse CD34− HSC. GFP expression is diminished after the CD34+CD135+ LSK multipotent progenitor (MPP) stage. These data demonstrate that the huCD34 promoter directs highest levels of GFP expression in the more-primitive HSPC compartments. We turned off GFP expression during a 12-week Dox chase. Figure 1B displays typical GFP histograms for phenotypically defined repopulating HSCs before and after the chase. High levels of GFP retention are segregated to cells with LT-repopulating HSC phenotypes. A kinetic analysis of label dilution confirmed a previously observed biphasic dilution pattern (Figure S1A available online; Foudi et al., 2009, Wilson et al., 2008). To determine the immediate snapshot cell-cycle status of GFP+ LRC, we stained LSK cells with Pyronin Y and Hoechst 33342 (Py/Ho) (Passegué et al., 2005; Figure 1C). GFP+ cells are distributed throughout all phases of the cell cycle in the no Dox GFP+ fraction, whereas in Dox-treated mice, most GFP+ cells are in G0 (59.2% versus 90.5%, respectively). These data demonstrate that GFP+ LRCs are enriched for quiescent cells that have remained dormant during the prolonged chase period.
Figure 1.
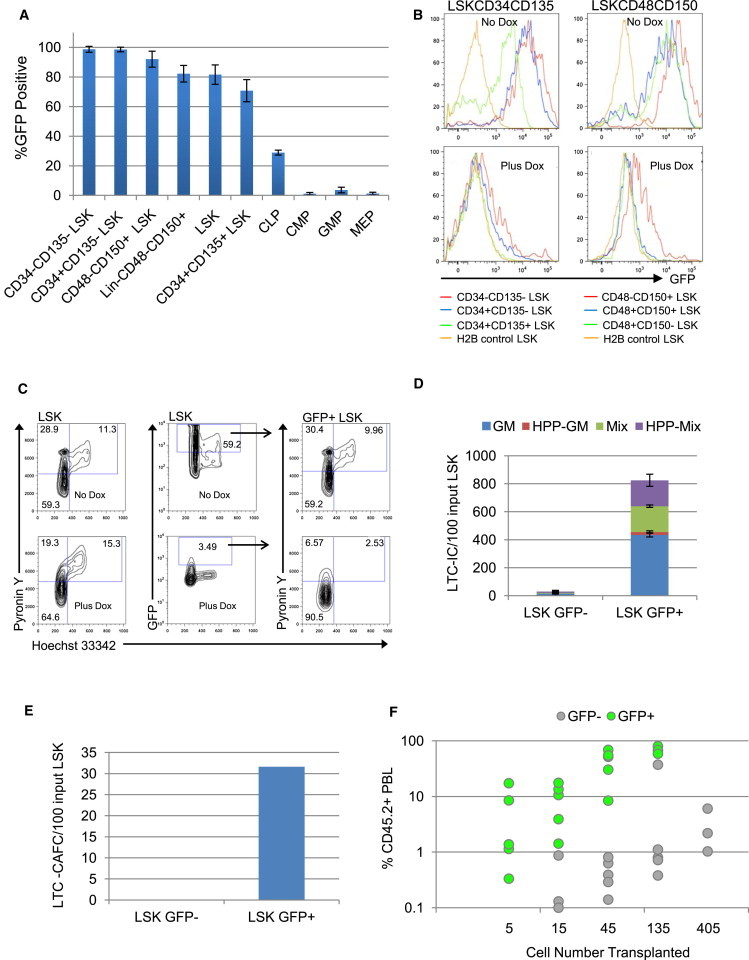
Characterization of Stem/Progenitor Cells in 34/H2B Mice
(A) Percentage of GFP-positive cells in BM compartments of 34/H2B mice. Mean ± SD; n = 3 mice.
(B) GFP histograms of BM compartments in LSK cells before (top) and after (bottom) Dox treatment (12 weeks, chase).
(C) Cell-cycle profiles of LSK cells before and after Dox treatment (12 weeks). All LSK (left), gating for GFP+LSK (middle), GFP+LSK (right). Upper panels, before Dox; lower panels, after Dox. G0 PylowHo2N, G1 PyhiHo2N, S/G2/M PyhiHo > 2N-4N.
(D) LTC-IC assay of GFP-positive or negative LSK cells. cfus were normalized to the amount derived from 100 cells initiating the LTC. Mean ± SD; n = 3 separate cultures.
(E) LTC-CAFC assay of GFP-positive or negative LSK cells. The frequency of CAFCs was normalized to the amount derived from 100 cells initiating the LTC.
(F) Peripheral blood leukocyte (PBL) chimerism (%CD45.2+ donor-derived cells) 8 months after transplant of GFP-positive and negative LSK cells isolated after 10 weeks chase. 5, 15, 45, 135, or 405 cells were transplanted into SJL mice together with 400,000 SJL BM. Each circle represents an individual mouse (3–5 mice/cell dose). Mice with <1.0% CD45.2+ cells were considered negative.
See also Figure S1.
In Vitro and In Vivo Activities of GFP Label-Retaining Cells
A distinct advantage of our system is that it allows the use of GFP for viable HSC enrichment without a bias for known phenotypic markers. Because the huCD34tTA transgene is also expressed in endothelial and some mesenchymal cells, we used LSK cells to exclude nonhematopoietic cells. We observed no significant differences between isolated LSK GFP+ and GFP− cells from mice chased for 12 weeks in primary colony-forming cell (cfu) assays (Figure S1B). We also plated these cells in long-term culture (LTC) (Miller et al., 2008) and in primary limiting-dilution cobblestone-area-forming cell (LD-CAFC) assays (de Haan and Ploemacher, 2002). CAFC activity in GFP− cells peaked early and disappeared, whereas CAFC activity in the GFP+ population appeared late and persisted (Figure S1C). After LTC, cells were harvested and plated into cfu assays for LTC-initiating cell (IC) and in secondary LD-CAFC assays to measure primitive progenitors more closely related to repopulating HSCs. Strikingly, no activity was seen when GFP− cells were used to initiate the LTC, whereas high frequencies were present in the GFP+ fraction (Figures 1D and 1E). These data suggest that LSK cells that have divided extensively during the chase period have lost in vitro potential characteristic of primitive HSPCs. We extended our functional studies to in vivo competitive repopulation assays. Peripheral blood from recipients was analyzed for the presence of donor-derived CD45.2+ B, T, and myeloid cells. The repopulating activity of LSK GFP− cells was minimal, whereas LSK GFP+ cells performed extremely well (Figures 1F and S1D). Such repopulation efficiencies are remarkable for LSK cells and suggest that temporally defined quiescence further enriches for HSCs with robust in vivo potential. We also assessed LT self-renewal potential by transplantation into secondary mice. Only BM from primary mice engrafted with GFP+ cells was able to repopulate secondary recipients, demonstrating that LSK GFP− cells had lost their ability to self-renew (data not shown).
Relating Biological Activity to Divisional History
Functional Characterization of HSPCs with Varying Levels of GFP Label Retention
The dramatic differences in biological potency of GFP+ and GFP− cells prompted us to dissect the entire GFP+ compartment to reflect progressive divisional histories. The proliferation index utility in Flowjo software (Treestar) predicts that LSK cells with high levels of GFP need six or seven divisions to completely dilute GFP (Figure S2A). This estimate is only predictive and does not imply that this is a synchronized uniformly dividing cell population. The proliferation index also suggests that only one or two cell divisions separate each successive GFP level. The GFP dilution profile of Dox-treated 34/H2B LSK cells was divided into progressively brighter GFP 0 to GFP 1, GFP 2, GFP 3, and GFP 4 levels (Figure 2A). These fractions were isolated and studied by transplantation and gene-expression profiling. Repopulating activity correlated with GFP retention. Only the GFP3 and GFP4 fractions contained cells that had LT-repopulating abilities (Figures 2B and 2C). Most surprisingly, secondary mouse repopulation potential was restricted to the brightest GFP4 fraction (Figure 2D).
Figure 2.
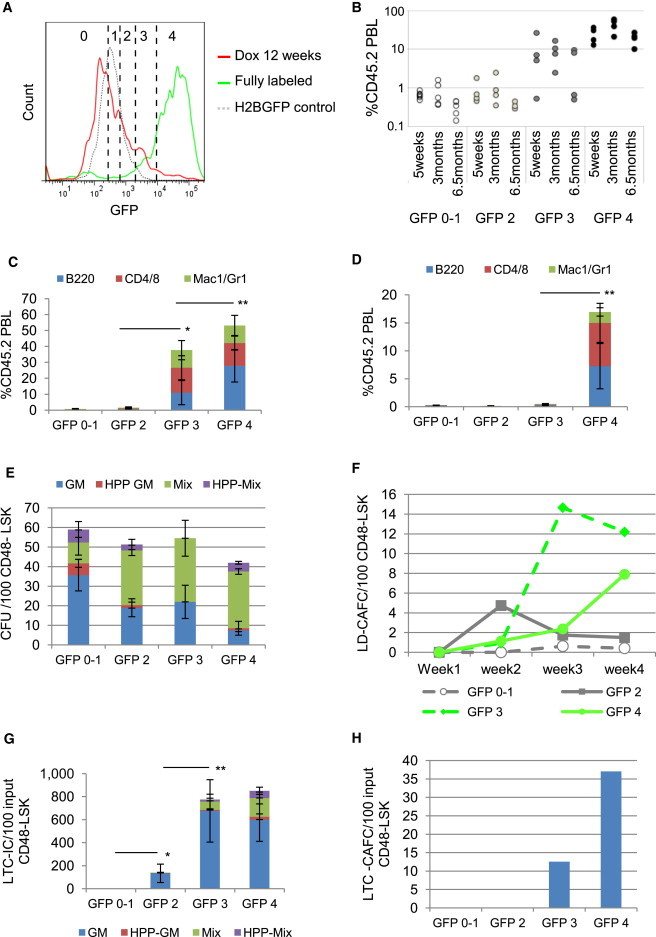
HSC Activity Correlates with Divisional History
(A) After 12 weeks chase, the LSK GFP histogram (red line) was divided into five fractions from low- to high-GFP retention. Prior to chase, 90% of LSK cells were in the GFP 3 and GFP 4 fractions (green line). Dotted gray line, H2BGFP control.
(B) Chimerism 5 weeks and 3 and 6.5 months posttransplantation of LSK cells isolated from each GFP level. One hundred cells from each fraction were transplanted into 4–6 SJL-recipient mice together with 200,000 SJL-competitor BM cells. Data are derived from one of two transplant experiments with consistent results. Each circle represents an individual mouse.
(C) Donor reconstitution to each lineage at 3 months after transplant. Mean ± SD; n = 4–6 mice.
(D) Donor reconstitution to each lineage at 3.5 months postsecondary transplantation of pooled BM (2 × 10⁶) from primary recipient mice from each GFP group from two transplant experiments. Three to five SJL mice were transplanted per group. Mean ± SD; n = 3–5 mice.
(E) cfu assay of LSKCD48− cells at each GFP level; colonies per 100 cells; mean ± SD; n = 3 separate cultures.
(F) LD-CAFC assay of LSKCD48− cells at each GFP level.
(G) LTC-IC assay of LSKCD48− cells at each GFP level; cfus were normalized to the amount derived from 100 cells initiating the LTC. Mean ± SD; n = 3 separate cultures.
(H) LTC-CAFC assay of LSKCD48− cells at each GFP level; frequency of CAFCs was normalized to the amount derived from 100 cells initiating the LTC.
Significance of donor contribution to total PBL (C and D) and of total colony numbers (G) by Student’s t test; ∗p < 0.05; ∗∗p < 0.01. See also Figure S2.
CD48+ cells are devoid of repopulating potential (Kiel et al., 2005). Further enriching the LSK population by excluding CD48+ cells did not show a difference in total cfu (Figure 2E), although there were significant differences in the percentage of more-primitive cfu-mix colonies among the fractions (Figure S2B). LD-CAFC revealed kinetic differences in the appearance and extinction of colonies. Only GFP3 and GFP4 cells displayed CAFC at 4 weeks (Figure 2F). The LTC assays were highly correlated with GFP retention (Figures 2G, 2H, and S2C). Collectively, these in vivo and in vitro assays suggest that, once HSCs initiate a course of cell division, they progressively lose functional activities. Most surprisingly, compromised functions are already evident after only a few cell divisions.
Phenotypic Characterization of BM with Varying Levels of GFP Label Retention
A potential explanation for the loss of stem cell activity in the dividing fractions would be the loss of cells with an HSC cell-surface phenotype that were initially present within the LSK population. To address this possibility, we performed in-depth analyses of HSPC phenotypes across the divisional cascade. Cells with high levels of label retention, GFP4, are segregated to those with a LT-HSC phenotype (CD135−CD34−LSK 13.4%, CD48−CD150+LSK 17.1%, and CD48−CD150+CD135−CD34−LSK 19.2%), whereas phenotypic ST-HSCs represent 2% to 3% of GFP4 cells and MPPs are almost undetectable in the GFP4 fraction (less than 1%; Figure 3A). The percentages of each population in each GFP compartment from whole BM are presented in Table S1. We next looked at these markers in LSK cells throughout the GFP dilution cascade. Surprisingly, LSKCD34−CD135− and LSKCD34+CD135− cells are present at similar percentages in GFP3 and GFP4 (Figures 3B and S3A). Interestingly, the lower GFP fractions are similar to total LSK cells, although they do not contain repopulating stem cells (Figure 2B). LSKCD48−CD150+ cells are enriched in GFP2, GFP3, and GFP4 fractions, with the GFP3 portion having the highest level (Figure 3C). CD48 appeared in the low-GFP fractions (Figures 3C and S3B). Intrigued with the large percentage of CD34+ and CD150− cells in the high-GFP retaining cells, we asked how CD34 and the MPP marker CD135 were distributed in both LSKCD48−CD150− and LSKCD48−CD150+ populations. CD135−CD34− and CD135−CD34+ cells were highly enriched in the LSKCD48−CD150− GFP4 population, whereas CD135+ cells appear once these cells exit GFP4 (Figures 3D and S3C). The LSKCD48−CD150+ cells contain large proportions of both CD34+ and CD34− cells in the GFP2, GFP3, and GFP4 compartments with few CD135+ cells (Figures 3E and S3D). Gene-expression profiles of cells used in the transplantation assays shown in Figure 2 support the changing cell-surface markers observed within the divisional cascade (Figure S3E). The persistence of cells defined as ST-HSC (LSKCD34+CD135−) and MPP (LSKCD150−CD48−) in GFP4 cells highlights the heterogeneity of the dormant population. These data also show that the loss of self-renewal potential as LSK cells exit GFP4 cannot be explained by a loss of phenotypically defined LT-HSCs because the GFP3 and GFP4 fractions are almost identical, suggesting that divisional history is a better indicator of stem cell function than phenotype.
Figure 3.
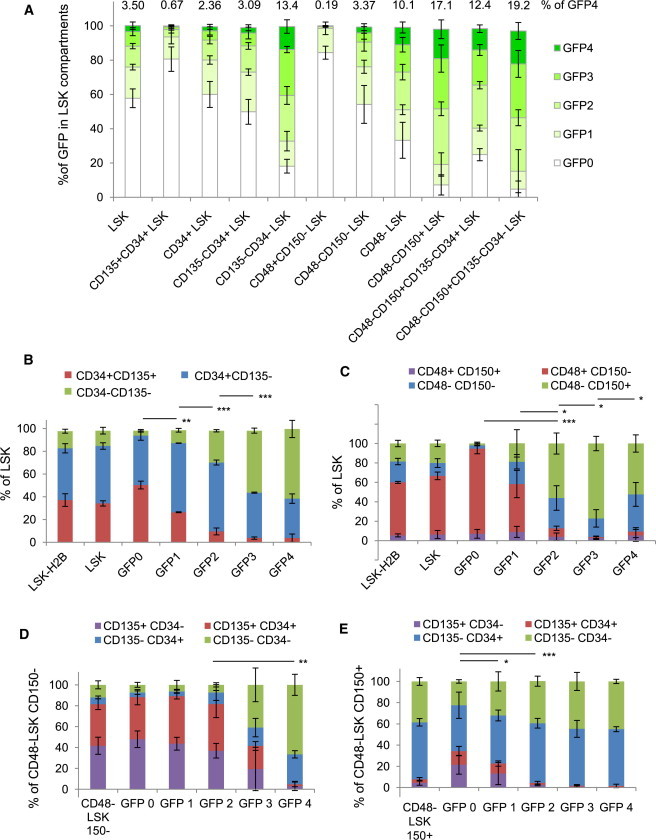
Phenotypic Analyses of HSPCs within Each GFP Dilution Fraction
Phenotypic analyses of GFP LRCs contained within a specific HSPC phenotype population or as a phenotypic characterization of each GFP level after a 12-week Dox chase period.
(A) The stacked bars are composed of the percentage of each GFP level that contributes to that specific HSPC phenotype as indicated. The percent of GFP4 cells in each phenotype is indicated on top of the bar graph.
(B) The distribution of CD135 and CD34 subfractions of LSK cells in each GFP level.
(C) The distribution of CD48 and CD150 subfractions of LSK cells in each GFP level.
(D) The distribution of CD135 and CD34 subfractions of LSKCD48−CD150− cells in each GFP level.
(E) The distribution of CD135 and CD34 subfractions of LSKCD48−CD150+ cells in each GFP level.
Significance determined by Student’s t test for comparison of the primitive phenotype in each group (green bars); ∗p < 0.05; ∗∗p < 0.01; ∗∗∗p < 0.001; mean ± SD; n = 3 to 4 mice per analysis. See also Figure S3.
Functional Heterogeneity in the Dormant GFP Label-Retaining Population
Recent reports have shown CD150 expression heterogeneity in primitive phenotypically defined HSC populations. These studies suggested that CD150−/lo HSCs provide LT-HSC activity in primary transplants but lack self-renewal potential measured in secondary recipients (Morita et al., 2010, Weksberg et al., 2008). We elected to investigate the functional significance of CD150 expression within the dormant GFP high (Hi) LRC fraction. GFP Hi CD48−LSK cells display three distinct levels of CD150: high (Hi), medium (Med), and low (Low) (Figure 4A). All fractions, including parental CD48−LSK cells, repopulated, but the CD150 Low cells were significantly less robust (Figures 4B and 4C). Recipient BM revealed a gradual decrease in CD45.2+ cells correlated with decreasing donor levels of CD150. Significant differences were seen in all BM HSPC compartments in total CD48−LSK and CD150 Hi recipient groups versus CD150 Low (Figure S4A) groups. The highest secondary reconstitution activity was seen in BM from primary CD150 Hi recipients (Figure 4D). Analyses of secondary recipient BM again revealed robust reconstitution from the CD150 Hi primary donor group (Figure S4B). Although dormant CD150 Low cells can LT-repopulate primary mice, they do not regenerate self-renewing stem cell pools capable of secondary engraftment. The most robust repopulating and self-renewing HSCs were contained within the CD150 Hi portion, extending previous observations to the dormant stem cell pool.
Figure 4.
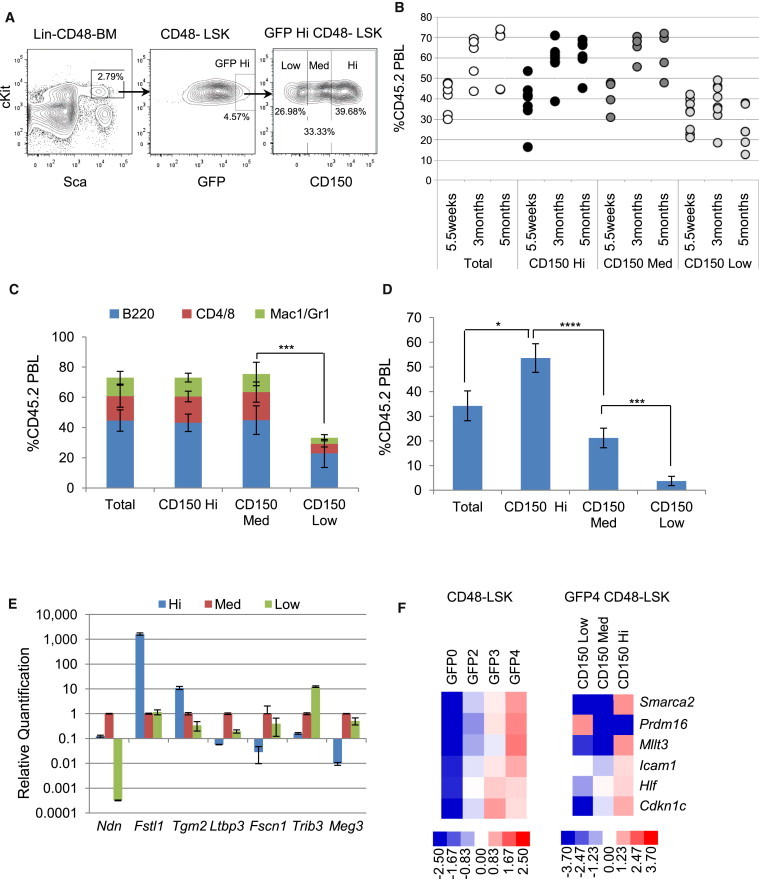
Functional Analysis of GFP-High LRCs with Heterogeneous Expression of CD150
(A) Gating strategy for the isolation of CD150 Hi, Med, and Low subfractions of GFP-high LSKCD48− cells and the parent population. Cells were isolated after 13 weeks chase.
(B) Chimerism at 5.5 weeks and 3 and 5 months posttransplantation of GFP-high LSKCD48− cells and the CD150 Hi, Med, and Low subfractions of those cells. One hundred cells per group were transplanted into each of 5–8 SJL mice together with 200,000 BM cells from SJL mice. Each circle represents an individual mouse.
(C) Donor reconstitution to each lineage at 3 months post-primary transplantation; mean ± SD; n = 5–8 mice.
(D) Chimerism 1 month after secondary transplantation of pooled BM (2 × 10⁶) from each group of primary recipient mice; four or five mice were transplanted per group.
(E) Expression of Ndn, Fstl1, Tgm2, Ltbp3, Fscn, Trib3, and Meg3 by qPCR for CD150 Hi, Med, and Low fractions of GFP-high CD48−LSK cells (n = 3 assays from one sort).
(F) Fluidigm gene-expression qPCR on 200 sorted LSKCD48− cells at varying GFP levels (left) or CD150 Hi, Med, and Low subfractions of LSKCD48− GFP4 cells (right). Results were normalized within each group separately.
Data as mean ± SD; significance of donor contribution to total PBL (C and D) determined by Student’s t test; ∗p < 0.05; ∗∗∗p < 0.001; ∗∗∗∗p < 0.0001. See also Figure S4.
Gene-expression analyses of these same subsets unveiled a surprising degree of specificity that segregates with CD150 levels. Genes are highly differentially expressed in the CD150 Hi, Med, and Low populations (Figures 4E and 4F). Fstl1, Tgm2, Smarca2, Mllt3, Icam1, Hlf, and Cdkn1c (p57) emerge as candidate regulators of dormant CD150 Hi cells. These data provide insights into the molecular changes that occur as dormant HSCs downregulate the expression of CD150.
Correlating Divisional History with Stem Cell Phenotype and Repopulation Potential
Expression of CD34 has been considered a feature that delineates murine ST/MPP from LT (CD34−) HSPC activities (Osawa et al., 1996, Yang et al., 2005). To our knowledge, additional properties of CD34+ HSPCs have not been investigated. Surprisingly, our phenotypic analysis of HSPCs throughout the divisional cascade revealed significant numbers of CD34+CD135− cells in GFP Hi LRCs (Figure 3). Therefore, we divided CD48−CD135−CD150+ LSK cells into GFP Hi and Low portions. These cells were then sorted into GFP Hi CD34+, GFP Low CD34+, GFP Hi CD34−, and GFP Low CD34− compartments (Figure 5A) and functionally analyzed in vitro and in vivo. Both LTC-CAFC and LTC-IC were highly enriched in both CD34− and CD34+ GFP Hi subpopulations, with far fewer in the corresponding GFP Low fractions (Figures 5B and 5C). Both CD34− and CD34+ GFP Hi fractions repopulated robustly (Figures 5D) and throughout the entire posttransplant period (Figure S5A). Analyses of recipient BM revealed additional surprising results. Neither CD34− nor CD34+ GFP Low cells re-established HSPC compartments. On the other hand, there were high levels of HSPC repopulation from both CD34+ and CD34− GFP Hi cells, including a large CD45.2+ LSK CD48−CD150+ compartment (Figure 5F). Perhaps even more surprising is the robust repopulation of secondary mice transplanted with BM from GFP Hi CD34+ primary recipients (Figures 5E and S5B). Analyses of secondary recipient BM finally revealed differences between the initial CD34− and CD34+ GFP Hi subpopulations. CD45.2+ LSK CD48− and LSK CD48−CD150+ fractions were significantly lower in recipients of cells from primary mice engrafted with the CD34+ GFP Hi fraction (Figure 5G). Collectively, these data show that LSK CD48−CD135−CD150+CD34− cells within the dormant population contain robust stem cell activity, whereas cells with an identical phenotype but with a significant history of division have lost this activity. In addition, dormant LSK CD48−CD135−CD150+CD34+ cells also have this capacity but start to lose the ability to re-establish HSPC populations in secondary recipients.
Figure 5.
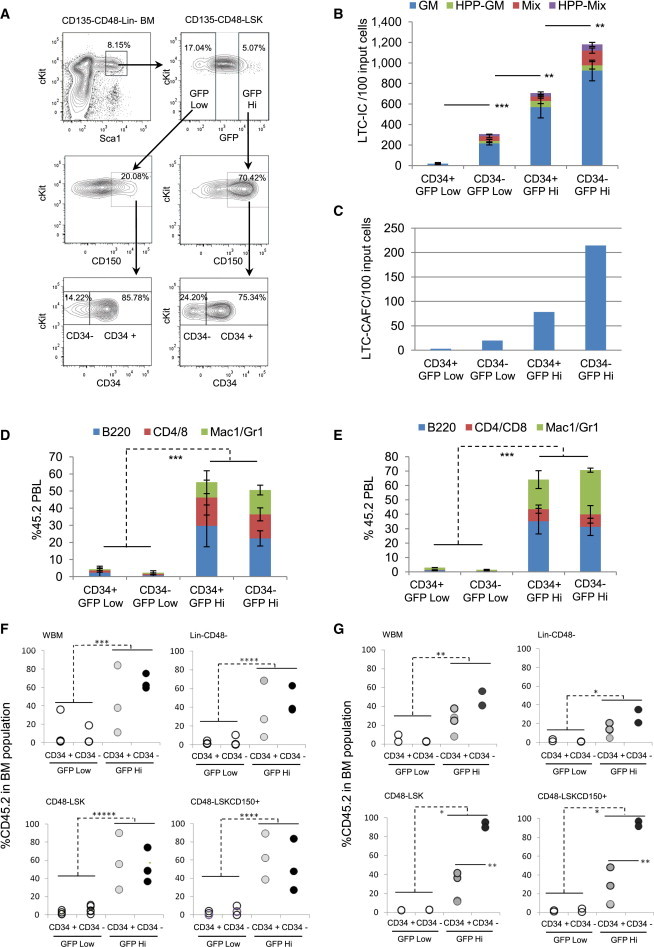
Functional Analysis of CD34+ and CD34− Cells Isolated from GFP Hi and Low LSKCD135−CD48−CD150+ Cells
(A) Isolation of CD34+ or CD34− subfractions from GFP Hi and Low LSKCD135−CD48−CD150+ cells. Lineage+CD135+CD48+ cells were first depleted and the remaining positive cells excluded. The four fractions were isolated after 17 weeks of chase.
(B) LTC-IC assay of the above groups; cfus were normalized to the amount derived from 100 cells initiating the LTC (n = 3; separate cultures).
(C) LTC-CAFC assay of above groups; CAFC frequency was normalized to the amount derived from 100 cells initiating the LTC.
(D) Donor reconstitution in each lineage in total PBL 5 months posttransplantation; 30 cells from each of the above groups were transplanted to each of 3–5 SJL mice together with 200,000 BM from SJL mice.
(E) Donor reconstitution in each lineage in total PBL 5.5 months post-secondary transplantation of BM pooled from primary recipient mice within each group; 3–4 mice/group transplanted with 2 × 10⁶ cells.
(F) Donor chimerism in BM compartments 5 months after primary transplant.
(G) Donor chimerism in BM compartments 5.5 month after secondary transplant.
Each circle represents an individual mouse. Data as mean ± SD. Significance of total colonies (B), of donor contribution in total PBL (D and E), in each BM compartment (F and G) between GFP Hi and GFP Low groups, or in BM CD48−LSK and CD48−LSKCD150+ cells between CD34+ and CD34− GFP Hi (G, bottom panels) determined by Student’s t test; ∗p < 0.05; ∗∗p < 0.01; ∗∗∗p < 0.001; ∗∗∗∗p < 0.0001; ∗∗∗∗∗p < 0.00001. See also Figure S5.
G0 HSCs with High Divisional History Lose Functional Activity
We next elected to layer “snapshot” quiescence on temporally defined divisional history to determine the ability of activated HSCs to return to G0. As such, we examined cell-cycle parameters across the divisional cascade and found that, once cells exit dormancy, the proportions of G0 cells decrease in parallel with GFP dilution (Figures 6A and 6B). We then determined the biological activities of the G0 fractions of LSK CD48−CD150+ cells at each GFP level (Figure 6C). We observed dramatic decreases in LTC-CAFC activity in G0 cells within progressive label dilution fractions (Figure 6D). The differences were less pronounced in the LTC-IC assay, but no primitive colonies were seen in the GFP0 to GFP1 fraction (Figure 6E). These data suggest that, once HSCs exit dormancy and start down the divisional cascade, they are less likely to return to G0 and, even if they do, their functional potentials are diminished.
Figure 6.
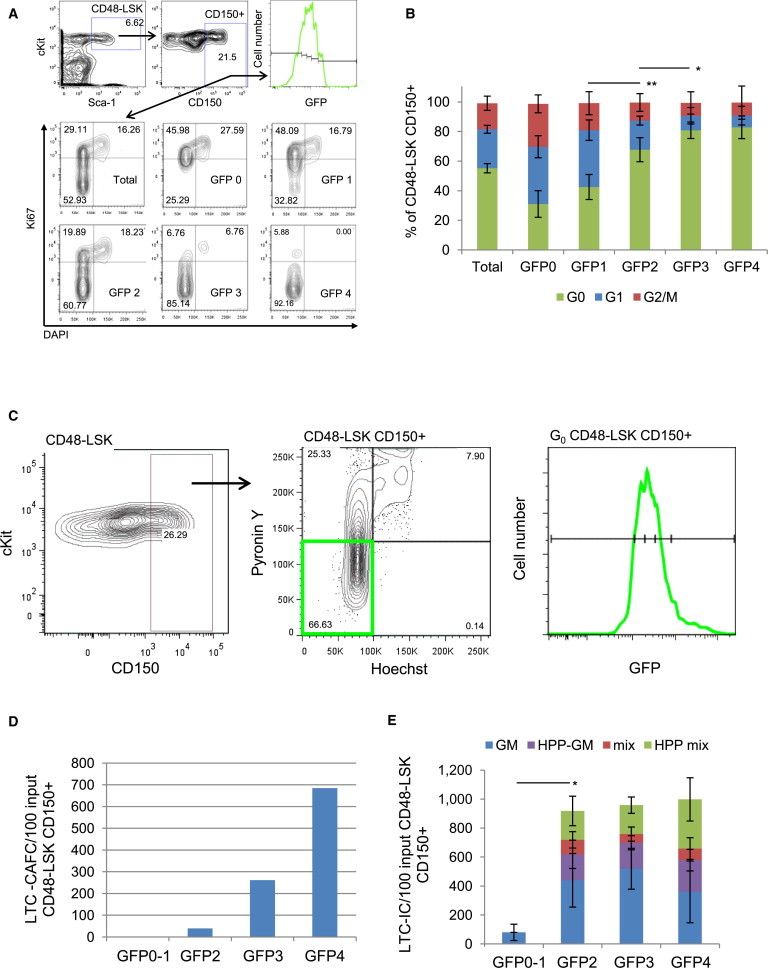
Cell-Cycle Analysis and Functional Activity of G0 LSKCD48−CD150+ Cells throughout the GFP Dilution Cascade
(A) Cell-cycle profiles of total LSKCD48−CD150+ cells or those at GFP 0, GFP 1, GFP 2, GFP 3, and GFP 4 by DNA content (DAPI) versus Ki67 staining. Cell-cycle phases were determined as G0 Ki67lowDAPI2N, G1 Ki67hiDAPI2N, S/G2/M Ki67hiDAPI > 2N-4N.
(B) Percentage of G0, G1, and S/G2/M cells in total LSKCD48−CD150+ and those at GFP 0, GFP 1, GFP 2, GFP 3, and GFP 4 as determined by Ki67/DAPI staining (mean ± SD; n = 4 mice). Significance of G0 cells determined by Student’s t test; ∗p < 0.05; ∗∗p < 0.01.
(C) Isolation of viable G0 LSKCD48−CD150+ cells after 12 weeks chase for in vitro assays. LSKCD48−CD150+ cells were sorted first, followed by Py/Ho staining. G0 cells (PylowHo2N lower left quadrant) were isolated and separated into GFP 0, GFP 2, GFP 3, and GFP 4 subfractions.
(D) LTC-CAFC assay of G0 LSKCD48−CD150+ cells at each GFP level.
(E) LTC-IC assay of G0 LSKCD48−CD150+ cells at each GFP level. Significance of total colonies determined by Student’s t test; ∗p < 0.05; mean ± SD; n = 3 separate cultures.
Relating Gene Expression to Divisional History
In order to determine global changes in the molecular repertoire within the context of divisional history, we performed gene-expression analyses on the same LSK subpopulations used in transplantation assays (Figure 2). We selected two sets of significant genes based on multiple criteria: an extended set of 5,178 genes and an enriched subset of 871 genes (for details see Supplemental Experimental Procedures). From the latter, we developed a divisional history-related gene-expression signature containing 181 genes (Figures 7A and S6A). The signature genes that are upregulated in progressively more dormant HSCs (highest in GFP4) were further analyzed by functional annotation clustering (Database for Annotation, Visualization and Integrated Discovery [DAVID]). Three overlapping clusters represent 40.7% of these genes: signal transduction, regulation of transcription, and cell-cell/matrix interaction (Figure 7A). The substantial enrichment of cell-cell/matrix-interaction genes highlights the importance of microenvironmental crosstalk in dormant HSCs. Over half of the genes in the regulation of transcription cluster are repressors, including all five chromatin modifiers and two of the five transcription factors. These categories and complete gene lists are in Table S2, and the entire signature is in Table S3. Ingenuity pathway analysis revealed a major network of regulation within the upregulated gene set. Several signaling pathways, including phosphatidylinositol 3-kinase/AKT, mitogen-activated protein kinase, and nuclear factor kB, are linked together in the network. Signature molecules compiled into the network were: Trib3, Tgm2, Vegfc, Pik3r1, Foxn3, Gabbr1, Traf1, Itgb5, and Angpt1 (Figure S6C). We confirmed the expression of several upregulated members of the signature without previously reported roles in HSC regulation (Figures 7B and 7C). K-means cluster analysis of the extended pool yielded four clusters that contain progressively up or downregulated genes in the GFP2 to GFP4 fractions (Figure S6B). DAVID analysis of these four clusters revealed that the highly enriched categories in the upregulated clusters were rooted in the same categories as the signature list (Figure S7A); downregulated clusters were enriched in cell cycle, DNA replication/repair, and biosynthetic processes (Figure S6D).
Figure 7.
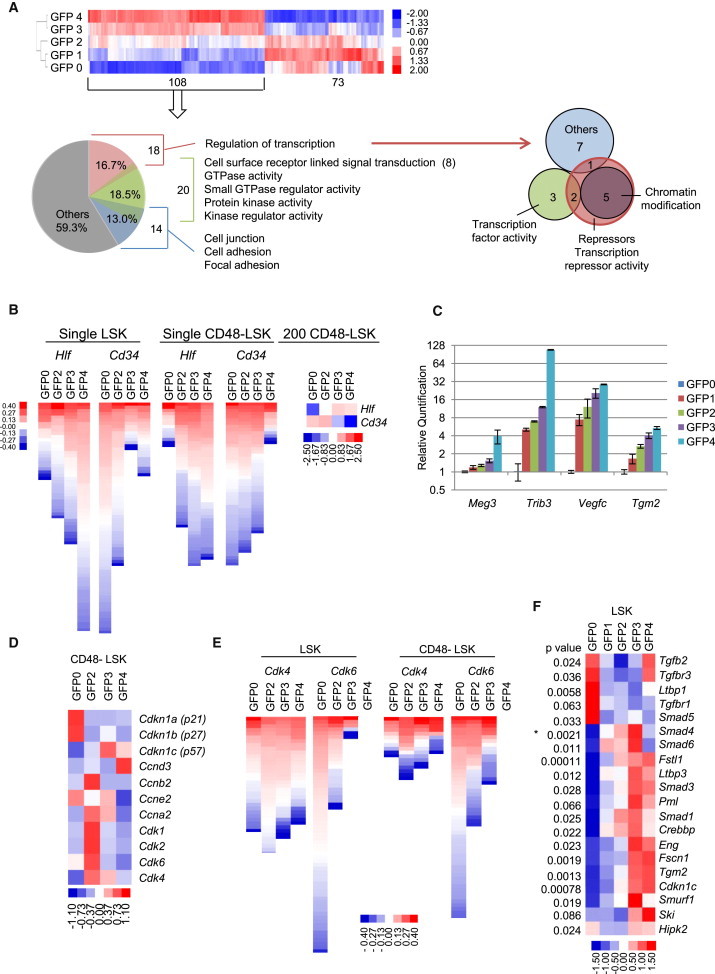
A Divisional History Gene-Expression Signature, Expression Profiles, and Bioinformatic Analyses
(A) Gene-expression signature heatmap correlated with divisional history. One hundred and eighty-one genes were progressively up- (108) or downregulated (73) in correlation with the GFP gradient. See also Table S3. Below, 40.7% of the 108 upregulated genes fall into three overlapping clusters: regulation of transcription, signal transduction, and cell-cell/matrix interaction (left). Venn diagram highlights transcription regulation genes as repressors including all five chromatin modification genes (right). See also Table S2. GTPase, guanosine triphosphatase.
(B) Heatmaps displaying opposite expression patterns of Hlf and Cd34 throughout the GFP gradient. LSK and LSKCD48− cells with varying GFP levels were sorted either as single cells or in pools of 200 cells and analyzed with Fluidigm qPCR. All single cells with detectable signal are represented by a rectangle with data centralized to the median value among all cells and hierarchically clustered by centered correlation. Both the 200 and single-cell analyses display the same pattern.
(C) Expression analysis of Meg3, Trib3, Vegfc, and Tgm2 from the upregulated signature. Analyses were done with LSK cells isolated at each GFP level after 12 weeks chase. All genes show a gradient of gene expression that increases as GFP label is retained. Data are mean ± SD; n = 6 from two sorts.
(D) Expression analysis of selected cell-cycle genes. CD48−LSK cells with varying GFP levels were sorted in pools of 200 cells and analyzed with Fluidigm qPCR.
(E) Single-cell expression analyses of Cdk4 and Cdk6. Heatmaps were assembled from Fluidigm qPCR for Cdk4 and Cdk6 in single LSK cells (left) and single LSKCD48− cells (right). Single cells were analyzed as in (B) above. There is a complete lack of expression of Cdk6 in GFP4 cells in both data sets.
(F) TGF-β-pathway-related genes display varying levels of expression that correlates with GFP retention. A heatmap of microarray data derived from LSK cells isolated at discrete GFP levels from 0 to 4. ANOVA p values or P2B p values (∗) are listed on the left.
Also see Figures S6 and S7 and Supplemental Experimental Procedures for details.
To interrogate the molecular changes triggered after cell division that may result in the loss of self-renewal capacity, we selected genes with high expression in GFP4 that were specifically downregulated in the GFP4 to GFP3 and the GFP3 to GFP2 transitions. Extracellular matrix, cell adhesion, and cell junction are the top differentially enriched categories in the GFP4 versus GFP3 gene sets. These categories were significantly less enriched in the GFP3 versus GFP2 sets (Figure S7B). Genes contained within these categories are available in Table S4.
Because cell-cycle genes are overrepresented in the downregulated group, we investigated these further. Genes encoding cyclins A, B, and E and cyclin-dependent kinases were expressed at higher levels in low-GFP cells and progressively decreased in cells with higher GFP levels (Figures 7D and S7C). Cyclin-dependent kinase inhibitors were differentially expressed along the divisional gradient. Cdkn1c (p57) was expressed at high levels in GFP3 and GFP4 fractions and decreased with greater divisional history. In contrast, Cdkn1a (p21) and Cdkn1b (p27) displayed an opposite expression pattern. Because dormant GFP-LRCs are predominantly in G0 but appear poised to respond to microenvironmental cues, we also examined G1 cyclins and their catalytic Cdk partners. Cyclin D3 was specifically upregulated in GFP4 cells that had little to no expression of Cdk4/Cdk6 (Figure 7D). This was confirmed by single-cell Fluidigm quantitative PCR (qPCR) (Figure 7E). These measurements demonstrated that Cdk6 was more differentially regulated than Cdk4; it was completely absent in GFP4 cells (Figure 7E). These data suggest that the lack of cyclin D3 catalytic partners Cdk4/Cdk6 holds G1 progression in check.
Transforming growth factor β (TGF-β) signaling has been implicated in HSC quiescence (Söderberg et al., 2009, Yamazaki et al., 2009, Yamazaki and Nakauchi, 2009) and is overrepresented in the GFP Hi upregulated gene sets. Further investigation revealed that expression of TGF-β upstream modulators, intercellular transducers, and downstream targets was elevated with increasing GFP label retention levels (Figure 7F). Confirmed genes include: Ltbp3, Fscn1, Pml, Cited2, Fstl1, Hipk2, Crebbp, Ep300, Smad 2, Smad 3, and Smad 7 (Figures S7D and S7E), and Tgm2 (Figure 7C). Interestingly, Ltbp3, Fscn1, Fstl1, and Tgm2 are all involved in extracellular matrix, cytoskeletal, and microenvironmental interactions. Ltbp3 was highly expressed only in GFP4 cells, suggesting involvement in the bioavailability of TGF-β in dormant HSCs.
In summary, the gene-expression landscape changes dramatically as dormant HSCs become activated and traverse through a divisional cascade. In dormant HSCs, the transcriptional and cell-cycle machineries are in repressive but poised states. It appears that dormant HSCs are actively interacting with their environment and that dramatic changes in these interactions are necessary for these cells to become activated.
Discussion
Our studies have addressed the functional behavior of HSPCs in the context of their homeostatic divisional history. We have determined that, with very few cell divisions, HSCs lose functional activities. We also show that accrued temporal divisional history outweighs both cell-surface phenotype and “snapshot” quiescence in determining HSC potency. Collectively, our results suggest that, during normal homeostasis, HSCs do not undergo self-renewal divisions. They also suggest that, once HSCs exit dormancy and initiate cell division, they will not return to full functional dormancy and are slated for extinction. Although these cells still bear an HSC phenotype, they are not identical functionally. Our studies suggest that we are endowed with a set number of HSCs that in normal situations is sufficient for lifelong hematopoiesis.
In contrast to previous viable LRC studies (Foudi et al., 2009, Wilson et al., 2008), we analyzed five compartments of cells with progressively diluted GFP in homeostatic-labeled and chased HSCs. We analyzed their functional, cellular, and molecular properties over the course of approximately eight cell divisions. To our surprise, initially highly labeled HSCs activated during the chase progressively lose their robust activity over a limited number of cell divisions.
We observed three distinct dormant CD150 populations that correlated with declining repopulation and self-renewal potential. Cells with the highest CD150 levels have the most robust and durable self-renewal potentials. This extends the previously observed functional heterogeneity defined by CD150 expression levels to the dormant HSC pool (Kent et al., 2009, Morita et al., 2010, Weksberg et al., 2008). Specific expression of transcriptional modifiers like Smarca2 and Mllt3 highlight the importance of epigenetic regulation in these cells.
CD34+ LSK cells have been shown to have early, but not sustained, multilineage reconstitution (Osawa et al., 1996). LSKCD34+CD135− cells were defined as ST-HSCs with limited self-renewal activity (Yang et al., 2005). Wilson et al. (2008) also defined CD48−CD150+CD135−CD34+ cells as part of the MPP population within LSK cells by surface phenotype, but not functional, assays. Our studies revealed a significant amount of CD34+ cells in the dormant fraction that display robust in vitro and in vivo potentials, including self-renewal. We showed that, as a percentage of whole BM, the CD34+ fraction was much lower than its CD34− counterpart in the GFP4 population. Therefore, the previous studies might not have captured these rare cells. In addition, functional assessment of CD34+CD150+ cells has not previously been undertaken. One study showed LT repopulation with LSKCD34+Mpl+ cells, although self-renewal was not assessed in secondaries (Yoshihara et al., 2007). This suggests that, with the addition of label-retention, adult CD34+ cells have more potential than previously described. On a cell-for-cell basis, dormant CD34+ cells appear to be as robust as dormant CD34− cells. Ultimately, the initially transplanted GFP Hi CD34− cells outperformed the GFP Hi CD34+ cells in the ability to remake BM HSC populations in secondary mice. Perhaps tertiary transplantation might reveal decreased self-renewal in this cell population. These data also suggest that there is a hierarchical structure within the dormant HSC population with the LSKCD48−CD135−CD34−CD150+ phenotype as the anchor.
Previous studies have shown that cells isolated in different phases of the cell cycle have differential activities. HSCs in G0 have a superior LT reconstitution potential (Passegué et al., 2005), and proliferating HSCs in S/G2/M have an engraftment defect (Bowie et al., 2006). These observations cannot explain our results as we examined G0 cells that differ only in their divisional histories. Although our in vitro assays are highly correlative with in vivo activity (Hackney et al., 2002, Kent et al., 2009), transplant experiments will extend these studies.
It is unclear how divisional history progressively reduces stem cell function. The G1 cell-cycle phase is thought to be the stage when intrinsic and extrinsic cues are processed for self-renewal, differentiation, or apoptosis decisions (Massagué, 2004). It has been proposed that prolonged exposure to stimuli that drive G1 progression facilitates differentiation rather than self-renewal (Orford and Scadden, 2008). During normal homeostasis, cells with increased divisional history accompanied by multiple transitions through G1 might accumulate differentiation signals and lose stem cell potential. However, our studies suggest that this does not necessarily manifest as a change in cell-surface phenotype. Even if cells return to G0 after several rounds of division, the effect could be irreversible, because the epigenetic landscape and gene-expression programs have changed during previous cell cycling.
In support of this hypothesis, our data reveal unique gene-expression repertoires with each additional division during the initial cell-cycle rounds, as well as genes regulated progressively along the GFP gradient. Genes involved in cell-cycle regulation, energetics, DNA replication/repair, and proliferation were uniquely expressed when cells proceeded through the divisional cascade, whereas genes involved in transcriptional regulation, signal transduction, and cell-to-cell/matrix interaction were upregulated in GFP Hi LRCs. This suggests a continual crosstalk of dormant cells and their microenvironment such that they are poised to rapidly make critical cell-fate decisions. Strikingly, genes involved in niche communication were downregulated immediately when cells exit the dormant pool. This may suggest that the cells leave a niche that maintains quiescence and relocate to a different, more active niche. This is supported by the loss of HSCs returning to G0 after leaving dormancy. It will be necessary to visualize these cells in situ to determine if they are located in different anatomical spaces within the BM. In addition, different sets of epigenetic modifier genes are regulated in either direction along the GFP-dilution cascade, indicating that epigenetic control plays an important role in relating cell division to stem cell fate decisions. Genes involved in apoptosis are enriched in parallel with GFP retention, whereas DNA repair genes are enriched with GFP loss. This suggests that nonproliferating cells undergo apoptosis rather than DNA damage repair to maintain genomic integrity within the population.
Our profiling studies highlighted cell cycle and TGF-β pathway genes. Differentially expressed cell-cycle genes of most interest were Cdkn1c (p57) and Ccnd3 along with its catalytic partners Cdk4 and Cdk6. It has been suggested that quiescent HSCs might access the cell cycle close to the “restriction point” between early and late G1 (Orford and Scadden, 2008). At this point, cells become independent of the mitogenic signaling that induces cyclin D expression (Malumbres and Barbacid, 2001). As such, dormant HSCs would bypass the sensitive early G1 phase and avoid differentiation cues. High expression of p57 specifically in dormant HSCs is interesting as it is the only gene of its class that is induced by TGF-β (Scandura et al., 2004). TGF-β signaling has pleiotropic positive and negative hematopoietic effects, depending on the target cells and their context. Others have observed diverse roles for TGF-β in regulating HSC quiescence. One study suggests that it directly inhibits lipid-raft clustering and upregulates p57 to specifically suppress the activation of cyclin D/Cdk complexes in hibernating HSCs and thus prevents cell-cycle entry (Yamazaki et al., 2009). Our studies support these findings and highlight the lack of Cdk4/Cdk6 in dormant HSC. Another study found differential responses to TGF-β1 in myeloid- and lymphoid-biased HSCs and suggested that this mechanism may explain the differential activation of these subsets (Challen et al., 2010). It is highly likely that the TGF-β pathway plays specific and yet to be understood roles in the regulation of dormant and activated HSCs.
Our studies have elucidated aspects of dormant HSCs. Interestingly, temporally defined dormancy outweighs other indicators of HSC potency. Why HSCs start losing stem cell potential upon cell division during normal homeostasis is unclear. HSC self-renewal can only be demonstrated by transplantation studies and transplantation is a high-stress condition. Nevertheless, despite self-renewal under stress conditions, HSCs cannot be serially transplanted indefinitely and aging incurs multiple defects. This suggests that understanding both homeostasis and stress self-renewal processes is necessary to exploit HSCs for therapeutic use. Our studies suggest a radical departure from existing dogma by suggesting that HSCs do not self-renew during normal homeostasis. On the other hand, we do recognize that HSCs can self-renew when under stress. Nevertheless, we still challenge the existing dogma that HSCs self-renew to their initial functional potential once they initiate cell division under any condition. HSCs may not be immortal, nor should they be; in fact, this is the hallmark of leukemia.
Experimental Procedures
Mice
HuCD34-tTA mice were from Dr. Dan Tenen (Harvard Medical School). Tg (tetO-HIST1H2BJ/GFP) 47Efu/J (TetO-H2BGFP), C57BL/6 (B6), and congenic B6.SJL-Ptprca Pepcb/BoyJ (SJL) mice were purchased from The Jackson Laboratory, bred, and maintained in house. The huCD34-tTA and TetO-H2BGFP strains were backcrossed to B6 mice for at least ten generations. Double-transgenic 34/H2B mice were derived by crossbreeding. Dox (Sigma) was administered to 6–8-week-old 34/H2B mice at 1 mg/ml in drinking water and changed two times per week for 0.5–16 weeks. Animal experiments were approved by the Institutional Animal Care and Use Committee and conducted in accordance with the Animal Welfare Act.
Flow Cytometric Analysis, Sorting, and Cell-Cycle Analyses
BM analyses: BM was harvested and stained as previously described (Schaniel et al., 2011). Cells were analyzed on an LSR II Flow Cytometer and/or sorted using FACSAriaII, FACSVantage, Influx (all BD Biosciences), or MoFlo (Beckman Coulter Genomics) cell sorters.
Ki-67 Analysis
Lineage and CD48-depleted BM was stained for Sca1, cKit, CD150, and Ki-67 as previously described (Schaniel et al., 2011) and analyzed on an LSR II.
Py/Ho Analysis and G0 Cell Assay
These analyses were performed as previously described (Passegué et al., 2005).
Hematopoietic Assays
In Vitro
CFU assays were performed in Methocult (M3434; Stem Cell Technologies) according to manufacturer’s instructions. LD-CAFC, LTC-CAFC, and LTC-IC assays were done after 4 weeks of LTC on AFT024 cells as previously described (Moore et al., 1997, Schaniel et al., 2011). All values were normalized to 100 initial cell equivalents seeded into LTCs, and limiting dilution frequencies were calculated by Poisson statistics (Taswell, 1981).
In Vivo
SJL (CD45.1) mice were irradiated (10 Gy) and transplanted with freshly isolated 34/H2B (CD45.2) donor cells mixed with BM from SJL mice for competitive repopulation assays. For secondary transplantation, pooled BM from each group was transplanted into secondary SJL mice without competitor cells. Peripheral blood was collected at posttransplant intervals and analyzed for the presence of CD45.2 contribution to T, B, and myeloid cell populations. BM cells from individual primary and secondary mice were analyzed for CD45.2 contribution to whole BM and defined HSPC compartments.
Microarray and Bioinformatics Analysis
LSK cells with five different levels of GFP from 0–4 were isolated by fluorescence-activated cell sorting from BM cells taken from multiple cohorts of mice after 12 weeks of Dox treatment. Total RNA was in vitro amplified before hybridization to Affymetrix Mouse 430 2.0 3′ arrays. Microarray data were screened using two statistical criteria to measure the consistencies between biological replicas and probe sets for each gene followed by K-means clustering.
qPCR and Fluidigm Gene-Expression Assays
RNA isolated from BM cells was amplified before analysis by qPCR using the SybrGreen (Applied Biosystems) method. Freshly sorted single cells or 200 cell mixtures were preamplified with TaqMan Assay Mix (Applied Biosystems) and then processed on 96:96 Fluidigm Dynamic Arrary IFCs with a BioMark HD system and then analyzed using BioMark Real-Time PCR Analysis Software (Fluidigm).
See Supplemental Experimental Procedures for details, antibodies, and primers.
Statistical Analysis
Statistical significance was determined using unpaired two-tailed Student’s t test with p ≤ 0.05 considered significant.
Acknowledgments
We thank Dr. Dan Tenen (Harvard Medical School) for the huCD34tTA mouse, Dr. Ihor Lemischka and Dr. Saghi Ghaffari for helpful discussions and critical reading of the manuscript, and the Mt. Sinai Flow Cytometry and Mouse Facilities. K.M. was supported by grants from NIH 2RO1HL58739 and the NJ Commission on Science and Technology 06-2042-014-75.
Published: March 20, 2014
Footnotes
This is an open-access article distributed under the terms of the Creative Commons Attribution-NonCommercial-No Derivative Works License, which permits non-commercial use, distribution, and reproduction in any medium, provided the original author and source are credited.
Supplemental Information includes Supplemental Experimental Procedures, seven figures, and four tables and can be found with this article online at http://dx.doi.org/10.1016/j.stemcr.2014.01.016.
Accession Numbers
The microarray expression data were deposited in the Gene Expression Omnibus database, accession number GSE48261.
Supplemental Information
References
- Bowie M.B., McKnight K.D., Kent D.G., McCaffrey L., Hoodless P.A., Eaves C.J. Hematopoietic stem cells proliferate until after birth and show a reversible phase-specific engraftment defect. J. Clin. Invest. 2006;116:2808–2816. doi: 10.1172/JCI28310. [DOI] [PMC free article] [PubMed] [Google Scholar]
- Challen G.A., Goodell M.A. Promiscuous expression of H2B-GFP transgene in hematopoietic stem cells. PLoS ONE. 2008;3:e2357. doi: 10.1371/journal.pone.0002357. [DOI] [PMC free article] [PubMed] [Google Scholar]
- Challen G.A., Boles N.C., Chambers S.M., Goodell M.A. Distinct hematopoietic stem cell subtypes are differentially regulated by TGF-beta1. Cell Stem Cell. 2010;6:265–278. doi: 10.1016/j.stem.2010.02.002. [DOI] [PMC free article] [PubMed] [Google Scholar]
- Cheshier S.H., Morrison S.J., Liao X., Weissman I.L. In vivo proliferation and cell cycle kinetics of long-term self-renewing hematopoietic stem cells. Proc. Natl. Acad. Sci. USA. 1999;96:3120–3125. doi: 10.1073/pnas.96.6.3120. [DOI] [PMC free article] [PubMed] [Google Scholar]
- de Haan G., Ploemacher R. The cobblestone-area-forming cell assay. Methods Mol. Med. 2002;63:143–151. doi: 10.1385/1-59259-140-X:143. [DOI] [PubMed] [Google Scholar]
- Foudi A., Hochedlinger K., Van Buren D., Schindler J.W., Jaenisch R., Carey V., Hock H. Analysis of histone 2B-GFP retention reveals slowly cycling hematopoietic stem cells. Nat. Biotechnol. 2009;27:84–90. doi: 10.1038/nbt.1517. [DOI] [PMC free article] [PubMed] [Google Scholar]
- Hackney J.A., Charbord P., Brunk B.P., Stoeckert C.J., Lemischka I.R., Moore K.A. A molecular profile of a hematopoietic stem cell niche. Proc. Natl. Acad. Sci. USA. 2002;99:13061–13066. doi: 10.1073/pnas.192124499. [DOI] [PMC free article] [PubMed] [Google Scholar]
- Kent D.G., Copley M.R., Benz C., Wöhrer S., Dykstra B.J., Ma E., Cheyne J., Zhao Y., Bowie M.B., Zhao Y. Prospective isolation and molecular characterization of hematopoietic stem cells with durable self-renewal potential. Blood. 2009;113:6342–6350. doi: 10.1182/blood-2008-12-192054. [DOI] [PubMed] [Google Scholar]
- Kiel M.J., Yilmaz O.H., Iwashita T., Yilmaz O.H., Terhorst C., Morrison S.J. SLAM family receptors distinguish hematopoietic stem and progenitor cells and reveal endothelial niches for stem cells. Cell. 2005;121:1109–1121. doi: 10.1016/j.cell.2005.05.026. [DOI] [PubMed] [Google Scholar]
- Kiel M.J., He S., Ashkenazi R., Gentry S.N., Teta M., Kushner J.A., Jackson T.L., Morrison S.J. Haematopoietic stem cells do not asymmetrically segregate chromosomes or retain BrdU. Nature. 2007;449:238–242. doi: 10.1038/nature06115. [DOI] [PMC free article] [PubMed] [Google Scholar]
- Malumbres M., Barbacid M. To cycle or not to cycle: a critical decision in cancer. Nat. Rev. Cancer. 2001;1:222–231. doi: 10.1038/35106065. [DOI] [PubMed] [Google Scholar]
- Massagué J. G1 cell-cycle control and cancer. Nature. 2004;432:298–306. doi: 10.1038/nature03094. [DOI] [PubMed] [Google Scholar]
- Miller C.L., Dykstra B., Eaves C.J. Characterization of mouse hematopoietic stem and progenitor cells. Curr. Protoc. Immunol. 2008;Chapter 22:2. doi: 10.1002/0471142735.im22b02s80. 31. [DOI] [PubMed] [Google Scholar]
- Moore K.A., Ema H., Lemischka I.R. In vitro maintenance of highly purified, transplantable hematopoietic stem cells. Blood. 1997;89:4337–4347. [PubMed] [Google Scholar]
- Morita Y., Ema H., Nakauchi H. Heterogeneity and hierarchy within the most primitive hematopoietic stem cell compartment. J. Exp. Med. 2010;207:1173–1182. doi: 10.1084/jem.20091318. [DOI] [PMC free article] [PubMed] [Google Scholar]
- Nygren J.M., Bryder D. A novel assay to trace proliferation history in vivo reveals that enhanced divisional kinetics accompany loss of hematopoietic stem cell self-renewal. PLoS ONE. 2008;3:e3710. doi: 10.1371/journal.pone.0003710. [DOI] [PMC free article] [PubMed] [Google Scholar]
- Orford K.W., Scadden D.T. Deconstructing stem cell self-renewal: genetic insights into cell-cycle regulation. Nat. Rev. Genet. 2008;9:115–128. doi: 10.1038/nrg2269. [DOI] [PubMed] [Google Scholar]
- Osawa M., Hanada K., Hamada H., Nakauchi H. Long-term lymphohematopoietic reconstitution by a single CD34-low/negative hematopoietic stem cell. Science. 1996;273:242–245. doi: 10.1126/science.273.5272.242. [DOI] [PubMed] [Google Scholar]
- Passegué E., Wagers A.J., Giuriato S., Anderson W.C., Weissman I.L. Global analysis of proliferation and cell cycle gene expression in the regulation of hematopoietic stem and progenitor cell fates. J. Exp. Med. 2005;202:1599–1611. doi: 10.1084/jem.20050967. [DOI] [PMC free article] [PubMed] [Google Scholar]
- Pietras E.M., Warr M.R., Passegué E. Cell cycle regulation in hematopoietic stem cells. J. Cell Biol. 2011;195:709–720. doi: 10.1083/jcb.201102131. [DOI] [PMC free article] [PubMed] [Google Scholar]
- Radomska H.S., Gonzalez D.A., Okuno Y., Iwasaki H., Nagy A., Akashi K., Tenen D.G., Huettner C.S. Transgenic targeting with regulatory elements of the human CD34 gene. Blood. 2002;100:4410–4419. doi: 10.1182/blood-2002-02-0355. [DOI] [PubMed] [Google Scholar]
- Scandura J.M., Boccuni P., Massagué J., Nimer S.D. Transforming growth factor beta-induced cell cycle arrest of human hematopoietic cells requires p57KIP2 up-regulation. Proc. Natl. Acad. Sci. USA. 2004;101:15231–15236. doi: 10.1073/pnas.0406771101. [DOI] [PMC free article] [PubMed] [Google Scholar]
- Schaniel C., Moore K.A. Genetic models to study quiescent stem cells and their niches. Ann. N Y Acad. Sci. 2009;1176:26–35. doi: 10.1111/j.1749-6632.2009.04608.x. [DOI] [PMC free article] [PubMed] [Google Scholar]
- Schaniel C., Sirabella D., Qiu J., Niu X., Lemischka I.R., Moore K.A. Wnt-inhibitory factor 1 dysregulation of the bone marrow niche exhausts hematopoietic stem cells. Blood. 2011;118:2420–2429. doi: 10.1182/blood-2010-09-305664. [DOI] [PMC free article] [PubMed] [Google Scholar]
- Söderberg S.S., Karlsson G., Karlsson S. Complex and context dependent regulation of hematopoiesis by TGF-beta superfamily signaling. Ann. N Y Acad. Sci. 2009;1176:55–69. doi: 10.1111/j.1749-6632.2009.04569.x. [DOI] [PubMed] [Google Scholar]
- Takizawa H., Regoes R.R., Boddupalli C.S., Bonhoeffer S., Manz M.G. Dynamic variation in cycling of hematopoietic stem cells in steady state and inflammation. J. Exp. Med. 2011;208:273–284. doi: 10.1084/jem.20101643. [DOI] [PMC free article] [PubMed] [Google Scholar]
- Taswell C. Limiting dilution assays for the determination of immunocompetent cell frequencies. I. Data analysis. J. Immunol. 1981;126:1614–1619. [PubMed] [Google Scholar]
- Weksberg D.C., Chambers S.M., Boles N.C., Goodell M.A. CD150- side population cells represent a functionally distinct population of long-term hematopoietic stem cells. Blood. 2008;111:2444–2451. doi: 10.1182/blood-2007-09-115006. [DOI] [PMC free article] [PubMed] [Google Scholar]
- Wilson A., Laurenti E., Oser G., van der Wath R.C., Blanco-Bose W., Jaworski M., Offner S., Dunant C.F., Eshkind L., Bockamp E. Hematopoietic stem cells reversibly switch from dormancy to self-renewal during homeostasis and repair. Cell. 2008;135:1118–1129. doi: 10.1016/j.cell.2008.10.048. [DOI] [PubMed] [Google Scholar]
- Yamazaki S., Nakauchi H. Insights into signaling and function of hematopoietic stem cells at the single-cell level. Curr. Opin. Hematol. 2009;16:255–258. doi: 10.1097/MOH.0b013e32832c6705. [DOI] [PubMed] [Google Scholar]
- Yamazaki S., Iwama A., Takayanagi S., Eto K., Ema H., Nakauchi H. TGF-beta as a candidate bone marrow niche signal to induce hematopoietic stem cell hibernation. Blood. 2009;113:1250–1256. doi: 10.1182/blood-2008-04-146480. [DOI] [PubMed] [Google Scholar]
- Yang L., Bryder D., Adolfsson J., Nygren J., Månsson R., Sigvardsson M., Jacobsen S.E. Identification of Lin(-)Sca1(+)kit(+)CD34(+)Flt3- short-term hematopoietic stem cells capable of rapidly reconstituting and rescuing myeloablated transplant recipients. Blood. 2005;105:2717–2723. doi: 10.1182/blood-2004-06-2159. [DOI] [PubMed] [Google Scholar]
- Yoshihara H., Arai F., Hosokawa K., Hagiwara T., Takubo K., Nakamura Y., Gomei Y., Iwasaki H., Matsuoka S., Miyamoto K. Thrombopoietin/MPL signaling regulates hematopoietic stem cell quiescence and interaction with the osteoblastic niche. Cell Stem Cell. 2007;1:685–697. doi: 10.1016/j.stem.2007.10.020. [DOI] [PubMed] [Google Scholar]
Associated Data
This section collects any data citations, data availability statements, or supplementary materials included in this article.