

Abstract
Purpose
Prediction models for age-related macular degeneration (AMD) based on case-control studies have a tendency to overestimate risks. The aim of this study is to develop a prediction model for late AMD based on data from population-based studies.
Design
Three population-based studies: the Rotterdam Study (RS), the Beaver Dam Eye Study (BDES), and the Blue Mountains Eye Study (BMES) from the Three Continent AMD Consortium (3CC).
Participants
People (n = 10106) with gradable fundus photographs, genotype data, and follow-up data without late AMD at baseline.
Methods
Features of AMD were graded on fundus photographs using the 3CC AMD severity scale. Associations with known genetic and environmental AMD risk factors were tested using Cox proportional hazard analysis. In the RS, the prediction of AMD was estimated for multivariate models by area under receiver operating characteristic curves (AUCs). The best model was validated in the BDES and BMES, and associations of variables were re-estimated in the pooled data set. Beta coefficients were used to construct a risk score, and risk of incident late AMD was calculated using Cox proportional hazard analysis. Cumulative incident risks were estimated using Kaplan–Meier product-limit analysis.
Main Outcome Measures
Incident late AMD determined per visit during a median follow-up period of 11.1 years with a total of 4 to 5 visits.
Results
Overall, 363 participants developed incident late AMD, 3378 participants developed early AMD, and 6365 participants remained free of any AMD. The highest AUC was achieved with a model including age, sex, 26 single nucleotide polymorphisms in AMD risk genes, smoking, body mass index, and baseline AMD phenotype. The AUC of this model was 0.88 in the RS, 0.85 in the BDES and BMES at validation, and 0.87 in the pooled analysis. Individuals with low-risk scores had a hazard ratio (HR) of 0.02 (95% confidence interval [CI], 0.01–0.04) to develop late AMD, and individuals with high-risk scores had an HR of 22.0 (95% CI, 15.2–31.8). Cumulative risk of incident late AMD ranged from virtually 0 to more than 65% for those with the highest risk scores.
Conclusions
Our prediction model is robust and distinguishes well between those who will develop late AMD and those who will not. Estimated risks were lower in these population-based studies than in previous case-control studies.
Age-related macular degeneration (AMD) is the leading cause of blindness in the elderly of industrialized countries.1,2 Approximately 21 million elderly individuals are affected worldwide, and this number is expected to increase dramatically with the aging population.3,4 Age-related macular degeneration can be divided into several stages: early AMD, characterized by subcellular deposits (drusen) and pigmentary changes, and late AMD, subdivided into atrophy of the retinal pigment epithelium (dry AMD) and choroidal neovascularization (wet AMD). Despite improved treatment options, late AMD can cause irreversible blindness, whereas severe stages of early AMD are mostly asymptomatic but signal a high risk of progression to late AMD.5
Age, early AMD phenotype, and genetic and environmental factors play important roles in the pathogenesis of late AMD.6–11 These factors may be used to predict this end stage and to identify high-risk individuals. Reasons for assessing predictive values may be risk-dependent (personalized) patient care and surveillance strategies for therapy. Future intervention research, such as randomized, controlled clinical trials, can use prediction models to select individuals with a high risk of outcome events.
Previously reported prediction models were based on selections of cases and nonaffected controls.12–28 Most studies compared only the extreme ends of disease, excluding the majority of the population with an intermediate disease risk. This has inherent methodological concerns because the disease risk is overestimated by design. Population-based studies include a whole spectrum of risk levels, and therefore findings from these studies would be more generalizable29 and better suited for clinical implementation.
In this study, we present a prediction model for late AMD based on population-based cohort studies from 3 continents. We optimized a prediction model in one of the cohorts and subsequently validated it in the other 2 cohorts. We included established genetic, environmental, and clinical risk factors in the model, assessed relative and cumulative risks, and provided a risk score that can be used to estimate the risk of AMD in individuals.
Methods
For this article, we followed the guidelines for genetic risk prediction studies.30
Study Populations
The Three Continent AMD Consortium (3CC) consists of 4 population-based studies: the European Rotterdam Study (RS), the American Beaver Dam Eye Study (BDES), the Los Angeles Latino Eye Study, and the Australian Blue Mountains Eye Study (BMES). For the purposes of this study, the Los Angeles Latino Eye Study was excluded because of the absence of genotype and follow-up data.
The RS is a prospective, population-based cohort study investigating chronic diseases in the elderly. All inhabitants aged 55 years and older living in a suburb of Rotterdam, The Netherlands, were invited to participate in the study.31,32 Of the initial cohort of 10 275 eligible individuals, 7983 (78% of those eligible) participated in the overall study (98% were white). The ophthalmologic part began later and included 6780 participants (78% of those eligible). Baseline examinations took place from 1990 to 1993, and 4 follow-up examinations were performed in 1993–1995, 1997–1999, 2002–2004, and 2009–2011. The Erasmus Medical Center Ethics Committee approved the study, which complies with the Declaration of Helsinki. All participants gave written informed consent for participation in the study.
The BDES is a prospective cohort study investigating eye diseases among the population of Beaver Dam, Wisconsin.33 To identify all residents in the city or township of Beaver Dam who were aged 43 to 84 years, a private census was performed from 1987 to 1988. Of the 5924 eligible individuals, 4926 (83% of those eligible) participated in the baseline examination between 1988 and 1990 (99% were white). There were follow-up examinations every 5 years: 1993–1995, 1998–2000, 2003–2005, and 2008–2010. The BDES was approved by the institutional review board from the University of Wisconsin-Madison and adhered to the tenants of the Declaration of Helsinki. All participants provided signed, informed consent for participation in the study.
The BMES is a prospective cohort study of eye diseases and other health outcomes in an urban population.34 All residents aged 49 years or older, living in 2 postcode areas of the Blue Mountains region in West Sydney, Australia, were invited to participate in the study. In 1992–1994, baseline examinations were performed in 3654 participants (82.4% of those eligible). Reexaminations were performed after 5, 10, and 15 years (in 1997–1999, 2002–2004, and 2007–2009, respectively). All BMES examinations were approved by the human research ethics committees of the Western Sydney Area Health Service and the University of Sydney and complied with the Declaration of Helsinki. All participants provided written, informed consent for participation in the study.
Participants were eligible for the current analysis when genotype data, as well as gradable fundus photographs at baseline and at least 1 follow-up eye examination were available (Fig 1, available at http://aaojournal.org). People with late AMD at baseline were excluded. This resulted in 4753 (RS), 3542 (BDES), and 1811 (BMES) participants available for analysis, with a median follow-up of 10.7 years in RS (interquartile range [IQR], 12.8), 15.6 years in BDES (IQR, 10.4), and 11.8 years in BMES (IQR, 5.6). In total, 10 106 participants with a median follow-up of 11.1 years (IQR, 11.0) were included in the analysis. To investigate possible selection bias, we analyzed whether people excluded from this study differed in the baseline level of AMD from those who were included. The 2 groups did not differ in early AMD levels (10–40) after adjustment for age and sex (P = 0.95).
Diagnosis of Age-Related Macular Degeneration
All participants underwent fundus photography after pharmacologic mydriasis. Fundus transparencies of all studies were graded according to the Wisconsin Age-Related Maculopathy Grading35,36 by trained graders under the supervision of senior retinal specialists or senior researchers (RS: P.T.V.M.dJ., J.R.V., C.C.W.K.; BDES: B.E.K.K., R.K.; BMES: P.M., J.J.W.). The graded fundus photographs were classified using a classification common to all studies: the 3CC AMD severity scale37 (Table 1, available at http://aaojournal.org). All prevalent and incident late AMD cases from each of these 3 studies were cross-checked by investigators of the other 2 studies, with consensus obtained via discussion during multiple teleconferences. The eyes of each participant were graded and classified separately, and the eye with the more severe grade was used to classify the person.
Genotyping
Genomic DNA was extracted from peripheral blood leukocytes. All eligible study participants in the RS were genotyped with the Illumina Infinium II HumanHap550 array or Taqman assays (Applied Biosystems, Foster City, CA). HapMap CEU data (release #22) was used for imputation.
DNA from BDES participants was extracted from the buffy coats of blood obtained at baseline examinations or subsequent examinations that were stored frozen at −80°C. DNA samples arrayed in 96-well plates were submitted for genotyping via an Illumina iSelect Custom Genotyping Panel (Illumina Inc., Hayward, CA) at the Genomics Core Facility at Case Western Reserve University or via the KASP Assay at LCG Genomics (Teddington, Middlesex, UK). The data collected were analyzed using Illumina's Genome Studio or the KASP SNP Genotyping System. The assays were controlled for quality by examining cluster separation values and call frequency. Untyped single nucleotide polymorphisms (SNPs) were imputed using HapMap CEU (release #22) as reference.
In the BMES, all participants with DNA available were genotyped using Illumina Human670-Quad v1 custom array at the Wellcome Trust Centre for Human Genetics, Sanger Institute, Cambridge, UK, as part of the Wellcome Trust Case Control Consortium 2. A smaller subset of participants (N = 1356) was also independently genotyped using the Illumina 610-Quad genotyping array at the Hunter Medical Research Institute, Newcastle, Australia. After quality control, the genotyped data were imputed from the 1000 Genomes (version 1) reference using IMPUTE software.
Selection of Single Nucleotide Polymorphisms
For selection of AMD genes, we reviewed publications on AMD genetics38,39 and prediction of AMD.12–28 From these, we selected 41 tag SNPs that were available in all 3 cohorts and that were not in linkage disequilibrium (r2 < 0.60). Genotypes of SNPs were coded as 0 for carriers of 2 major alleles, 1 for the heterozygous genotype, and 2 for carriers of 2 minor alleles. When none of the cases were carriers of 2 minor alleles, genotypes of the SNPs were coded as 0 for carriers of 2 major alleles and 1 for all carriers of at least 1 minor allele. As a first step, each SNP was tested for association with late AMD in all 3 cohorts.
For each locus with multiple SNPs, we performed a backward Cox proportional hazard analysis to determine the best predictive SNPs for incident late AMD within each locus with data from the RS.
Assessment of Nongenetic Variables
All nongenetic variables used in the analyses were assessed using baseline data. Information on cigarette smoking was obtained in an interview at baseline and categorized as never, former, and current. Height, weight, and blood pressure were measured at the beginning of baseline examination. Body mass index (BMI) was calculated by dividing weight (kilograms) by the height (meters squared). The BMI variable was categorized as not overweight or obese (BMI<25) and overweight or obese (BMI>25). Age (years) at baseline was categorized in 3 categories; <65, 65–75, and >75 years. Baseline AMD grading was entered into the analysis as categorized variables with levels 10 to 40.
Statistical Analyses
Throughout the entire study, incident late AMD was used as the outcome variable; nonincident late AMD, including those participants remaining at an early AMD stage, was used as the reference group. All analyses were performed using SPSS version 20.0 (SPSS Inc., Chicago, IL).
Variables were analyzed for association with incident late AMD in the 3 cohorts using Cox proportional hazard analysis, adjusting for age and sex. We constructed 5 different models based on a minimal and a maximal selection of clinical, genetic, and environmental factors. Model 1 was a minimal model including only age and sex; model 2 was a nongenetic model including age, sex, and environmental and ocular factors; model 3 was a minimal genetic model including age, sex, and major genetic AMD risk variants (CFH Y402H, ARMS2 A69S, C3 R102G, C2 L9H, CB R32Q); model 4 was a maximal genetic model including age, sex, and 26 genetic AMD risk variants (see “Selection of Single Nucleotide Polymorphisms”); and model 5 was a maximal gene–environmental model including age, sex, environmental and ocular factors, and the 26 genetic AMD risk variants. For each model, we calculated the area under the curve (AUC) of incident late AMD in the RS and validated the best model in the BDES/BMES.
Subsequently, we estimated the association of all variables in the best model using multivariate Cox proportional hazard analysis in the pooled dataset of all 3 cohorts and calculated the AUC. Calibration of the model was tested using the Hosmer–Lemeshow test. This goodness-of-fit test shows how well the predicted risks match the observed risks. To test whether nonmajor genetic AMD risk variants could be discarded from this model without jeopardizing the AUC, backward regression (eliminating SNPs with P > 0.05) using Cox proportional hazard analysis was carried out and the AUC of the new model was calculated within the pooled dataset. In this dataset, we estimated the beta coefficient of each variable from the best model using multivariate Cox proportional hazard analysis. The estimated beta coefficient of a variable was the individual risk score of that variable. Next, we created a summary risk score based on the sum of the beta coefficients from the multivariate Cox proportional hazard analysis. Risk scores were rounded off, and frequencies of the risk scores were plotted stratified for incident late AMD and no AMD. We calculated the risk of incident late AMD with the middle risk score (3) as the reference using Cox proportional hazard analysis. Risk scores at the extreme ends were pooled to increase sample size because of limited numbers.
We calculated the cumulative risk of incident late AMD per risk score. We assigned the age of onset for incident late AMD as the median between the examination at which late AMD was first observed and the previous examination. For participants who did not develop late AMD, we used age at last examination for censoring. All participants aged 90+ years were censored at age 90 years to maintain unbiased estimates. Risks were calculated using Kaplan–Meier product-limit analysis. Participants who died or were lost to follow-up were censored at the time of the last examination. Cumulative risks stratified for the risk score were compared with the overall cumulative risk based on incidence of late AMD (prior risk) using log-rank tests of equality (Mantel–Cox).
Missing data were encountered in the analysis of each model. Only participants with data on all variables in the model entered the analysis.
Results
In total, 363 participants developed incident late AMD during a median follow-up time of 11.1 years (IQR, 11.0), of whom 132 were in the RS (follow-up 10.7 years; IQR, 12.8), 153 were in the BDES (follow-up 15.6 years; IQR, 10.4), and 78 were in the BMES (follow-up 11.8 years; IQR, 5.6). Incidence rates for the 3 studies were 2.89, 2.96, and 3.66 per 1000 person-years for the RS, BDES, and BMES, respectively. The distribution of demographic characteristics and environmental risk factors differed slightly among the 3 cohorts (Table 2). Because the inclusion criteria for age were higher than for the other studies, participants in the RS were older. Early AMD (level 20–40) at baseline was more frequent in RS participants, BMI was higher in BDES participants, and current smoking was less frequent in BMES participants. The frequency of genetic risk alleles was not significantly different among the 3 studies, although there were slight differences in genotype distributions. Visual inspection of a principle component analysis of all genetic data against HapMap CEU data (National Center for Bio-technology Information build 36, release 22) as reference showed similar plots for the 3 cohorts (data not shown).
Table 2. General Characteristics of Participants Included in the Analysis.
| Age Inclusion Variables | RS age 55+ (N = 4753), |
BDES age 45+ (N = 3542), |
BMES age 49+ (N = 1811), |
|---|---|---|---|
| Mean age, yrs (SD) | 67.6 (7.8) | 60.2 (10.4) | 64.0 (8.3) |
| Age categorized (yrs) | |||
| ≤65 | 42.5 | 67.3 | 56.8 |
| 65–75 | 39.1 | 24.0 | 33.1 |
| 75+ | 18.4 | 8.7 | 10.1 |
| Male sex | 42.4 | 42.5 | 42.8 |
| AMD baseline grade | |||
| Level 10 | 83.8 | 80.2 | 87.4 |
| Level 20 | 9.1 | 14.0 | 8.8 |
| Level 30 | 6.0 | 5.2 | 3.4 |
| Level 40 | 1.1 | 0.6 | 0.3 |
| Smoking | |||
| Never | 33.9 | 45.1 | 51.4 |
| Past | 43.5 | 34.9 | 37.1 |
| Current | 22.6 | 20.0 | 11.5 |
| Mean BMI, kg/m2 (SD) | 26.3 (3.6) | 28.8 (5.4) | 26.2 (4.2) |
| BMI categorized | |||
| ≤25 | 38.3 | 24.9 | 41.7 |
| 25+ | 61.7 | 75.1 | 58.3 |
| CFH (Y402H) rs1061170 | |||
| TT | 41.8 | 39.7 | 42.5 |
| TC | 45.0 | 47.0 | 46.5 |
| CC | 13.1 | 13.4 | 11.0 |
| CFH rs12144939 | |||
| GG | 64.3 | 64.2 | 65.1 |
| GT | 31.8 | 31.3 | 30.8 |
| TT | 3.9 | 4.5 | 4.1 |
| CFH rs800292 | |||
| GG | 52.6 | 59.8 | 56.9 |
| GA | 40.0 | 35.0 | 37.2 |
| AA | 5.3 | 5.3 | 6.0 |
| ARMS2 (A69S) rs10490924 | |||
| GG | 62.6 | 60.7 | 62.0 |
| GT | 33.6 | 34.8 | 34.0 |
| TT | 3.8 | 4.5 | 4.0 |
| C2/CFB (L9H) rs4151667 | |||
| TT | 90.8 | 90.7 | 91.1 |
| TA/AA | 9.2 | 9.3 | 8.9 |
| C2/CFB (R32Q) rs641153 | |||
| GG | 84.4 | 83.7 | 81.9 |
| GA/AA | 15.6 | 16.3 | 18.1 |
| C3 (R102G) rs2230199 | |||
| CC | 61.3 | 64.8 | 67.9 |
| CG | 33.9 | 31.2 | 28.8 |
| GG | 4.8 | 4.0 | 3.3 |
| C3 rs433594 | |||
| GG | 39.4 | 39.4 | 35.1 |
| GA | 45.7 | 46.0 | 49.3 |
| AA | 14.9 | 14.6 | 15.6 |
| CFI rs10033900 | |||
| CC | 27.4 | 25.6 | 27.6 |
| CT | 48.6 | 50.7 | 50.1 |
| TT | 24.0 | 23.7 | 22.4 |
| LPL rs256 | |||
| CC | 73.1 | 72.6 | 72.3 |
| CT/TT | 26.9 | 27.4 | 27.7 |
| LIPC rs12912415 | |||
| AA | 71.5 | 70.8 | 72.6 |
| AG/GG | 28.5 | 29.2 | 27.4 |
| MYRIP rs2679798 | |||
| AA | 30.3 | 34.5 | 29.9 |
| AG | 49.7 | 47.5 | 48.9 |
| GG | 20.0 | 18.1 | 21.1 |
| SKIV2L rs429608 | |||
| GG | 74.4 | 74.7 | 71.4 |
| GA | 23.6 | 23.1 | 26.7 |
| AA | 2.0 | 2.2 | 1.9 |
| ABAC1 rs1883025 | |||
| CC | 54.4 | 56.3 | 55.5 |
| CT | 39.3 | 38.3 | 37.8 |
| TT | 6.3 | 5.4 | 6.7 |
| CETP rs3764261 | |||
| CC | 46.4 | 44.5 | 45.3 |
| CA | 43.1 | 44.8 | 45.6 |
| AA | 10.5 | 10.7 | 9.1 |
| TIMP3 rs5749482 | |||
| GG | 78.7 | 78.0 | 75.8 |
| CG/CC | 21.3 | 22.0 | 24.2 |
| VEGFA rs943080 | |||
| CC | 24.9 | 26.6 | 26.6 |
| TC | 49.8 | 48.9 | 49.7 |
| TT | 25.3 | 24.4 | 23.8 |
| COL8A1 rs13081855 | |||
| GG | 82.4 | 82.8 | 82.3 |
| GT | 16.9 | 16.3 | 16.9 |
| TT | 0.7 | 0.9 | 0.8 |
| TNFRSF10A rs13278062 | |||
| TT | 28.0 | 26.3 | 27.0 |
| GT | 49.8 | 51.7 | 49.9 |
| GG | 22.2 | 21.9 | 23.1 |
| FRK/COL10A1 rs3812111 | |||
| TT | 42.9 | 38.6 | 39.1 |
| AT | 44.8 | 47.3 | 46.9 |
| AA | 12.3 | 14.1 | 14.0 |
| SLC16A8 rs8135665 | |||
| CC | 63.1 | 65.0 | 61.8 |
| CT | 32.7 | 31.3 | 33.7 |
| TT | 4.2 | 3.7 | 4.4 |
| ADAMTS9 rs6795735 | |||
| CC | 33.9 | 33.5 | 36.6 |
| TC | 50.1 | 49.2 | 46.2 |
| TT | 15.9 | 17.3 | 17.2 |
| TGFBR1 rs334353 | |||
| TT | 58.1 | 54.7 | 54.8 |
| GT | 36.1 | 39.0 | 38.8 |
| GG | 5.9 | 6.3 | 6.5 |
| RAD51B rs8017304 | |||
| AA | 38.2 | 38.8 | 41.9 |
| AG | 46.6 | 47.9 | 44.1 |
| GG | 15.2 | 13.3 | 14.0 |
| IER3/DDR1 rs3130783 | |||
| AA | 64.5 | 64.9 | 62.3 |
| AG | 32.0 | 26.0 | 33.4 |
| GG | 3.5 | 9.2 | 4.3 |
| B3GALTL rs9542236 | |||
| TT | 31.0 | 31.9 | 33.1 |
| CT | 48.7 | 49.3 | 48.1 |
| CC | 20.3 | 18.7 | 18.8 |
Data are percentages unless otherwise indicated.
AMD = age-related macular degeneration; BDES = Beaver Dam Eye Study; BMES = Blue Mountain Eye Study; BMI = body mass index; RS = Rotterdam Study; SD = standard deviation.
Risk factors were tested separately for association with incident late AMD in all cohorts, adjusting for age and sex (Table 3, available at http://aaojournal.org). Most SNPs in the genes CFH, ARMS2, and CFHR5 were significant in all 3 cohorts (P < 0.05). The SNPs in the genes LIPC, TIMP3, ADAMTS9, IER3/DDR1, TNFRSF10A, TGFBR1, and B3GALTL were not significant in any single cohort. In all other genes, SNPs were significant in at least 1 of the cohorts. In all 3 studies, increasing severity levels of early AMD stages at baseline, based on the 3CC AMD severity scale (Table 1, available at http://aaojournal.org), were associated with a highly significant risk of incident late AMD. Of the environmental risk factors, current smoking showed a significant association in the RS and BMES, but BMI showed no significant association with incident late AMD in all 3 cohorts. To determine the best set of markers for each locus, all SNPs were analyzed per locus in a multivariate Cox proportional hazard analysis. A total of 26 SNPs were found to be suitable for further analyses.
Prediction models were built using various sets of risk factors and tested in the RS (Table 4). Model 1, a minimal model that included only age and sex, providedan AUC of 0.60 (95% confidence interval [CI], 0.55–0.65). Adding environmental and ocular factors improved the AUC to 0.78 (95% CI, 0.74–0.82, model 2). Adding only major AMD genes to model 1 increased the AUC to 0.73 (95% CI, 0.69–0.78, model 3). Next, a maximal genetic model was created that included all 26 SNPs. This increased the AUC to 0.82 (95% CI, 0.79–0.86, model 4). Finally, we combined all variables from models 1 to 4 to assess the best possible prediction. This resulted in an AUC of 0.88 (95% CI, 0.85–0.90, model 5). Validation of this model in the pooled dataset of the BDES and BMES (Table 5) showed an AUC of 0.85 (95% CI, 0.82–0.88). To further improve the prediction model, we pooled all 3 cohorts and re-estimated the risks of the variables included in model 5 (Table 6). The AUC in the 3 cohorts combined was 0.87 (95% CI, 0.85–0.89), and the model had a good calibration (P = 0.55). We also investigated the possibility of minimalizing this model. By using backward regression, 13 SNPs could be excluded from the model and provided a somewhat lower AUC of 0.86 (95% CI, 0.84–0.88) (Table 7, available at http://aaojournal.org). The model with the best AUC in the 3 cohorts combined dataset was used for further analyses.
Table 4. Predictive Values for the Tested Models in the Rotterdam Study.
| Model | Variables | AUC (95% CI) | SE | No Late AMD/Late AMD |
|---|---|---|---|---|
| 1 | Minimal model | 0.60 (0.55–0.65) | 0.023 | 4621/132 |
| Age | ||||
| Sex | ||||
| 2 | Nongenetic model | 0.78 (0.74–0.82) | 0.022 | 4561/132 |
| Age | ||||
| Sex | ||||
| AMD baseline grade | ||||
| Smoking | ||||
| BMI | ||||
| 3 | Minimal genetic model | 0.73 (0.69–0.78) | 0.022 | 4226/121 |
| Age | ||||
| Sex | ||||
| ARMS2 rs10490924 | ||||
| CFH rs1061170 | ||||
| C2/CFB rs641153 | ||||
| C3 rs2230199 | ||||
| C2/CFB rs4151667 | ||||
| 4 | Maximal genetic model | 0.82 (0.79–0.86) | 0.016 | 4226/121 |
| Age | ||||
| Sex | ||||
| ARMS2 rs10490924 | ||||
| CFH rs800292 | ||||
| CFH rs12144939 | ||||
| CETP rs3764261 | ||||
| C2/CFB rs641153 | ||||
| COL8A1 rs13081855 | ||||
| C2/CFB rs4151667 | ||||
| C3 rs433594 | ||||
| TGBR1 rs334353 | ||||
| SKIV2L rs429608 | ||||
| C3 rs2230199 | ||||
| VEGFA rs943080 | ||||
| ADAMTS9 rs6795735 | ||||
| CFH rs1061170 | ||||
| TIMP3 rs5749482 | ||||
| IER3/DDR1 rs3130783 | ||||
| LPL rs256 | ||||
| MYRIP rs2679798 | ||||
| SLC16A8 rs8135665 | ||||
| RAD51B rs8017304 | ||||
| CFI rs10033900 | ||||
| FRK/COL10A1 rs3812111 | ||||
| ABCA1 rs1883025 | ||||
| B3GALTL rs9542236 | ||||
| LIPC rs12912415 | ||||
| TNFRSF10A rs13278062 | ||||
| 5 | Maximal gene-environment model | 0.88 (0.85–0.90) | 0.015 | 4171/121 |
| Age | ||||
| Sex | ||||
| ARMS2 rs10490924 | ||||
| CFH rs12144939 | ||||
| CFH rs800292 | ||||
| C3 rs433594 | ||||
| C2/CFB rs641153 | ||||
| TGBR1 rs334353 | ||||
| SKIV2L rs429608 | ||||
| CETP rs3764261 | ||||
| C2/CFB rs4151667 | ||||
| IER3/DDR1 rs3130783 | ||||
| C3 rs2230199 | ||||
| ADAMTS9 rs6795735 | ||||
| LPL rs256 | ||||
| COL8A1 rs13081855 | ||||
| SLC16A8 rs8135665 | ||||
| FRK/COL10A1 rs3812111 | ||||
| CFH rs1061170 | ||||
| TIMP3 rs5749482 | ||||
| VEGFA rs943080 | ||||
| MYRIP rs2679798 | ||||
| CFI rs10033900 | ||||
| TNFRSF10A rs13278062 | ||||
| RAD51B rs8017304 | ||||
| B3GALTL rs9542236 | ||||
| ABCA1 rs1883025 | ||||
| LIPC rs12912415 | ||||
| AMD baseline grade | ||||
| Smoking | ||||
| BMI |
AMD = age-related macular degeneration; AUC = area under the curve; BMI = body mass index; CI = confidence interval; SE = standard error.
Table 5. Model 5, the Maximal Gene-Environment Model, in the Three Cohorts.
| Study | AUC (95% CI) | SE | No Late AMD/Late AMD |
|---|---|---|---|
| RS | 0.88 (0.85–0.90) | 0.015 | 4171/121 |
| BDES + BMES pooled | 0.85 (0.82–088) | 0.015 | 3634/156 |
| 3CC* | 0.87 (0.85–0.89) | 0.010 | 7805/277 |
3CC = Three Continent AMD Consortium; AMD = age-related macular degeneration; AUC = area under the curve; BDES = Beaver Dam Eye Study; BMES = Blue Mountain Eye Study; CI = confidence interval, RS = Rotterdam Study; SE = standard error.
Based on risk estimates reanalyzed in the complete data set.
Table 6. Risk Estimates from Cox Proportional Hazard Analysis Based on the Three Continent AMD Consortium.
| Variable | Code | Beta Coefficient per Code |
|---|---|---|
| Age | <65 = 0/65–75 = 1/75+ = 2 | 0/1.558/2.433 |
| Sex | M = 0/F = 1 | 0/0.320 |
| ARMS2 rs10490924 | GG = 0/GT = 1/TT = 2 | 0/0.779/1.720 |
| CFH rs800292 | GG = 0/GA = 1/AA = 2 | 0/−0.899/−1.614 |
| C2/CFB rs4151667 | TT = 0/TA or AA = 1 | 0/−1.245 |
| CFH rs12144939 | GG = 0/GT = 1/TT = 2 | 0/−0.947/−1.195 |
| COL8A1 rs13081855 | GG = 0/GT = 1/TT = 2 | 0/0.223/0.890 |
| C3 rs2230199 | CC = 0/GC = 1/GG = 2 | 0/−0.033/0.755 |
| SLC16A8 rs8135665 | CC = 0/TC = 1/TT = 2 | 0/0.313/0.648 |
| C3 rs433594 | GG = 0/GA = 1/AA = 2 | 0/−0.110/−0.591 |
| C2/CFB rs641153 | GG = 0/GA or AA = 1 | 0/−0.592 |
| SKIV2L rs429608 | GG = 0/GA = 1/AA = 2 | 0/0.027/0.590 |
| CETP rs3764261 | CC = 0/CA = 1/AA = 2 | 0/0.215/0.478 |
| ADAMTS9 rs6795735 | CC = 0/TC = 1/TT = 2 | 0/0.130/0.424 |
| RAD51B rs8017304 | AA = 0/AG = 1/GG = 2 | 0/−0.414/−0.138 |
| TIMP3 rs5749482 | GG = 0/GC or CC = 1 | 0/−0.357 |
| TGBR1 rs334353 | TT = 0/TG = 1/GG = 2 | 0/0.039/−0.336 |
| CFH rs1061170 | TT = 0/TC = 1/CC = 2 | 0/0.175/0.278 |
| FRK/COL10A1 rs3812111 | TT = 0/TA = 1/AA = 2 | 0/−0.278/−0.118 |
| CFI rs10033900 | CC = 0/TC = 1/TT = 2 | 0/−0.070/−0.223 |
| TNFRSF10A rs13278062 | TT = 0/TG = 1/GG = 2 | 0/0.093/0.196 |
| B3GALTL rs9542236 | TT = 0/TC = 1/CC = 2 | 0/−0.231/−0.169 |
| IER3/DDR1 rs3130783 | AA = 0/AG = 1/GG = 2 | 0/0.029/0.166 |
| MYRIP rs2679798 | AA = 0/AG = 1/GG = 2 | 0/0.059/0.156 |
| VEGFA rs943080 | CC = 0/TC = 1/TT = 2 | 0/0/0.098 |
| ABCA1 rs1883025 | CC = 0/TC = 1/TT = 2 | 0/−0.046/0.076 |
| LIPC rs12912415 | AA = 0/AG or GG = 1 | 0/−0.098 |
| LPL rs256 | CC = 0/TC or TT = 1 | 0/−0.048 |
| AMD baseline grade | Level 10 = 0/Level 20 = 1/Level 30 = 2/Level 40 = 3 | 0/1.458/2.560/3.398 |
| Smoking | Never = 0/Past = 1/Current = 2 | 0/0.164/0.651 |
| BMI (kg/m2) | <25 = 0/25+ = 1 | 0/0.007 |
AMD = age-related macular degeneration; BMI = body mass index; F = female; M = male.
We calculated a risk score (Table 6) based on the beta coefficients from the pooled analysis, which ranged from −3.99 to 7.56. We rounded off the estimates and plotted their distribution stratified for incident or no incident late AMD (Fig 2). The plot showed a bimodal distribution with a large frequency difference between the groups for scores <2 and scores >3. The frequencies of risk scores 2 and 3 showed relatively small differences between cases and noncases. Of note, all participants (n = 8) with risk score 8 had risk alleles in the CFH, ARMS2, and C3 genes and no protective alleles in C2/CFB. In contrast, all those with risk score −3 (n = 29) carried a protective variant in C2/CFB and were free of variants in CFH and ARMS2, except 1 person who carried a heterozygous variant in ARMS2. Risk of incident late AMD for individuals with a risk score of 6 to 8 showed a hazard ratio (HR) of 23.2 (95% CI, 15.9–34.0). Risk of incident late AMD for individuals with a risk score of −3 to 0 showed an HR of 0.02 (95% CI, 0.01–0.04).
Figure 2.

Distribution of risk score in incident late age-related macular degeneration (AMD) and no late AMD in the Three Continent AMD Consortium, and hazard ratio (HRs) of incident late AMD. The x-axis represents the risk score category, the left y-axis represents frequency as percentages, and the right y-axis represents the HR of incident late AMD. The dark grey bars represent no late AMD, and the light grey bar represents incident late AMD. The black line represents the HR of incident late AMD. Category 3 is the reference category (R) and has an HR of 1.00. Risk scores −3 to 0 and 6 to 8 were combined for HR. Error bars indicate the 95% confidence interval of the HRs.
Cumulative risk of incident late AMD was calculated for each risk score and compared with the overall cumulative risk of incident late AMD. Individuals (n = 181) with a risk score 6 to 8 had a cumulative risk of 65.6% (standard error [SE], 0.057) to develop late AMD at age 90 years, and those (n = 2751) with a risk score of –3 to 0 had virtually no risk of developing incident late AMD (0.5%; SE, 0.002). The overall risk of AMD for our study population before testing was 17.4% (SE, 0.013) at age 90 years (Fig 3), which was significantly different from all strata apart from risk score 3 (P = 0.71).
Figure 3.
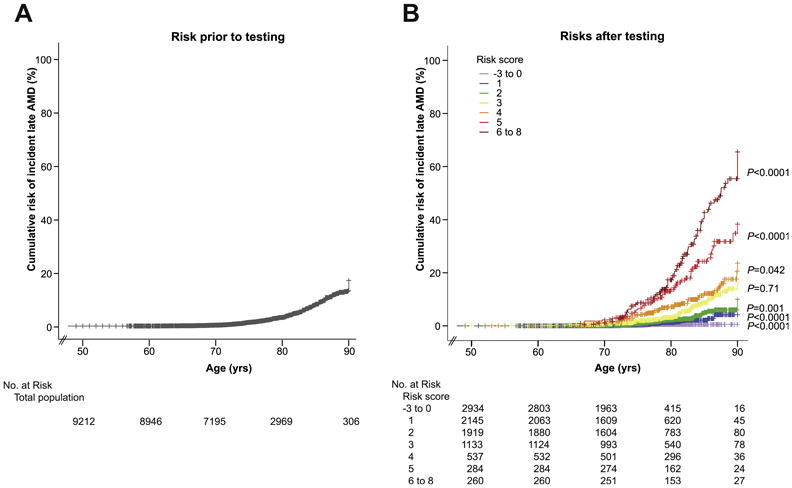
Cumulative risk of incident late age-related macular degeneration (AMD) prior to and after testing of prediction model in the Three Continent AMD Consortium (3CC). A, Overall cumulative risk of incident late AMD in 3CC; the x-axis represents the age of onset for incident late AMD cases and age at last examination for noncases; y-axis represents the cumulative risk of incident late AMD. The number at risk for each decade is presented underneath the figure. B, Cumulative risk of incident late AMD stratified for risk strata 0–6 in 3CC; x-axis represents the age of onset for incident late AMD cases and age at last examination for noncases; y-axis represents the cumulative risk of incident late AMD. The risk scores are depicted by various colors. The number at risk for each decade and each risk score is presented underneath the figure.
Discussion
In 3 independent population-based studies from 3 continents, we investigated all well-known genetic and nongenetic risk factors for AMD. We found that the best prediction for late AMD was based on age, sex, 26 genetic variants, 2 environmental variables, and early AMD phenotype. The accuracy of a prediction model including all these variables was 0.88 in the RS. Because similar risk estimates were found in the BDES and BMES, the model proved to be well generalizable to people of Caucasian descent living on other continents. Translation of the model to the individual level provided good discrimination between those with a high lifetime risk of late AMD and those with virtually no risk, a risk difference of 65%.
A major strength of our study is the inclusion of a general population unbiased by AMD risk factors. The study samples had included a wide spectrum of AMD lesion phenotypes but not only the extreme ends of disease, which is representative of real scenarios in the population. Inclusion of a wide spectrum of risk factor distributions and various levels of risk profiles of our population-based samples ensures a realistic, less biased prediction for all risk categories. Additional strengths are the use of longitudinal observational samples to predict incident cases and validation in 2 independent population-based cohorts with similar study designs. All the strengths facilitate our comprehensive analyses and calculation of cumulative risk of incident late AMD.
Limitations included the relatively low number of incident late AMD cases (n = 363), hampering further risk estimation to AMD subtypes. In addition, we did not include several risk factors, such as dietary factors, biomarkers, or rare genetic variants.10,40–43 Dietary factors and biomarkers are difficult variables to obtain, but their inclusion would have improved the sensitivity of the predictive value. Inclusion of genetic mutations is unlikely to contribute to population risk because of their low frequencies. Finally, the 3 cohorts had subtle differences in methodology, which have been discussed by Klein et al.37
Most previously published AMD prediction models have been based on case-control studies (Table 8).12–28 Most of these models included demographic, genetic, and environmental factors and reached a good prediction for AMD (AUC, 0.68−0.94). The study that reported the highest AUC (0.94) included complement activation.22 However, measurement of activation fragments requires rather intense workup and specific expertise and is therefore unlikely to occur in a standard clinical setting. The other studies have some drawbacks as well. Gold et al14 reported a sensitivity of 70% and a specificity of 50% for their model, making the prediction of low-risk outcomes inaccurate. Hageman et al16 showed a better specificity and sensitivity, but their model did not incorporate any nongenetic factors, including age.16 Furthermore, their model was based on prevalence data, which is less appropriate for estimation of prognosis.44 Most other case-control studies also lacked follow-up data. The reports with follow-up data were almost inclusively based on data from the Age-Related Eye Disease Study.20,23,24,27 Although the investigated people are from the same source population, the prediction studies using this population differed substantially from each other in design and inclusion of risk factors, leading to great variation in prediction outcomes. Our study shows that the sensitivity of risk prediction depends on the number of variables included in the model, and highest sensitivity is achieved with a full model including the major genes, many of the recently discovered minor genetic variants, smoking, BMI, and existing AMD phenotypes.
Table 8. Prediction Models in the Literature.
| Author | Year | Study Population/ Design |
Noncases/ Cases |
Follow-up | Prediction Model Variables | AUC | Sensitivity | Specificity | Validation in Independent Dataset? |
Remarks | |||
|---|---|---|---|---|---|---|---|---|---|---|---|---|---|
|
| |||||||||||||
| Demographic | Environmental | Genetic | Ocular | ||||||||||
| Gold et al14 | 2006 | Case-control | 114/350 | CFH, C2/CB | 0.74 | 0.56 | Yes | ||||||
| Hughes et al17 | 2007 | Case-control | 266/401 | Smoking | CFH, ARMS2 | No | Risk score only CNV case | ||||||
| Jakobsdottir et al18 | 2008 | Case-control and family cohort | 168/187; 1095/429 | Age, sex | Smoking | CFH, ARMS2, C2/FB | 0.70 | 0.74 | No | ||||
| Jakobsdottir et al19 | 2009 | Case-control and family cohort | 168/187; 1095/429 | CFH, ARMS2, C2/FB | 0.79 | No | |||||||
| Seddon et al23 | 2009 | AREDS, RCT | 1167/279 | 6.3 yrs | Age, sex | Education, smoking, BMI, antioxidant/zinc or both | CFH, ARMS2, C2/FB, C3 | Baseline grade | 0.822 | 0.83 | 0.68 | No | |
| Reynolds et al22 | 2009 | Case-control | 60/110 | Age, sex | Smoking, BMI, action fragments | CFH, ARMS2, C2/FB, C3, CFI | 0.94 | No | |||||
| Gibson et al13 | 2010 | Case-control | 470/470 | Age, sex | Smoking | CFH, ARMS2, C3, SERPING1 | 0.83 | 0.76 | 0.76 | No | |||
| McKay et al21 | 2010 | Case-control | 436/437 | Age | Smoking | CFH, ARMS2, C2/FB, C3 | 0.86 | No | |||||
| Zanke et al28 | 2010 | Risks from literature | NA | Smoking | CFH, ARMS2, C3, mtA4917G | No | |||||||
| Chen et al12 | 2011 | AREDS (723), case-control (1121) | 509/1335 | Age, sex | Smoking, BMI | CFH, ARMS2, C2/FB, C3 | 0.82 | 0.755 | 0.747 | No | |||
| Hageman et al16 | 2011 | Case-control | 467/482 | CFH, ARMS2, C2/FB, C3, CFHR4, CFHR5, F13B | 0.80 | 0.82 | 0.63 | Yes | Only CNV cases | ||||
| Klein et al20 | 2011 | AREDS, RCT | 2034/688 | 9.3 yrs | Age | Family history, smoking | CFH, ARMS2 | Baseline grade, drusen presence, advanced AMD in other eye | 0.872† | Yes | |||
| Seddon et al24 | 2011 | AREDS, RCT | 2118/819 | 9.2 yrs | Age, sex | Education, smoking, BMI, antioxidant | CFH, ARMS2, C2/FB, C3 | Drusen size, advanced AMD in other eye | 0.908* 0.876† | No | |||
| Spencer et al25 | 2011 | Case-control | 216/349 | Age | Smoking | CFH, ARMS2, C2/FB, C3 | 0.84 | 0.770 | 0.741 | Yes | Outcome is early and late AMD | ||
| Spencer et al25 | 2011 | Nested case-control | 148/85 | Age | Smoking | CFH, ARMS2, C2/FB, C3 | 0.633 | 0.707 | Yes | Outcome is early and late AMD | |||
| Ying et al26 | 2011 | CAPT, trial | 618/324 | 5 yrs | Age | Smoking, hypertension | … | Baseline grade, night vision score | 0.68 | No | Only GA cases | ||
| Grassmann et al15 | 2012 | Case-control | 786/986 | CFH, ARMS2, C2/FB, LIPC, APOE, PLA2G12A, TIMP3 | 0.813 | No | |||||||
| Yu et al27 | 2012 | AREDS, RCT | 1112/1448 | 10.3 yrs | Age, sex | Education, smoking, BMI, antioxidant | CFH, ARMS2, C2/FB, C3, CFI, LIPC, CFI, LIPC, TIMP3, CETP ABCA1, COL8A1, APOE | Fellow eye status | 0.895* 0.883† | No | Outcome is early and late AMD | ||
AMD = age-related macular degeneration; AREDS = Age-Related Eye Disease Study; AUC = area under the curve; BMI = body mass index; randomized controlled trial.
Based on 10-year follow-up.
Based on 5-year follow-up.
What may be the benefits of prediction tests? Most current counseling provided to family members of late AMD cases is based on clinical parameters. A prediction test may improve the identification of true high-risk individuals. Because the estimation of cumulative risk of incident AMD makes the risk apparent, it may encourage individuals to alter their lifestyle with the aim of decreasing the risk of AMD. For instance, one can stop smoking, eat foods rich in antioxidants, and increase physical exercise to lower risk of progression to late AMD.9,45 There may be benefits for patients with late AMD. Various studies have shown that patients with neovascular AMD who do not respond to anti-VEGF therapy are at higher genetic risk.46–29 These patients may need more intensive treatment regimens. Last, current intervention trials select study participants mainly on the basis of phenotypes. Inclusion of high-risk individuals, identified by a prediction test, may improve homogeneity of the study population and prediction of AMD outcome events.
In conclusion, a risk score based on a large number of genetic risk variants for AMD, the environmental factors smoking and BMI, and early AMD phenotype provided a good prediction of incident late AMD cases in this study. A model incorporating nongenetic factors performed better than a model based on a minimal number of genetic factors, but after inclusion of many genes the model performed better than a model including only nongenetic factors. Inclusion of all risk factors provided the best prediction. Because personalized medicine is the future, prediction tests will become more thoroughly implemented as clinical tools. In such case, only comprehensive tests will be useful for AMD.
Supplementary Material
Acknowledgments
The RS investigators thank Ada Hooghart and Corina Brussee for their effort in data collection and grading of the fundus photographs. The BDES investigators thank Nancy Barrett, MS, Barbara Budig, BS, Holly Cohn, MFA, Shirley Craanen, BS, Andrew Ewen, BS, Ellen Hall, BA, Carol Hoyer, BS, Anne Mosher, BS, and Maria Swift, BS, for their efforts in data collection and grading of fundus photographs. The BMES investigators would like to thank the members of the BMES Genome-Wide Association Study team and the Wellcome Trust Case Control Consortium 2 for their efforts. Group members are listed online in Appendix 1 (available at http://aaojournal.org).
Funding/support: The RS was supported by the Netherlands Organization for Scientific Research, the Hague; Swart van Essen, Rotterdam; Bevordering van Volkskracht, Rotterdam; Rotterdamse Blindenbelangen Association, Rotterdam; Algemene Nederlandse Vereniging ter Voorkoming van Blindheid, Doorn, The Netherlands; Oogfonds Nederland, Utrecht; MDFonds, Utrecht; Vereniging Trustfonds Erasmus Universiteit Rotterdam, Rotterdam, The Netherlands; and Lijf en Leven, Krimpen aan de IJssel, The Netherlands. An unrestricted grant was obtained from Topcon Europe BV, Capelle aan den IJssel, The Netherlands. The BDES was supported by National Institutes of Health Grant EY06594 (B.E.K.K. and R.K.) and, in part, by Research to Prevent Blindness (RPB) (B.E.K.K. and R.K., Senior Scientific Investigator Awards), New York, New York. The National Eye Institute provided funding for the entire study, including collection and analyses of data; RPB provided additional support for data analyses. The content of this report is solely the responsibility of the authors and does not necessarily reflect the official views of the National Eye Institute or the National Institutes of Health. The BMES was supported by the Australian National Health & Medical Research Council (NHMRC), Canberra, Australia (NHMRC project Grant IDs 974159, 211069, 302068), and Centre for Clinical Research Excellence in Translational Clinical Research in Eye Diseases (grant ID 529923). The BMES Genome-Wide Association Study and genotyping costs were supported by the Australian NHMRC, Canberra Australia (NHMRC project Grant IDs 512423, 475604, and 529912), and the Wellcome Trust, United Kingdom, as part of the Wellcome Trust Case Control Consortium 2 (A. Viswanathan, P. McGuffin, P. Mitchell, F. Topouzis, P. Foster, grant IDs 085475/B/08/Z and 085475/08/Z). J.J.W. is funded by a National Health & Medical Research Council Senior Research Fellowship (Grant ID 358702, 2005–2009, and ID 632909, 2010–2014). The funding organizations had no role in the design and conduct of the study; the collection, management, analysis, and interpretation of the data; or the preparation, review, or approval of the manuscript.
Footnotes
Financial Disclosure(s): The author(s) have no proprietary or commercial interest in any materials discussed in this article.
*Group members of the BMES Genome-Wide Association Study team and the Wellcome Trust Case Control Consortium 2 are listed online in Appendix 1 (available at http//aaojournal.org)).
References
- 1.Eye Diseases Prevalence Research Group. Causes and prevalence of visual impairment among adults in the United States. Arch Ophthalmol. 2004;122:477–85. doi: 10.1001/archopht.122.4.477. [DOI] [PubMed] [Google Scholar]
- 2.Klaver CC, Wolfs RC, Vingerling JR, et al. Age-specific prevalence and causes of blindness and visual impairment in an older population: the Rotterdam Study. Arch Ophthalmol. 1998;116:653–8. doi: 10.1001/archopht.116.5.653. [DOI] [PubMed] [Google Scholar]
- 3.Augood CA, Vingerling JR, de Jong PT, et al. Prevalence of age-related maculopathy in older Europeans: the European Eye Study (EUREYE) Arch Ophthalmol. 2006;124:529–35. doi: 10.1001/archopht.124.4.529. [DOI] [PubMed] [Google Scholar]
- 4.Fact Sheet no 282. World Health Organization; Nov, 2004. [Accessed July 28, 2013]. VISION 2020: The Right to Sight, the global initiative for the elimination of avoidable blindness: magnitude and causes of visual impairment. Available at: http://whqlibdoc.who.int/fact_sheet/2004/FS_282.pdf. [Google Scholar]
- 5.van Leeuwen R, Klaver CC, Vingerling JR, et al. Epidemiology of age-related maculopathy: a review. Eur J Epidemiol. 2003;18:845–54. doi: 10.1023/a:1025643303914. [DOI] [PubMed] [Google Scholar]
- 6.Klaver CC, Assink JJ, Vingerling JR, et al. Smoking is also associated with age-related macular degeneration in persons aged 85 years and older: the Rotterdam Study [letter] Arch Ophthalmol. 1997;115:945. doi: 10.1001/archopht.1997.01100160115033. [DOI] [PubMed] [Google Scholar]
- 7.Seddon JM, Ajani UA, Mitchell BD. Familial aggregation of age-related maculopathy. Am J Ophthalmol. 1997;123:199–206. doi: 10.1016/s0002-9394(14)71036-0. [DOI] [PubMed] [Google Scholar]
- 8.Despriet DD, Klaver CC, Witteman JC, et al. Complement factor H polymorphism, complement activators, and risk of age-related macular degeneration. JAMA. 2006;296:301–9. doi: 10.1001/jama.296.3.301. [DOI] [PubMed] [Google Scholar]
- 9.Ho L, van Leeuwen R, Witteman JC, et al. Reducing the genetic risk of age-related macular degeneration with dietary antioxidants, zinc, and omega-3 fatty acids: the Rotterdam study. Arch Ophthalmol. 2011;129:758–66. doi: 10.1001/archophthalmol.2011.141. [DOI] [PubMed] [Google Scholar]
- 10.van Leeuwen R, Boekhoorn S, Vingerling JR, et al. Dietary intake of antioxidants and risk of age-related macular degeneration. JAMA. 2005;294:3101–7. doi: 10.1001/jama.294.24.3101. [DOI] [PubMed] [Google Scholar]
- 11.Vingerling JR, Hofman A, Grobbee DE, de Jong PT. Age-related macular degeneration and smoking The Rotterdam Study. Arch Ophthalmol. 1996;114:1193–6. doi: 10.1001/archopht.1996.01100140393005. [DOI] [PubMed] [Google Scholar]
- 12.Chen Y, Zeng J, Zhao C, et al. Assessing susceptibility to age-related macular degeneration with genetic markers and environmental factors. Arch Ophthalmol. 2011;129:344–51. doi: 10.1001/archophthalmol.2011.10. [DOI] [PMC free article] [PubMed] [Google Scholar]
- 13.Gibson J, Cree A, Collins A, et al. Determination of a gene and environment risk model for age-related macular degeneration. Br J Ophthalmol. 2010;94:1382–7. doi: 10.1136/bjo.2010.182568. [DOI] [PubMed] [Google Scholar]
- 14.Gold B, Merriam JE, Zernant J, et al. AMD Genetics Clinical Study Group. Variation in factor B (BF) and complement component 2 (C2) genes is associated with age-related macular degeneration. Nat Genet. 2006;38:458–62. doi: 10.1038/ng1750. [DOI] [PMC free article] [PubMed] [Google Scholar]
- 15.Grassmann F, Fritsche LG, Keilhauer CN, et al. Modelling the genetic risk in age-related macular degeneration. [Accessed July 28, 2013];PLoS One. 2012 7:e37979. doi: 10.1371/journal.pone.0037979. serial online. Available at: http://www.plosone.org/article/info%3Adoi%2F10.1371%2Fjournal.pone.0037979. [DOI] [PMC free article] [PubMed] [Google Scholar]
- 16.Hageman GS, Gehrs K, Lejnine S, et al. Clinical validation of a genetic model to estimate the risk of developing choroidal neovascular age-related macular degeneration. Hum Genomics. 2011;5:420–40. doi: 10.1186/1479-7364-5-5-420. [DOI] [PMC free article] [PubMed] [Google Scholar]
- 17.Hughes AE, Orr N, Patterson C, et al. Neovascular age-related macular degeneration risk based on CFH, LOC387715/HTRA1, and smoking. [Accessed July 28, 2013];PLoS Med. 2007 4:e355. doi: 10.1371/journal.pmed.0040355. serial online. Available at: http://www.plosmedicine.org/article/info%3Adoi%2F10.1371%2Fjournal.pmed.0040355. [DOI] [PMC free article] [PubMed] [Google Scholar]
- 18.Jakobsdottir J, Conley YP, Weeks DE, et al. C2 and CFB genes in age-related maculopathy and joint action with CFH and LOC387715 genes. [Accessed July 28, 2013];PLoS One. 2008 3:e2199. doi: 10.1371/journal.pone.0002199. serial online. Available at: http://www.plosone.org/article/info%3Adoi%2F10.1371%2Fjournal.pone.0002199. [DOI] [PMC free article] [PubMed] [Google Scholar]
- 19.Jakobsdottir J, Gorin MB, Conley YP, et al. Interpretation of genetic association studies: markers with replicated highly significant odds ratios may be poor classifiers. [Accessed July 28, 2013];PLoS Genet. 2009 5:e1000337. doi: 10.1371/journal.pgen.1000337. serial online. Available at: http://www.plosgenetics.org/article/info%3Adoi%2F10.1371%2Fjournal.pgen.1000337. [DOI] [PMC free article] [PubMed] [Google Scholar]
- 20.Klein ML, Francis PJ, Ferris FL, III, et al. Risk assessment model for development of advanced age-related macular degeneration. Arch Ophthalmol. 2011;129:1543–50. doi: 10.1001/archophthalmol.2011.216. [DOI] [PubMed] [Google Scholar]
- 21.McKay GJ, Dasari S, Patterson CC, et al. Complement component 3: an assessment of association with AMD and analysis of gene-gene and gene-environment interactions in a Northern Irish cohort. [Accessed July 28, 2013];Mol Vis. 2010 16:194–9. serial online. Available at: http://www.molvis.org/molvis/v16/a24/ [PMC free article] [PubMed] [Google Scholar]
- 22.Reynolds R, Hartnett ME, Atkinson JP, et al. Plasma complement components and activation fragments: associations with age-related macular degeneration genotypes and phenotypes. Invest Ophthalmol Vis Sci. 2009;50:5818–27. doi: 10.1167/iovs.09-3928. [DOI] [PMC free article] [PubMed] [Google Scholar]
- 23.Seddon JM, Reynolds R, Maller J, et al. Prediction model for prevalence and incidence of advanced age-related macular degeneration based on genetic, demographic, and environmental variables. Invest Ophthalmol Vis Sci. 2009;50:2044–53. doi: 10.1167/iovs.08-3064. [DOI] [PMC free article] [PubMed] [Google Scholar]
- 24.Seddon JM, Reynolds R, Yu Y, et al. Risk models for progression to advanced age-related macular degeneration using demographic, environmental, genetic, and ocular factors. Ophthalmology. 2011;118:2203–11. doi: 10.1016/j.ophtha.2011.04.029. [DOI] [PMC free article] [PubMed] [Google Scholar]
- 25.Spencer KL, Olson LM, Schnetz-Boutaud N, et al. Using genetic variation and environmental risk factor data to identify individuals at high risk for age-related macular degeneration. [Accessed July 28, 2013];PLoS One. 2011 6:e17784. doi: 10.1371/journal.pone.0017784. serial online. Available at: http://www.plosone.org/article/info%3Adoi%2F10.1371%2Fjournal.pone.0017784. [DOI] [PMC free article] [PubMed] [Google Scholar]
- 26.Ying GS, Maguire MG, Complications of Age-related Macular Degeneration Prevention Trial Research Group Development of a risk score for geographic atrophy in Complications of the Age-Related Macular Degeneration Prevention Trial. Ophthalmology. 2011;118:332–8. doi: 10.1016/j.ophtha.2010.06.030. [DOI] [PMC free article] [PubMed] [Google Scholar]
- 27.Yu Y, Reynolds R, Rosner B, et al. Prospective assessment of genetic effects on progression to different stages of age-related macular degeneration using multistate Markov models. Invest Ophthalmol Vis Sci. 2012;53:1548–56. doi: 10.1167/iovs.11-8657. [DOI] [PMC free article] [PubMed] [Google Scholar]
- 28.Zanke B, Hawken S, Carter R, Chow D. A genetic approach to stratification of risk for age-related macular degeneration. Can J Ophthalmol. 2010;45:22–7. doi: 10.3129/i09-209. [DOI] [PubMed] [Google Scholar]
- 29.Szklo M. Population-based cohort studies. Epidemiol Rev. 1998;20:81–90. doi: 10.1093/oxfordjournals.epirev.a017974. [DOI] [PubMed] [Google Scholar]
- 30.Janssens AC, Ioannidis JP, Bedrosian S, et al. Strengthening the reporting of genetic risk prediction studies (GRIPS): explanation and elaboration. Eur J Epidemiol. 2011;26:313–37. doi: 10.1007/s10654-011-9551-z. [DOI] [PMC free article] [PubMed] [Google Scholar]
- 31.Hofman A, van Duijn CM, Franco OH, et al. The Rotterdam Study: 2012 objectives and design update. Eur J Epidemiol. 2011;26:657–86. doi: 10.1007/s10654-011-9610-5. [DOI] [PMC free article] [PubMed] [Google Scholar]
- 32.Hofman A, Grobbee DE, de Jong PT, van den Ouweland FA. Determinants of disease and disability in the elderly: the Rotterdam Elderly Study. Eur J Epidemiol. 1991;7:403–22. doi: 10.1007/BF00145007. [DOI] [PubMed] [Google Scholar]
- 33.Klein R, Klein BE, Linton KL, De Mets DL. The Beaver Dam Eye Study: visual acuity. Ophthalmology. 1991;98:1310–5. doi: 10.1016/s0161-6420(91)32137-7. [DOI] [PubMed] [Google Scholar]
- 34.Mitchell P, Smith W, Attebo K, Wang JJ. Prevalence of age-related maculopathy in Australia. The Blue Mountains Eye Study Ophthalmology. 1995;102:1450–60. doi: 10.1016/s0161-6420(95)30846-9. [DOI] [PubMed] [Google Scholar]
- 35.Bird AC, Bressler NM, Bressler SB International ARM Epidemiological Study Group. An international classification and grading system for age-related maculopathy and age-related macular degeneration. Surv Ophthalmol. 1995;39:367–74. doi: 10.1016/s0039-6257(05)80092-x. [DOI] [PubMed] [Google Scholar]
- 36.Klein R, Davis MD, Magli YL, et al. The Wisconsin Age-Related Maculopathy Grading System. Ophthalmology. 1991;98:1128–34. doi: 10.1016/s0161-6420(91)32186-9. [DOI] [PubMed] [Google Scholar]
- 37.Klein R, Meuer SM, Myers CE, et al. Harmonizing the classification of age-related macular degeneration in the Three Continent AMD Consortium. Ophthalmic Epidemiol. doi: 10.3109/09286586.2013.867512. [DOI] [PMC free article] [PubMed] [Google Scholar]
- 38.AMD Gene Consortium. Seven new loci associated with age-related macular degeneration. Nat Genet. 2013;45:433–9. doi: 10.1038/ng.2578. [DOI] [PMC free article] [PubMed] [Google Scholar]
- 39.Kopplin LJ, Igo RP, Jr, Wang Y, et al. Genome-wide association identifies SKIV2L and MYRIP as protective factors for age-related macular degeneration. Genes Immun. 2010;11:609–21. doi: 10.1038/gene.2010.39. [DOI] [PMC free article] [PubMed] [Google Scholar]
- 40.Chiu CJ, Milton RC, Klein R, et al. Dietary compound score and risk of age-related macular degeneration in the Age-Related Eye Disease Study. Ophthalmology. 2009;116:939–46. doi: 10.1016/j.ophtha.2008.12.025. [DOI] [PMC free article] [PubMed] [Google Scholar]
- 41.Smailhodzic D, Klaver CC, Klevering BJ, et al. Risk alleles in CFH and ARMS2 are independently associated with systemic complement activation in age-related macular degeneration. Ophthalmology. 2012;119:339–46. doi: 10.1016/j.ophtha.2011.07.056. [DOI] [PubMed] [Google Scholar]
- 42.Stone EM, Braun TA, Russell SR, et al. Missense variations in the fibulin 5 gene and age-related macular degeneration. N Engl J Med. 2004;351:346–53. doi: 10.1056/NEJMoa040833. [DOI] [PubMed] [Google Scholar]
- 43.Tan JS, Wang JJ, Flood V, et al. Dietary antioxidants and the long-term incidence of age-related macular degeneration: the Blue Mountains Eye Study. Ophthalmology. 2008;115:334–41. doi: 10.1016/j.ophtha.2007.03.083. [DOI] [PubMed] [Google Scholar]
- 44.Rothman KJ, Greenland S, Lash TL. In: Modern Epidemiology. 3rd. Rothman KJ, Greenland S, Lash TL, editors. Vol. 33 Philadelphia, PA: Wolters Kluwer/Lippincott Williams & Wilkins; 2008. [Google Scholar]
- 45.Mares JA, Voland RP, Sondel SA, et al. Healthy lifestyles related to subsequent prevalence of age-related macular degeneration. Arch Ophthalmol. 2011;129:470–80. doi: 10.1001/archophthalmol.2010.314. [DOI] [PMC free article] [PubMed] [Google Scholar]
- 46.Abedi F, Wickremasinghe S, Richardson AJ, et al. Variants in the VEGFA gene and treatment outcome after anti-VEGF treatment for neovascular age-related macular degeneration. Ophthalmology. 2013;120:115–21. doi: 10.1016/j.ophtha.2012.10.006. [DOI] [PubMed] [Google Scholar]
- 47.Boltz A, Ruiß M, Jonas JB, et al. Role of vascular endothelial growth factor polymorphisms in the treatment success in patients with wet age-related macular degeneration. Ophthalmology. 2012;119:1615–20. doi: 10.1016/j.ophtha.2012.02.001. [DOI] [PubMed] [Google Scholar]
- 48.Brantley MA, Jr, Fang AM, King JM, et al. Association of complement factor H and LOC387715 genotypes with response of exudative age-related macular degeneration to intravitreal bevacizumab. Ophthalmology. 2007;114:2168–73. doi: 10.1016/j.ophtha.2007.09.008. [DOI] [PubMed] [Google Scholar]
- 49.Smailhodzic D, Muether PS, Chen J, et al. Cumulative effect of risk alleles in CFH, ARMS2, and VEGFA on the response to ranibizumab treatment in age-related macular degeneration. Ophthalmology. 2012;119:2304–11. doi: 10.1016/j.ophtha.2012.05.040. [DOI] [PubMed] [Google Scholar]
Associated Data
This section collects any data citations, data availability statements, or supplementary materials included in this article.