

Abstract
Airway smooth muscle (ASM) cells play important physiological roles in the lung, and abnormal proliferation of ASM directly contributes to the airway remodeling during development of lung diseases such as asthma. MicroRNAs are small yet versatile gene tuners that regulate a variety of cellular processes, including cell growth and proliferation; however, little is known about the precise role of microRNAs in the proliferation of the ASM. Here we report that a specific microRNA (miR-10a) controls ASM proliferation through directly inhibiting the phosphoinositide 3-kinase (PI3K) pathway. Next-generation sequencing identified miR-10a as the most abundant microRNA expressed in primary human airway smooth muscle (HASM) cells, accounting for > 20% of all small RNA reads. Overexpression of miR-10a reduced mitogen-induced HASM proliferation by ∼50%, whereas inhibition of miR-10a increased HASM proliferation by ∼40%. Microarray profiling of HASM cells expressing miR-10a mimics identified 52 significantly down-regulated genes as potential targets of miR-10a, including the catalytic subunit α of PI3K (PIK3CA), the central component of the PI3K pathway. MiR-10a directly suppresses PIK3CA expression by targeting the 3′-untranslated region (3′-UTR) of the gene. Inhibition of PIK3CA by miR-10a reduced V-akt murine thymoma viral oncogene homolog 1 (AKT) phosphorylation and blunted the expression of cyclins and cyclin-dependent kinases that are required for HASM proliferation. Together, our study identifies a novel microRNA-mediated regulatory mechanism for PI3K signaling and ASM proliferation and further suggests miR-10a as a potential therapeutic target for lung diseases whose etiology resides in abnormal ASM proliferation.—Hu, R., Pan, W., Fedulov, A. V., Jester, W., Jones, M. R., Weiss, S. T., Panettieri, R. A., Jr., Tantisira, K., Lu, Q. MicroRNA-10a controls airway smooth muscle cell proliferation via direct targeting of the PI3 kinase pathway.
Keywords: asthma, miR-10a, PIK3CA
Airway smooth muscle (ASM) is the critical effector tissue that maintains bronchomotor tone, and phenotypic changes in ASM play a pivotal role in the pathogenesis of a variety of lung diseases (1). Indeed, an increase in ASM tissue mass is a major driver of airway narrowing associated with asthma and chronic obstructive pulmonary disease (2–5). The pathological change in ASM mass is a combined result of hypertrophy (increase in cell size) and hyperplasia (increase in cell number through proliferation). ASM cells proliferate in response to a myriad of growth stimuli, including peptide growth factors (e.g., platelet-derived growth factor [PDGF] and epidermal growth factor [EGF]) as well as bronchoconstrictors (e.g., histamine, thrombin, and endothelin). These mitogens function by binding to and activating their cognate receptors at the surface of ASM cells. For example, PDGF and EGF bind to and activate their respective receptor tyrosine kinases (RTKs), whereas bronchoconstrictors mostly act through specific G-protein coupled receptors (GPCRs).
Following receptor activation by the mitogens, two main pathways are known to mediate the transduction of the proliferation signals in ASM cells: the mitogen-activated protein kinase (MAPK)/extracellular signal regulated kinase (ERK) pathway and the phosphoinositide 3 kinase (PI3K) pathway. While both are needed for maximal ASM cell proliferation (6, 7), these two pathways function mostly independently in ASM cells. Both RTK and GPCR mitogens cause robust activation of the MAPK/ERK pathway as measured by ERK phosphorylation in ASM cells (8). Chemical inhibition of ERK phosphorylation reduces mitogen-induced DNA synthesis and proliferation in cultured human ASM cells, indicating that the pathway is an important regulator of cell proliferation (8–11). PI3K is the other major signaling pathway that regulates ASM proliferation (6, 7, 12, 13). HASM cells express 3 forms of PI3 kinases: class IA, II, and III (12). RTK and GPCR mitogens both activate class IA PI3K and its signaling (7). Inhibition of the PI3K signaling prevents mitogen stimulated cyclin D1 protein expression and DNA synthesis without affecting ERK signaling (13, 14), whereas expression of constitutively active class IA PI3K is sufficient to stimulate DNA synthesis (7). While it is well recognized that MAPK/ERK and PI3K play important roles in regulating ASM proliferation, little is known about whether and how these pathways may be regulated in the ASM cells.
MicroRNAs (miRNAs) are small (∼22 nt) noncoding RNAs that mediate post-transcriptional gene silencing through binding to the 3′-UTR of target mRNAs to promote mRNA degradation and/or translational inhibition (15–17). MiRNAs play versatile roles in normal cell physiology and disease pathogenesis (15). In the airway, miRNAs have been shown to play important roles in regulating inflammation: miR-146 is induced by interleukin 1β (IL-1β) and suppresses the activation of NF-κB in alveolar epithelial cells (18), and inhibition of miR-126 suppresses inflammation and the development of allergic airway disease (19). In ASM cells, miRNAs also regulate inflammation: several miRNAs (miR-25, -140*, -188, and -320) were significantly down-regulated in human ASM cells that were exposed to inflammatory cytokines, such as IL-1β, tumor necrosis factor α (TNF-α), and interferon γ (IFN-γ) (20) and inhibition of miR-25 up-regulates Kruppel-like factor 4 (KLF-4), which is a potent inhibitor of smooth muscle-specific gene expression and a mediator of inflammation (20). MiRNAs also regulate the contractility of ASM cells. For example, miR-133a down-regulates RhoA, which is involved in regulating mechanical stress and cytoskeleton organization in the ASM (21); another miRNA let-7f targets β2-adrenergic receptor, whose activation causes ASM relaxation (22).
Relatively little is known about the potential role of miRNAs in the fundamental ASM phenotype: proliferation. A very recent study implicated a role for miR-221 in the hyperproliferation of ASM cells in severe asthma (23). However, how miRNAs may regulate the signaling pathways that control ASM proliferation remains largely unknown. In this report, we identified an miRNA that is most abundant in ASM as a critical novel regulator of ASM proliferation. Functional studies demonstrated that the miRNA regulates ASM proliferation by specifically suppressing the PI3K signaling pathway.
MATERIALS AND METHODS
ASM cell culturing and transfection
Primary human airway smooth muscle (HASM) cells were isolated from 3 aborted lung transplant donors with no chronic illness. The tissues were obtained from the National Disease Resource Interchange, and their use was approved by the University of Pennsylvania Internal Review Board. HASM cells were maintained and cultured in Ham's F12 medium supplemented with 10% FCS and antibiotics, as described previously (24, 25). Passage 4–7 HASM cells were used in all experiments. MiR-10a mimics and inhibitor (Qiagen, Valencia, CA, USA) were used to overexpress and knock down miR-10a, respectively. Nontargeting scrambled small interfering RNA (siRNA; Qiagen) was used as a control for miR-10a mimic experiments; miRNA inhibitor control (Qiagen) was used as a control for miR-10a inhibitor experiments. Transfections of miR mimics and inhibitord were performed using the DharmaFECT 1 reagent (Thermo Scientific, Waltham, MA, USA) according to the manufacturer's protocol.
Construction and next-generation sequencing of small-RNA libraries
RNA was extracted with the Qiagen miRNeasy kit using the manufacturer's protocol. RNA concentration and quality were measured by Nanodrop (Thermo Scientific) and by Bioanalyzer (Agilent Technologies, Santa, Clara, CA), respectively. A TruSeq small-RNA sample preparation kit (Illumina, San Diego, CA, USA) was used to construct DNA libraries from the RNA preparations (1 μg total RNA/sample) according to the manufacturer's protocol. Briefly, 3′ and 5′ adaptors were sequentially ligated to the extracted small-RNA species. Reverse transcription–polymerase chain reaction (RT-PCR) amplification was performed in which one primer contains a DNA barcode. The amplified product was then gel purified in order to isolate the small-RNA library, which is subsequently validated using the Agilent Technologies 2100 Bioanalyzer. At this point, 3 samples (each from one HASM cell line) were pooled together (multiplexing) at equal molar concentrations. Quantification of the DNA library samples was done by Nanodrop or Qubit (Life Technologies, Inc., Gaithersburg, MD, USA). Sequence quality and fragment size in the prepared DNA libraries were verified by running the samples on a 2% agarose gel. Sequencing (single read, 36 bp) of the prepared DNA libraries were done using the Illumina Genome Analyzer IIx platform at the Boston University Illumina Sequencing Core Facility (Boston, MA, USA).
Analysis of deep sequencing data
Data cleaning and alignment were performed using the CLC Genomic Workbench (CLCBio, Cambridge, MA, USA). Raw sequencing reads with an average length of 36 bp in FASTq format were used for 3′ adaptor trimming. Trimmed reads were aligned against the human miRNA database (miRBase release 18; University of Manchester, Manchester, UK; http://www.mirbase.org). MiRNA sequencing count table was generated using the alignment count function of the software, which was set to allow 2 mismatches. Only perfect matched counts were used for the subsequent analysis. The abundance value for each miRNA was derived using the following formula: total percentage count for miR-X = (mature miRNA reads/total aligned miR reads for the sample) × 100. The percentage of total count reflects the abundance of each miRNA. A pie graph was generated for each donor sample to reflect the miRNA composition. For in silico analysis of tissue expression patterns of miRNAs, miRNA enrichment analysis was performed to compare our dataset with published dataset that contains expression data from 170 cell lines/tissues obtained by small-RNA sequencing (26). Total percentage count from 3 different HASM cell lines with total percentage count of the published dataset was graphed in R (R Foundation, Vienna, Austria) with abundance (total percentage count) on the y axis and different cell lines on the x axis.
Quantitative RT-PCR (qRT-PCR) of miRNAs and mRNA
MiRNAs and mRNAs were measured using the miScript PCR system with miR-10amiScript Primer Assays (Qiagen) on a Light Cycler 480 (Roche, Indianapolis, IN, USA), following the manufacturer's recommendations. U6 small RNA and β-actin were used to normalize miRNA and mRNA quantification, respectively. Expression values and statistical significance were calculated using the 2−ΔΔCt method (27, 28).
Microarray-based gene profiling and data analysis
HASM cells from passage 4 were transfected with either miR-10a mimics or control siRNA. About 48 h post-transfection, RNA was extracted from the cells using the miRNeasy mini kit (Qiagen). Samples were analyzed on the Human Gene 1.0 ST Array (Affymetrix, Santa Clara, CA, USA), which contains 36079 total RefSeq transcripts, at the Dana-Farber Microarray Core Facility (Boston, MA, USA). Data were subsequently processed and analyzed with dChip software (Harvard School of Public Health). Transcripts with fold change (FC) cutoff at 0.8 and 1.25 and P < 0.05 were identified as significant hits, which were imported into the GeneGo enrichment analysis software (Thomson Reuters, New York, NY, USA).
ASM proliferation assay
For H3-thymidine incorporation, HASM cells were serum starved for 24 h. Cells were cultured with radiolabeled H3-thymidine (1 μCi/well; PerkinElmer, Wellesley, MA, USA) in the presence and absence of 10% FBS for 24 h. The cells were then extracted and lysed using a semiautomated PhD cell harvester (Cambridge Technology, Bedford, MA, USA). Radioactivity was counted using a Tricarb 2910TR liquid scintillation counter (PerkinElmer).To measure cell growth, HASM cells were trypsinized, washed 2 times with PBS, and counted with a hemocytometer.
Western blotting
Cells were lysed in Nonidet P-40 lysis buffer (0.5% v/v Nonidet P-40, 50 mM Tris-HCL, 150 mM NaCl) supplemented with protease and phosphatase inhibitors (Roche). Lysates were mixed with lithium dodecyl sulfate (LDS) sample buffer and resolved on 4–12% NuPAGE gel (Invitrogen, Carlsbad, CA, USA) using MOPS running buffer supplemented with Nu-PAGE antioxidant (Invitrogen). Proteins were transferred onto a nitrocellulose membrane (GE Amersham, Piscataway, NJ, USA) and probed with the indicated antibodies. Quantification of Western blotting bands was done using the ImageJ software (U.S. National Institutes of Health, Bethesda, MD, USA). Primary antibodies used in this study include anti-P110α (cat. no. 4255), anti-phospho V-akt murine thymoma viral oncogene homolog 1 (AKT; Ser473; 4058), anti-AKT (9272), anti-phospho ERK1/2 (9101), anti-ERK (4695) (all from Cell Signaling, Danvers, MA, USA), and anti-GAPDH (GT239; Gene Tex, San Antonio, TX, USA).
Luciferase reporter assay
Full-length 3′-UTR of PI3K catalytic subunit α (PIK3CA) was subcloned into a pMir-Target luciferase vector driven by a cytomegalovirus (CMV) promoter (Origene, Rockville, MD, USA). Mutant derivatives of the construct were made through site-directed mutagenesis using the Quick-Change Kit (Stratagene, La Jolla, CA, USA). HEK293 cells were cotransfected with the luciferase constructs (wild type or mutant) with miR-10a mimics or control scrambled siRNA for 48 h using Lipofectamine (Invitrogen) at a 2:1 molar ratio (miRNA mimics vs. construct reporter) following the manufacturer's protocol. The day before luciferase measurement, cells were counted and reseeded into 96-well assay plates, followed by dual-luciferase assay according to the manufacturer's recommended protocol (Promega, Madison, WI, USA). Luminescence was measured by a multimode microplate reader (BioTek Synergy 2; BioTek, Winooski, VT, USA).
RESULTS
Small-RNA profiling identified miR-10a as the most abundant miRNA in primary human ASM cells
To probe the landscape of miRNA expression in the ASM, we performed next-generation sequencing of small RNAs in primary HASM cells from 3 healthy donors. Small RNAs extracted from the cultured HASM cells were used to construct cDNA libraries. Deep sequencing (36-bp single reads) was performed, and sequences were trimmed (to remove library adaptors) and aligned against the miRNA database (miRBase). We obtained ∼4–8 × 10⁶ reads for each of the 3 HASM cell lines. Up to 70% of the reads were aligned to sequences in the miRBase, and >85% of the alignments were perfect matches (Supplemental Table S1). According to the analyzed deep-sequencing data, ∼200 miRNAs were detected in HASM cells, and half of them were relatively well expressed (with >100 sequencing reads). Many of the well-known miRNAs are among the best expressed in HASM cells, including miR-10a, miR-21, let-7a, miR-100, and miR-26 (Fig. 1A). Among them, miR-10a is the most abundant, accounting for >20% of all aligned reads (Fig. 1A). We performed qRT-PCR validation experiments on several miRNAs. The expression levels of these miRNAs, as determined by qRT-PCR (normalized ΔCt values) correlated well with their relative abundance found by deep sequencing (Supplemental Table S2). To determine whether miR-10a is specifically enriched in HASM cells, we performed an in silico miRNA analysis by comparing our dataset with a published dataset that contains miRNA deep sequencing data from 170 cell lines/tissues (26). The expression plot showed that miR-10a was expressed at a much higher level in HASM cells as compared to all other cells/tissues, whereas a similarly abundant miRNA (let-7a) was not differentially expressed in HASM cells (Fig. 1B). To confirm cellular specificity of miR-10a to ASM cells within the lung, we examined miR-10a expression in primary airway epithelial cells. The expression of miR-10a in airway epithelial cells was >30-fold lower than HASM cells (Fig. 1C). Overall, our data showed that miR-10a is the most abundant miRNA in HASM cells and exhibits an ASM-enriched expression.
Figure 1.

Next-generation deep sequencing identified miR-10a as a top highly expressed miRNA in ASM cells. A) Profiling of miRNA expression in primary human ASM cells using Next-gen deep sequencing. RNA was extracted from 3 primary HASM cell lines and sequenced using next-generation sequencing (for details, see Materials and Methods). Pie chart represents the distribution of the percentages of total sequencing counts in a representative HASM cell line for the top 5 highly expressed miRNAs. Average percentages for the top 5 highly expressed miRNAs in 3 HASM cell lines are plotted in the bar graph. B) miR-10a is highly abundant in the ASM as compared to other tissues and cell lines. Expression level of miR-10a (as a percentage of total sequencing reads) in HASM cells was compared with that in 170 other cell lines/tissues. Red dashed line represents the average percentage of total counts for miR-10a in HASM cells; green dashed line represents the average of miR-10a expression from the other 170 cell lines/tissues. C) qRT-PCR data comparing the level of miR-10a in HASM cells with that in primary airway epithelial cells; RNA was extracted from primary HASM cell lines (3 donors) and primary airway epithelial cell lines (2 donors). MiR-10a level was measured using qRT-PCR (for details, see Materials and Methods) and normalized to U6 small RNA. Error bars = se.
Identification of the miR-10a target genes and downstream pathways in ASM cells
MiRNAs function by suppressing the expression of their target genes (15, 16, 29). To identify the genes targeted by miR-10a in HASM cells, we employed an unbiased experimental approach (Fig. 2A). We first transfected HASM cells with miR-10a mimics or a control scrambled siRNA. We then determined the effect of miR-10a on the HASM transcriptome by whole-genome microarray gene profiling. Differential transcript expression analysis identified >1000 significant transcript changes in miR-10a mimic-transfected cells as compared to the scrambled control (Supplemental Table S3). There are many more down-regulated genes (798) than up-regulated genes (304) in the miR-10a-overexpressing cells. This is expected, given the inhibitory nature of miRNA regulation on gene expression. The widespread effect of miR-10a on the transcriptome is consistent with the notion that a single miRNA regulates expression of many genes through both direct and indirect effects (29, 30). To identify the direct targets of miR-10a, we cross-compared our microarray dataset with in silico predicted targets of miR-10a (TargetScan 5.1), which all contain putative sequences that match the seed sequence (2–7 nt) of the miRNA. Among the 271 predicted miR-10a targets, 248 (∼91%) were detected in HASM cells by microarray, and 52 (∼19%) of those putative target genes were significantly down-regulated in our microarray dataset (Table 1). These 52 genes have a high likelihood of being the direct targets of miR-10a, because they contain miR-10a target sites in their 3′UTR and are down-regulated in miR-10a-transfected HASM cells. Down-regulation of selected genes by miR-10a mimic expression in HASM cells was validated by qRT-PCR (Fig. 2B). To identify common biological processes and pathways affected by miR-10a, we performed a gene set enrichment analysis on all transcripts that were significantly changed by miR-10a mimic transfection. Strikingly, 8 of the top 10 enriched pathways affected by miR-10a are related to cell cycle (Table 2).
Figure 2.

Microarray profiling identified putative genes and pathways targeted by miR-10a in HASM cells. A) Microarray-based approach to identify transcriptomic changes resulting from miR-10a mimic expression. HASM cells were transfected with either control scrambled siRNA or miR-10a mimics for 48 h. RNAs were then extracted and used for hybridization to Affymatrix-based Human Gene 1.0 ST microarray with a coverage of 36079 RefSeq transcripts (n=2). B) qRT-PCR validation of microarray-identified transcript changes. RNA was extracted from scrambled siRNA control and miR-10a mimics, followed by qRT-PCR for selected down-regulated miR-10a putative target genes. NEDD4 and MAP4K4 were not identified as putative miR-10a targets, but were included as negative controls. Genes tested were normalized to β-actin. Triplicates were used for each condition.
Table 1.
Predicted miR-10a target genes that are down-regulated by miR-10a mimic expression in HASM cells
| Gene | FC | P |
|---|---|---|
| CDK6: cyclin-dependent kinase 6 | 0.37 | 0.00 |
| USP46: ubiquitin-specific peptidase 46 | 0.39 | 0.00 |
| RAP2A: member of RAS oncogene family | 0.40 | 0.02 |
| ITGB8: integrin, β 8 | 0.40 | 0.01 |
| CBX5: chromobox homolog 5 (HP1 α homolog, Drosophila) | 0.41 | 0.01 |
| H3F3B: H3 histone, family 3B (H3.3B) | 0.43 | 0.00 |
| ST6GALNAC6: ST6-N-acetylgalactosaminide α-2,6-sialyltransferase 6 | 0.43 | 0.00 |
| CRLF3: cytokine receptor-like factor 3 | 0.48 | 0.02 |
| TMEM183A: transmembrane protein 183A | 0.52 | 0.00 |
| TMEM183B: transmembrane protein 183B | 0.52 | 0.00 |
| LANCL1: LanC lantibiotic synthetase component C-like 1 (bacterial) | 0.54 | 0.01 |
| ANXA7: annexin A7 | 0.55 | 0.01 |
| CYTH1: cytohesin 1 | 0.57 | 0.00 |
| ARNTL: aryl hydrocarbon receptor nuclear translocator-like | 0.58 | 0.02 |
| ZMYND11: zinc finger, MYND domain containing 11 | 0.60 | 0.00 |
| BDNF: brain-derived neurotrophic factor | 0.61 | 0.01 |
| E2F7: E2F transcription factor 7 | 0.63 | 0.01 |
| UBE2I: ubiquitin-conjugating enzyme E2I (UBC9 homolog, yeast) | 0.63 | 0.01 |
| CNOT6: CCR4-NOT transcription complex, subunit 6 | 0.63 | 0.01 |
| KLHDC10: kelch domain containing 10 | 0.64 | 0.01 |
| GATA6: GATA binding protein 6 | 0.65 | 0.01 |
| GOLGA3: Golgi autoantigen, golgin subfamily a, 3 | 0.65 | 0.00 |
| SMAP1: stromal membrane-associated GTPase-activating protein 1 | 0.66 | 0.01 |
| MAPRE1: microtubule-associated protein, RP/EB family, member 1 | 0.66 | 0.03 |
| TFAP2C: transcription factor AP-2 γ (activating enhancer binding protein 2 γ) | 0.67 | 0.02 |
| NCOR2: nuclear receptor corepressor 2 | 0.68 | 0.04 |
| MAP3K7: mitogen-activated protein kinase kinase kinase 7 | 0.68 | 0.03 |
| HSPC159: galectin-related protein | 0.68 | 0.03 |
| FNBP1L: formin binding protein 1-like | 0.70 | 0.03 |
| PAPD5: PAP-associated domain containing 5 | 0.70 | 0.04 |
| PIK3CA: phosphoinositide-3-kinase, catalytic, α polypeptide | 0.71 | 0.00 |
| SCARB2: scavenger receptor class B, member 2 | 0.72 | 0.04 |
| CNNM4: cyclin M4 | 0.72 | 0.00 |
| TET2: tet oncogene family member 2 | 0.72 | 0.04 |
| SLC30A4: solute carrier family 30 (zinc transporter), member 4 | 0.73 | 0.02 |
| AP4E1: adaptor-related protein complex 4, ϵ 1 subunit | 0.73 | 0.01 |
| ARSJ: arylsulfatase family, member J | 0.74 | 0.01 |
| MTMR3: myotubularin related protein 3 | 0.75 | 0.03 |
| JARID2: jumonji, AT-rich interactive domain 2 | 0.75 | 0.04 |
| MAPKBP1: mitogen-activated protein kinase binding protein 1 | 0.76 | 0.03 |
| RORA: RAR-related orphan receptor A | 0.76 | 0.01 |
| BRWD3: bromodomain and WD repeat domain containing 3 | 0.76 | 0.03 |
| CREB1: cAMP responsive element binding protein 1 | 0.77 | 0.01 |
| SMURF1: SMAD-specific E3 ubiquitin protein ligase 1 | 0.77 | 0.00 |
| MAP3K2: mitogen-activated protein kinase kinase kinase 2 | 0.78 | 0.01 |
| RPRD1A: regulation of nuclear pre-mRNA domain containing 1A | 0.78 | 0.04 |
| BAZ2B: bromodomain adjacent to zinc finger domain, 2B | 0.78 | 0.04 |
| USP25: ubiquitin specific peptidase 25 | 0.79 | 0.01 |
| NUP50: nucleoporin 50 kDa | 0.79 | 0.02 |
| MTF1: metal-regulatory transcription factor 1 | 0.79 | 0.03 |
| WWC2: WW and C2 domain containing 2 | 0.80 | 0.02 |
| DOCK11: dedicator of cytokinesis 11 | 0.80 | 0.02 |
Genes with fold change (FC) < 0.8 and P < 0.05 shown.
Table 2.
Top 10 enriched pathways regulated by miR-10a
| Rank | Pathway | P | FDR |
|---|---|---|---|
| 1 | Cell cycle_The metaphase checkpoint | 3.651E-20 | 2.140E-17 |
| 2 | Cell cycle_Chromosome condensation in prometaphase | 1.054E-19 | 3.089E-17 |
| 3 | Cell cycle_Role of APC in cell cycle regulation | 2.150E-18 | 4.200E-16 |
| 4 | Cell cycle_Initiation of mitosis | 5.129E-13 | 7.514E-11 |
| 5 | Cell cycle_Start of DNA replication in early S phase | 4.915E-10 | 5.534E-08 |
| 6 | DNA damage_ATM/ATR regulation of G2/M checkpoint | 5.666E-10 | 5.534E-08 |
| 7 | DNA damage_ATM/ATR regulation of G1/S checkpoint | 1.076E-07 | 9.012E-06 |
| 8 | Cell cycle_Spindle assembly and chromosome separation | 1.495E-07 | 1.095E-05 |
| 9 | Cell cycle_Cell cycle (generic schema) | 3.672E-07 | 2.391E-05 |
| 10 | Cell cycle_Role of 14-3-3 proteins in cell cycle regulation | 5.590E-07 | 3.276E-05 |
All significant transcriptome changes [fold change (FC)<0.8 or FC>1.25, P<0.05] were included in gene-set enrichment analysis using the GeneGo software. Table lists enriched pathways with P values and false discovery rate (FDR) q values adjusted for multiple comparisons.
MiR-10a inhibits HASM cell proliferation
Because our pathway analysis suggests that miR-10a may function in cell cycle regulation, we next examined the effect of miR-10a on HASM cell growth and proliferation. We assessed HASM cell proliferation by 2 independent methods: cell counting and thymidine incorporation, which directly measures the rate of DNA synthesis. While the number of control HASM cells (transfected with scrambled siRNA) increased by 3-fold during 72 h after serum stimulation, the number of miR-10a mimic-transfected HASM cells only increased by 2-fold during the same time period. Such a reduction in cell number in miR-10a mimic-transfected cells was also evident at baseline only 1 d after transfection (Fig. 3A). Consistent with the results observed on direct cell counting, mir-10a mimic transfection in HASM cells reduced FBS-induced thymidine incorporation by ∼50% as compared to the control-transfected cells (Fig. 3B). Conversely transfection of an inhibitor of miR-10a increased thymidine uptake by ∼70% in HASM cells (Fig. 3C). Together, these results demonstrated that miR-10a is a negative regulator of ASM proliferation.
Figure 3.
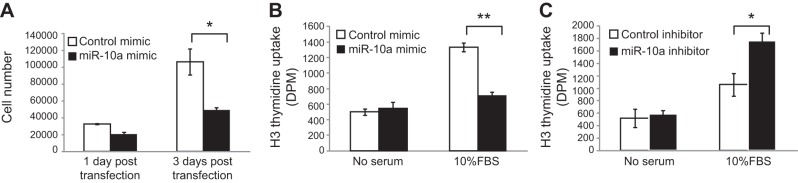
Effects of miR-10a on ASM proliferation. A) MiR-10a mimic expression inhibits HASM proliferation. HASM cells were transfected with either scrambled siRNA or miR-10a mimics, followed by serum starvation for 24 h. Cells were then allowed to grow in the presence of FBS for an additional 24 or 72 h, after which cell numbers were counted. Triplicates were done for each condition. Error bars = ses. B) MiR-10a mimics inhibit DNA synthesis in HASM cells. HASM cells were transfected for 48 h with either scrambled siRNA or miR-10a mimics and then serum starved for 24 h. H3-thymidine incorporation was measured in cells after 24 h of FBS stimulation. Error bars = se (n=5). C) MiR-10a inhibitor increases DNA synthesis in HASM cells. HASM cells were transfected with either a control miR inhibitor or miR-10a inhibitor for 48 h, and serum starved for 24 h. H3-thymidine incorporation was measured in cells after 24 h of FBS stimulation. Error bars = se (n=5). *P < 0.05, **P < 0.01; 2-tailed Student's test.
MiR-10a reduces the expression of cyclin-dependent kinases (CDKs) and cyclins in HASM cells
ASM cell proliferation is directly controlled by cyclins and CDKs (32, 33). To further investigate the effect of miR-10a on HASM proliferation, we examined the expression of several selected CDKs and cyclins (Cdk2, Cdk6, Cdc6, cyclin A2, cyclin B1, and cyclin B2), all of which are known to play important roles in cell cycle control: Cdk2 and Cdk6 regulate the checkpoint of G1 to S phase (31, 32). Cdc6 initiates DNA synthesis in the S phase, and its activity is tightly regulated by cyclin A and Cdk2 (33, 34). Cyclins B1 and B2 regulate G2 to M phase transition (35). As shown in Fig. 4A, mRNA levels as measured by qRT-PCR for all of the examined CDKs and cyclins were decreased (ranging from 40%–70% reduction) in miR-10a mimic-transfected HASM cells. Although down-regulated by miR-10a overexpression, none of these genes except Cdk6 was predicted to be direct target of miR-10a, suggesting that miR-10a likely acts directly on genes that are in the pathways upstream of cyclins and CDKs.
Figure 4.
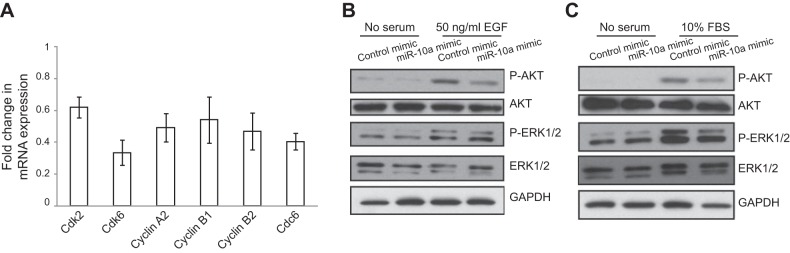
Effects of miR-10a on cyclin expression and AKT/ERK phosphorylation. A) MiR-10 mimic expression inhibits the expression of multiple cyclins and CDKs. HASM cells were transfected with scrambled siRNA control or miR-10a mimics for 48 h, RNA was extracted and analyzed with qRT-PCR to examine the levels of cyclin and Cdk gene expression. Triplicates were used for each condition. B) MiR-10a mimic expression inhibits PI3K-Akt signaling. HASM cells transfected with scrambled siRNA control or miR-10a mimics for 48 h were first serum starved for 24 h and then stimulated for 10 min with 50 ng/ml EGF or 10% FBS. Lysates from the cells were used to determine the level of AKT and ERK phosphorylation by immunoblotting. Total AKT and ERK levels, as well as GAPDH level, were also determined by immunoblotting using indicated antibodies.
MiR-10a inhibits PI3K signaling pathway in the HASM cells
Two major signaling pathways (PI3K-AKT and MAPK/ERK) transduce proliferation signals leading to the activation of cyclins and CDKs in HASM cells (8–13). On growth factor stimulation, PI3K is activated and increases the production of PIP3, which activates phosphoinositide-dependent kinase 1 (PDK1) and causes downstream phosphorylation of AKT (12); activation of MAPK/ERK pathway leads to the phosphorylation of the kinase. To determine which pathway is regulated by miR-10a, we determined the effect of miR-10a on PI3K and MAPK/ERK signaling pathway by measuring the phosphorylation of AKT and ERK. As shown in Fig. 4B, EGF treatment activated AKT phosphorylation in both control and miR-10a mimic-transfected HASM cells. However, the extent of activation as indicated by the intensity of pAKT signal was reduced by ∼55% in miR-10a mimic-transfected cells. Similarly, the level of AKT phosphorylation induced by FBS was reduced by ∼34% in miR-10a-overexpressing HASM cells (Fig. 4C). In contrast, we did not observe a consistent significant effect of miR-10a on ERK phosphorylation (Fig. 4C). These results suggest that the inhibitory effect of miR-10a on HASM cell proliferation is mostly mediated through the suppression of the PI3K-AKT signaling.
PIK3CA is a direct gene target of miR-10a
We next determined which genes in the PI3K-AKT pathway are the direct miR-10a targets that mediate the function of the miRNA. In our microarray experiment and the subsequent qRT-PRC validation (Fig. 2B), we found that the PIK3CA gene, which encodes the catalytic subunit of class IA form of PI3K, was significantly down-regulated (>60%) following miR-10a mimic expression in HASM cells. To further examine the effect of miR-10a on PIK3CA expression, we reexamined the effect of miR-10a mimics on PIK3CA mRNA along with miR-10a inhibitors. Our results showed that miR-10a mimic expression led to significant down-regulation in PIK3CA mRNA, whereas miR-10a inhibitors caused a modest increase in PI3K mRNA expression (Fig. 5A). We next used Western blotting to detect PIK3CA protein expression following miR-10a mimic and inhibitor transfection in HASM cells. As shown in Fig. 5B, miR-10a mimics reduced PIK3CA protein expression by ∼60%, whereas miR-10a inhibitor increased PIK3CA protein expression by ∼2-fold. These results clearly demonstrated the inhibitory effect of miR-10a on PIK3CA expression. PIK3CA was predicted in silico to be a miR-10a target gene, as the 3′-UTR of the transcript contains a site that is complementary to the seed sequence of miR-10a. To determine whether miR-10a suppresses PIK3CA expression by direct targeting of the 3′UTR of PIK3CA, we used a luciferase reporter-based assay. We fused either the wild type or a mutant form (in which we mutated the putative miR-10a target sequence through site-directed mutagenesis) of the PIK3CA 3′-UTR to the luciferase gene under the control of a CMV promoter. We then cotransfected the luciferase construct (wild type or mutant) along with either miR-10a mimics or control small RNA into HEK293 cells and measured the luciferase activity. As shown in Fig. 5C, miR-10a mimic significantly reduced (by ∼40%) the luciferase activity of the wild-type 3′-UTR construct. However, this repression of luciferase activity by miR-10a mimics was abolished in cells expressing the mutant 3′-UTR of PIK3CA with changes of 2 nt in the miR-10a binding site (Fig. 5C), indicating that the site in the PIK3CA 3′-UTR is required for the inhibitory effect of miR-10a. Together, these data demonstrated that miR-10a directly inhibits PIK3CA expression.
Figure 5.

Effects of miR-10a on PIK3CA expression. A) Effects of miR-10a mimics and inhibitors on PIK3CA mRNA expression. RNA was extracted from HASM cells transfected with scrambled siRNA control, miR-10a mimics, control miR-inhibitor, or miR-10a inhibitor and used for qRT-PCR. PIK3CA mRNA level was compared between miR-10 and its control-trnasfected HASM cells (or between miR-10a inhibitor and its control). Error bars = se (n=3). *P < 0.05; 2 tailed Student's t test. B) Effects of miR-10a mimics and inhibitor on PIK3CA protein expression. HASM cells were transfected with scrambled small-RNA control, miR-10a mimics, control miR-inhibitor, or miR-10a inhibitor. PIK3CA protein in the transfected HASM cells was detected using immunoblotting. Blots were scanned, and PIK3CA protein bands were quantified using ImageJ software and normalized against GAPDH. Error bars = se (n=3). *P < 0.05; 2 tailed Student's t test. C) MiR-10a directly targets the 3′-UTR of the PIK3CA gene. Luciferase construct was used to test whether miR-10a directly binds to PIK3CA. Full-length 3′UTR of PIK3CA was subcloned into the CMV-driven pMir-target luciferase vector (Origene). A mutant derivative (with 2-site mutation in the putative miR-10a recognition site) of the construct was made through site-directed mutagenesis. HEK293 cells were cotransfected with the luciferase construct with either miR-10a mimics and control scrambled small RNA for 48 h, followed by dual-luciferase assays. Error bars = se (n=10). *P < 0.05, **P < 0.01; 2 tailed Student's t test. D) Model for miR-10a-mediated inhibition on PI3K signaling and ASM proliferation. PI3K mediates the proliferation signals from mitogen-activated RTKs and GPCRs in the ASM. MiR-10a directly inhibits the expression of PIK3CA, the central component of the PI3K pathway, to suppress ASM proliferation.
DISCUSSION
Dysregulated ASM proliferation is a major driver of airway narrowing associated with lung diseases such as asthma. As such, a better understanding of how ASM proliferation is regulated will provide mechanistic insights for improving asthma therapy. Using next-generation deep sequencing, we identified a highly abundant miRNA (miR-10a) in cultured primary human ASM cells. We demonstrated that miR-10a inhibits the DNA synthesis and proliferation of ASM cells. Mechanistically, miR-10a modulates ASM proliferation by directly targeting PIK3CA and the associated PI3K pathway. These findings reported here thus revealed a novel miRNA-based mechanism for regulating ASM proliferation (Fig. 5D). To our knowledge, this study is also the first to experimentally identify a specific miRNA as a regulator of PIK3CA-the central component of the PI3K signaling pathway.
We initially focused on miR-10a largely because of its extreme abundance in ASM cells. While miR-10a is ubiquitously expressed, its expression in ASM is much higher than that in all other tissues including airway epithelial cells. A recent study globally examined miRNA function found that 60% of all miRNAs expressed at relatively low levels exert little effect on gene expression and are thus essentially nonfunctional (36), suggesting that only miRNAs that are highly abundant can mediate consequential target gene suppression. Moreover, miRNAs exhibiting a tissue/cell-enriched expression pattern often play important roles in that tissue or cell type. For example, miR-1a, which is highly enriched and abundant in the heart, regulates cardiac remodeling (26, 37); miR-122a, which accounts for 78% of all miRNAs in the liver, controls multiple processes critical for hepatic function (38). Consistent with these studies, our study demonstrated that the highly abundant miR-10a affects an important ASM phenotype by inhibiting DNA synthesis and proliferation of ASM cells.
MiR-10a is transcribed from the Hoxb locus. Several other miRNAs with similar sequences (miR-10b, miR-99a/b, and miR-100) are also transcribed from the vicinity of this Hox locus. Interestingly, miR-100 is also among the top 5 highly expressed miRNAs identified. The Hoxb locus is involved in lung branching morphogenesis and may determine cell fate in the lung (39). In mouse smooth muscle cells, miR-10a is induced by retinoic acid to promote the differentiation of embryonic stem cell into smooth muscle cells (40). It is conceivable that miR-10a expression increases during smooth muscle development and remains high after differentiation to control the growth of smooth muscle cells.
Previous studies had clearly demonstrated the role of the PI3K pathway in HASM cell proliferation (6, 7, 13). Our identification of miR-10a as a direct regulator of PI3K provides an additional layer of regulation in ASM proliferation. We established miR-10a as a novel regulator of PI3K signaling and demonstrated that miR-10a inhibits HASM cell proliferation by suppressing PI3K signaling through direct binding to the 3′-UTR of PIK3CA. Interestingly, we note that PIK3CA may not be the only miR-10a target in the PI3K pathway. The CDK Cdk6, which is known to regulate cell proliferation through the regulation of cell cycle (32), is also one of the top down-regulated miR-10a target genes. It is possible that miR-10a targets both PIK3CA and Cdk6 to inhibit PI3K signaling (Fig. 5D). At present, we cannot exclude the possibility that the observed miR-10a inhibitory effect on ASM proliferation is a combination of inhibition on both PIK3CA and Cdk6. Future experiments aiming to determine the direct targeting of Cdk6 by miR-10a may help strengthen the functional role of miR-10a in regulating the PI3K signaling pathway and ASM proliferation.
PI3K signaling is not the only pathway known to regulate ASM proliferation. Both PI3K/AKT and MAPK/ERK pathways are involved in growth factor-stimulated ASM proliferation (7, 9–11, 13). Consistent with these studies, our data showed that, on mitogen stimulation, there is a robust increase in AKT and ERK phosphorylation. Our microarray analysis of miR-10a-transfected HASM cells also showed that multiple genes (MAP3K2, MAP3K7, and MAPBP1) in the MAPK/ERK signaling pathway were down-regulated following miR-10a expression. Because of these results, we also examined the effect of miR-10a mimics on ERK phosphorylation. Despite the fact that multiple genes along the MAPK signaling pathway were down-regulated, miR-10a does not seem to significantly affect MAPK signaling, as indicated by ERK phosphorylation. It is possible that the MAP3Ks are several steps upstream of the MAPK signaling pathway, and other MAPK kinase kinases (MAPKKKs) may have compensated for the effect of the down-regulation of MAP3K2 and MAP3K7 by miR-10a.
Both MiR-10a and PI3K are highly evolutionarily conserved and are ubiquitously expressed in many other types of cells. We predict that the miR-10a regulation of PI3K plays important biological roles in tissues other than ASM proliferation. Indeed, miR-10a has been implicated in multiple cellular processes, such as inflammation, cell differentiation, immune cell function, and tumorigenesis (40–48). In particular, miR-10a has been implicated in development and cancer, as its expression is frequently altered in several cancers (49) and changes during cancer progression (50–52). The generation of miR-10a-knockdown transgenic mice revealed that miR-10a deficiency increases the frequency of intestine carcinoma (50). This is highly relevant, given that PI3K is one of the most dysregulated signaling pathways in cancer (53). It is possible that alteration in miR-10a expression may contribute to abnormal PI3K signaling in cancer. Exploring the miR-10a-PI3K link further will extend our current ASM study and may yield important mechanistic insights into cancer cell proliferation.
In summary, our study established miR-10a as a novel regulator of PI3K signaling and demonstrated that miR-10a inhibits ASM cell proliferation by suppressing PI3K signaling through direct targeting of the central PI3K pathway component, PIK3CA. Our findings raise the possibility of using miR-10a as a novel therapeutic agent to suppress PI3K signaling in order to prevent abnormal cell proliferation including that of the ASM.
Supplementary Material
Acknowledgments
This work was supported by U.S. National Institutes of Health (NIH) grants R01 HL114769 (Q.L.) and U01 HL065899 (S.T.W., Q.L., and K.T.). R.A.P. received support from NIH grants P01 HL114471 and P30 ES013508. R.H. was supported by a fellowship from the Canadian Institute of Health Research.
This article includes supplemental data. Please visit http://www.fasebj.org to obtain this information.
- 3′-UTR
- 3′-untranslated region
- AKT
- V-akt murine thymoma viral oncogene homolog 1
- ASM
- airway smooth muscle
- CDK
- cyclin-dependent kinase
- CMV
- cytomegalovirus
- EGF
- epidermal growth factor
- ERK
- extracellular signal regulated kinase
- GPCR
- G-protein coupled receptor
- HASM
- human airway smooth muscle
- IL-1β
- interleukin 1β
- miRNA
- microRNA
- MAPK
- mitogen-activated protein kinase
- PDGF
- platelet-derived growth factor
- PI3K
- phosphoinositide 3 kinase
- PIK3CA
- phosphoinositide 3 kinase catalytic subunit α
- qRT-PCR
- quantitative reverse transcription–polymerase chain reaction
- RTK
- receptor tyrosine kinase
- RT-PCR
- reverse transcription–polymerase chain reaction
- siRNA
- small interfering RNA
- UTR
- untranslated region;
REFERENCES
- 1. Panettieri R. A., Jr., Kotlikoff M. I., Gerthoffer W. T., Hershenson M. B., Woodruff P. G., Hall I. P., Banks-Schlegel S. (2008) Airway smooth muscle in bronchial tone, inflammation, and remodeling: basic knowledge to clinical relevance. Am. J. Respir. Crit. Care Med. 177, 248–252 [DOI] [PMC free article] [PubMed] [Google Scholar]
- 2. Fernandes D. J., Xu K. F., Stewart A. G. (2001) Anti-remodelling drugs for the treatment of asthma: requirement for animal models of airway wall remodelling. Clin. Exp. Pharmacol. Physiol. 28, 619–629 [DOI] [PubMed] [Google Scholar]
- 3. Stewart A. G. (2001) Airway wall remodelling and hyperresponsiveness: modelling remodelling in vitro and in vivo. Pulm. Pharmacol. Ther. 14, 255–265 [DOI] [PubMed] [Google Scholar]
- 4. Benayoun L., Druilhe A., Dombret M. C., Aubier M., Pretolani M. (2003) Airway structural alterations selectively associated with severe asthma. Am. J. Respir. Crit. Care Med. 167, 1360–1368 [DOI] [PubMed] [Google Scholar]
- 5. Martin J. G., Ramos-Barbon D. (2003) Airway smooth muscle growth from the perspective of animal models. Respir. Physiol. Neurobiol. 137, 251–261 [DOI] [PubMed] [Google Scholar]
- 6. Walker T. R., Moore S. M., Lawson M. F., Panettieri R. A., Jr., Chilvers E. R. (1998) Platelet-derived growth factor-BB and thrombin activate phosphoinositide 3-kinase and protein kinase B: role in mediating airway smooth muscle proliferation. Mol. Pharmacol. 54, 1007–1015 [DOI] [PubMed] [Google Scholar]
- 7. Krymskaya V. P., Ammit A. J., Hoffman R. K., Eszterhas A. J., Panettieri R. A., Jr. (2001) Activation of class IA PI3K stimulates DNA synthesis in human airway smooth muscle cells. Am. J. Physiol. Lung Cell. Mol. Physiol. 280, L1009–L1018 [DOI] [PubMed] [Google Scholar]
- 8. Karpova A. Y., Abe M. K., Li J., Liu P. T., Rhee J. M., Kuo W. L., Hershenson M. B. (1997) MEK1 is required for PDGF-induced ERK activation and DNA synthesis in tracheal myocytes. Am. J. Physiol. 272, L558–L565 [DOI] [PubMed] [Google Scholar]
- 9. Whelchel A., Evans J., Posada J. (1997) Inhibition of ERK activation attenuates endothelin-stimulated airway smooth muscle cell proliferation. Am. J. Respir. Cell Mol. Biol. 16, 589–596 [DOI] [PubMed] [Google Scholar]
- 10. Orsini M. J., Krymskaya V. P., Eszterhas A. J., Benovic J. L., Panettieri R. A., Jr., Penn R. B. (1999) MAPK superfamily activation in human airway smooth muscle: mitogenesis requires prolonged p42/p44 activation. Am. J. Physiol. 277, L479–L488 [DOI] [PubMed] [Google Scholar]
- 11. Page K., Li J., Hershenson M. B. (1999) Platelet-derived growth factor stimulation of mitogen-activated protein kinases and cyclin D1 promoter activity in cultured airway smooth-muscle cells. Role of Ras. Am. J. Respir. Cell Mol. Biol. 20, 1294–1302 [DOI] [PubMed] [Google Scholar]
- 12. Wymann M. P., Zvelebil M., Laffargue M. (2003) Phosphoinositide 3-kinase signaling: which way to target? Trends Pharmacol. Sci. 24, 366–376 [DOI] [PubMed] [Google Scholar]
- 13. Krymskaya V. P., Penn R. B., Orsini M. J., Scott P. H., Plevin R. J., Walker T. R., Eszterhas A. J., Amrani Y., Chilvers E. R., Panettieri R. A., Jr. (1999) Phosphatidylinositol 3-kinase mediates mitogen-induced human airway smooth muscle cell proliferation. Am. J. Physiol. 277, L65–L78 [DOI] [PubMed] [Google Scholar]
- 14. Scott P. H., Belham C. M., al-Hafidh J., Chilvers E. R., Peacock A. J., Gould G. W., Plevin R. (1996) A regulatory role for cAMP in phosphatidylinositol 3-kinase/p70 ribosomal S6 kinase-mediated DNA synthesis in platelet-derived-growth-factor-stimulated bovine airway smooth-muscle cells. Biochem. J. 318(Pt. 3), 965–971 [DOI] [PMC free article] [PubMed] [Google Scholar]
- 15. He L., Hannon G. J. (2004) MicroRNAs: small RNAs with a big role in gene regulation. Nat. Rev. Genet. 5, 522–531 [DOI] [PubMed] [Google Scholar]
- 16. Ameres S. L., Zamore P. D. (2013) Diversifying microRNA sequence and function. Nat. Rev. Mol. Cell Biol. 14, 475–488 [DOI] [PubMed] [Google Scholar]
- 17. Bartel D. P. (2004) MicroRNAs: genomics, biogenesis, mechanism, and function. Cell 116, 281–297 [DOI] [PubMed] [Google Scholar]
- 18. Perry M. M., Moschos S. A., Williams A. E., Shepherd N. J., Larner-Svensson H. M., Lindsay M. A. (2008) Rapid changes in microRNA-146a expression negatively regulate the IL-1beta-induced inflammatory response in human lung alveolar epithelial cells. J. Immunol. 180, 5689–5698 [DOI] [PMC free article] [PubMed] [Google Scholar]
- 19. Mattes J., Collison A., Plank M., Phipps S., Foster P. S. (2009) Antagonism of microRNA-126 suppresses the effector function of TH2 cells and the development of allergic airways disease. Proc. Natl. Acad. Sci. U. S. A. 106, 18704–18709 [DOI] [PMC free article] [PubMed] [Google Scholar]
- 20. Kuhn A. R., Schlauch K., Lao R., Halayko A. J., Gerthoffer W. T., Singer C. A. (2010) MicroRNA expression in human airway smooth muscle cells: role of miR-25 in regulation of airway smooth muscle phenotype. Am. J. Respir. Cell Mol. Biol. 42, 506–513 [DOI] [PMC free article] [PubMed] [Google Scholar]
- 21. Chiba Y., Tanabe M., Goto K., Sakai H., Misawa M. (2009) Down-regulation of miR-133a contributes to up-regulation of Rhoa in bronchial smooth muscle cells. Am. J. Respir. Crit. Care Med. 180, 713–719 [DOI] [PubMed] [Google Scholar]
- 22. Wang W. C., Juan A. H., Panebra A., Liggett S. B. (2011) MicroRNA let-7 establishes expression of beta2-adrenergic receptors and dynamically down-regulates agonist-promoted down-regulation. Proc. Natl. Acad. Sci. U. S. A. 108, 6246–6251 [DOI] [PMC free article] [PubMed] [Google Scholar]
- 23. Perry M. M., Baker J. E., Gibeon D. S., Adcock I. M., Chung K. F. (2014) Airway smooth muscle hyperproliferation is regulated by microRNA-221 in severe asthma. Am. J. Resp. Cell Mol. Biol. 50, 7–17 [DOI] [PMC free article] [PubMed] [Google Scholar]
- 24. Panettieri R. A., Murray R. K., DePalo L. R., Yadvish P. A., Kotlikoff M. I. (1989) A human airway smooth muscle cell line that retains physiological responsiveness. Am. J. Physiol. 256, C329–335 [DOI] [PubMed] [Google Scholar]
- 25. Jiang X., Pan H., Nabhan J. F., Krishnan R., Koziol-White C., Panettieri R. A., Lu Q. (2012) A novel EST-derived RNAi screen reveals a critical role for farnesyl diphosphate synthase in beta2-adrenergic receptor internalization and down-regulation. FASEB J. 26, 1995–2007 [DOI] [PMC free article] [PubMed] [Google Scholar]
- 26. Landgraf P., Rusu M., Sheridan R., Sewer A., Iovino N., Aravin A., Pfeffer S., Rice A., Kamphorst A. O., Landthaler M., Lin C., Socci N. D., Hermida L., Fulci V., Chiaretti S., Foa R., Schliwka J., Fuchs U., Novosel A., Muller R. U., Schermer B., Bissels U., Inman J., Phan Q., Chien M., Weir D. B., Choksi R., De Vita G., Frezzetti D., Trompeter H. I., Hornung V., Teng G., Hartmann G., Palkovits M., Di Lauro R., Wernet P., Macino G., Rogler C. E., Nagle J. W., Ju J., Papavasiliou F. N., Benzing T., Lichter P., Tam W., Brownstein M. J., Bosio A., Borkhardt A., Russo J. J., Sander C., Zavolan M., Tuschl T. (2007) A mammalian microRNA expression atlas based on small RNA library sequencing. Cell 129, 1401–1414 [DOI] [PMC free article] [PubMed] [Google Scholar]
- 27. Livak K. J., Schmittgen T. D. (2001) Analysis of relative gene expression data using real-time quantitative PCR and the 2(-delta delta C(T)) method. Methods 25, 402–408 [DOI] [PubMed] [Google Scholar]
- 28. Schmittgen T. D., Livak K. J. (2008) Analyzing real-time PCR data by the comparative C(T) method. Nat. Protoc. 3, 1101–1108 [DOI] [PubMed] [Google Scholar]
- 29. Bartel D. P. (2009) MicroRNAs: target recognition and regulatory functions. Cell 136, 215–233 [DOI] [PMC free article] [PubMed] [Google Scholar]
- 30. Selbach M., Schwanhausser B., Thierfelder N., Fang Z., Khanin R., Rajewsky N. (2008) Widespread changes in protein synthesis induced by microRNAs. Nature 455, 58–63 [DOI] [PubMed] [Google Scholar]
- 31. Neganova I., Vilella F., Atkinson S. P., Lloret M., Passos J. F., von Zglinicki T., O'Connor J. E., Burks D., Jones R., Armstrong L., Lako M. (2011) An important role for CDK2 in G1 to S checkpoint activation and DNA damage response in human embryonic stem cells. Stem Cells 29, 651–659 [DOI] [PubMed] [Google Scholar]
- 32. Meyerson M., Harlow E. (1994) Identification of G1 kinase activity for cdk6, a novel cyclin D partner. Mol. Cell. Biol. 14, 2077–2086 [DOI] [PMC free article] [PubMed] [Google Scholar]
- 33. Petersen B. O., Lukas J., Sorensen C. S., Bartek J., Helin K. (1999) Phosphorylation of mammalian CDC6 by cyclin A/CDK2 regulates its subcellular localization. EMBO J. 18, 396–410 [DOI] [PMC free article] [PubMed] [Google Scholar]
- 34. Herbig U., Marlar C. A., Fanning E. (1999) The Cdc6 nucleotide-binding site regulates its activity in DNA replication in human cells. Mol. Biol. Cell 10, 2631–2645 [DOI] [PMC free article] [PubMed] [Google Scholar]
- 35. Innocente S. A., Abrahamson J. L., Cogswell J. P., Lee J. M. (1999) p53 regulates a G2 checkpoint through cyclin B1. Proc. Natl. Acad. Sci. U. S. A. 96, 2147–2152 [DOI] [PMC free article] [PubMed] [Google Scholar]
- 36. Mullokandov G., Baccarini A., Ruzo A., Jayaprakash A. D., Tung N., Israelow B., Evans M. J., Sachidanandam R., Brown B. D. (2012) High-throughput assessment of microRNA activity and function using microRNA sensor and decoy libraries. Nat. Methods 9, 840–846 [DOI] [PMC free article] [PubMed] [Google Scholar]
- 37. Lagos-Quintana M., Rauhut R., Yalcin A., Meyer J., Lendeckel W., Tuschl T. (2002) Identification of tissue-specific microRNAs from mouse. Curr. Biol. 12, 735–739 [DOI] [PubMed] [Google Scholar]
- 38. Hsu S. H., Wang B., Kota J., Yu J., Costinean S., Kutay H., Yu L., Bai S., La Perle K., Chivukula R. R., Mao H., Wei M., Clark K. R., Mendell J. R., Caligiuri M. A., Jacob S. T., Mendell J. T., Ghoshal K. Essential metabolic, anti-inflammatory, and anti-tumorigenic functions of miR-122 in liver. J. Clin. Invest. 122, 2871–2883 [DOI] [PMC free article] [PubMed] [Google Scholar]
- 39. Volpe M. V., Martin A., Vosatka R. J., Mazzoni C. L., Nielsen H. C. (1997) Hoxb-5 expression in the developing mouse lung suggests a role in branching morphogenesis and epithelial cell fate. Histochem. Cell Biol. 108, 495–504 [DOI] [PubMed] [Google Scholar]
- 40. Huang H., Xie C., Sun X., Ritchie R. P., Zhang J., Chen Y. E. (2010) miR-10a contributes to retinoid acid-induced smooth muscle cell differentiation. J. Biol. Chem. 285, 9383–9389 [DOI] [PMC free article] [PubMed] [Google Scholar]
- 41. Roman-Gomez J., Jimenez-Velasco A., Agirre X., Castillejo J. A., Navarro G., Calasanz M. J., Garate L., San Jose-Eneriz E., Cordeu L., Prosper F., Heiniger A., Torres A. (2006) CpG island methylator phenotype redefines the prognostic effect of t(12;21) in childhood acute lymphoblastic leukemia. Clin. Cancer Res. 12, 4845–4850 [DOI] [PubMed] [Google Scholar]
- 42. Weiss F. U., Marques I. J., Woltering J. M., Vlecken D. H., Aghdassi A., Partecke L. I., Heidecke C. D., Lerch M. M., Bagowski C. P. (2009) Retinoic acid receptor antagonists inhibit miR-10a expression and block metastatic behavior of pancreatic cancer. Gastroenterology 137, 2136–2145 e2131–2137 [DOI] [PubMed] [Google Scholar]
- 43. Fang Y., Shi C., Manduchi E., Civelek M., Davies P. F. (2010) MicroRNA-10a regulation of proinflammatory phenotype in athero-susceptible endothelium in vivo and in vitro. Proc. Natl. Acad. Sci. U. S. A. 107, 13450–13455 [DOI] [PMC free article] [PubMed] [Google Scholar]
- 44. Meseguer S., Mudduluru G., Escamilla J. M., Allgayer H., Barettino D. (2011) MicroRNAs-10a and -10b contribute to retinoic acid-induced differentiation of neuroblastoma cells and target the alternative splicing regulatory factor SFRS1 (SF2/ASF). J. Biol. Chem. 286, 4150–4164 [DOI] [PMC free article] [PubMed] [Google Scholar]
- 45. Foley N. H., Bray I., Watters K. M., Das S., Bryan K., Bernas T., Prehn J. H., Stallings R. L. (2011) MicroRNAs 10a and 10b are potent inducers of neuroblastoma cell differentiation through targeting of nuclear receptor corepressor 2. Cell Death Differ. 18, 1089–1098 [DOI] [PMC free article] [PubMed] [Google Scholar]
- 46. Xue X., Feng T., Yao S., Wolf K. J., Liu C. G., Liu X., Elson C. O., Cong Y. (2011) Microbiota downregulates dendritic cell expression of miR-10a, which targets IL-12/IL-23p40. J. Immunol. 187, 5879–5886 [DOI] [PMC free article] [PubMed] [Google Scholar]
- 47. Bryant A., Palma C. A., Jayaswal V., Yang Y. W., Lutherborrow M., Ma D. D. (2012) miR-10a is aberrantly overexpressed in Nucleophosmin1 mutated acute myeloid leukaemia and its suppression induces cell death. Mol. Cancer 11, 8. [DOI] [PMC free article] [PubMed] [Google Scholar]
- 48. Takahashi H., Kanno T., Nakayamada S., Hirahara K., Sciume G., Muljo S. A., Kuchen S., Casellas R., Wei L., Kanno Y., O'Shea J. J. (2012) TGF-beta and retinoic acid induce the microRNA miR-10a, which targets Bcl-6 and constrains the plasticity of helper T cells. Nat. Immunol. 13, 587–595 [DOI] [PMC free article] [PubMed] [Google Scholar]
- 49. Lund A. H. (2010) miR-10 in development and cancer. Cell Death Differ. 17, 209–214 [DOI] [PubMed] [Google Scholar]
- 50. Stadthagen G., Tehler D., Hoyland-Kroghsbo N. M., Wen J., Krogh A., Jensen K. T., Santoni-Rugiu E., Engelholm L. H., Lund A. H. (2013) Loss of miR-10a activates Lpo and collaborates with activated Wnt signaling in inducing intestinal neoplasia in female mice. PLoS Gen. 9, e1003913. [DOI] [PMC free article] [PubMed] [Google Scholar]
- 51. Hoppe R., Achinger-Kawecka J., Winter S., Fritz P., Lo W. Y., Schroth W., Brauch H. (2013) Increased expression of miR-126 and miR-10a predict prolonged relapse-free time of primary oestrogen receptor-positive breast cancer following tamoxifen treatment. Eur. J. Cancer 49, 3598–3608 [DOI] [PubMed] [Google Scholar]
- 52. Kohler C. U., Bryk O., Meier S., Lang K., Rozynek P., Bruning T., Kafferlein H. U. (2013) Analyses in human urothelial cells identify methylation of miR-152, miR-200b and miR-10a genes as candidate bladder cancer biomarkers. Biochem. Biophys. Res. Commun. 438, 48–53 [DOI] [PubMed] [Google Scholar]
- 53. Engelman J. A. (2009) Targeting PI3K signalling in cancer: opportunities, challenges and limitations. Nat. Rev. Cancer 9, 550–562 [DOI] [PubMed] [Google Scholar]
Associated Data
This section collects any data citations, data availability statements, or supplementary materials included in this article.