

Abstract
Circulating tumor cells (CTCs) are the principal vehicle for the spread of non-hematologic cancer disease from a primary tumor, involving extravasation of CTCs across blood vessel walls, to form secondary tumors in remote organs. Herein, a polydimethylsiloxane-based microfluidic system is developed and characterized for in vitro systematic studies of organ-specific extravasation of CTCs. The system recapitulates the two major aspects of the in vivo extravasation microenvironment: local signaling chemokine gradients in a vessel with an endothelial monolayer. The parameters controlling the locally stable chemokine gradients, flow rate, and initial chemokine concentration are investigated experimentally and numerically. The microchannel surface treatment effect on the confluency and adhesion of the endothelial monolayer under applied shear flow has also been characterized experimentally. Further, the conditions for driving a suspension of CTCs through the microfluidic system are discussed while simultaneously maintaining both the local chemokine gradients and the confluent endothelial monolayer. Finally, the microfluidic system is utilized to demonstrate extravasation of MDA-MB-231 cancer cells in the presence of CXCL12 chemokine gradients. Consistent with the hypothesis of organ-specific extravasation, control experiments are presented to substantiate the observation that the MDA-MB-231 cell migration is attributed to chemotaxis rather than a random process.
INTRODUCTION
Tumor metastasis is one of the hallmarks of malignant cancer1, 2 and is considered to be the cause of 90% of cancer-related human deaths.3 The major threat of cancer disease is therefore the spread of malignant cells from a primary tumor and formation of metastatic secondary tumors in host organs. Cancer metastasis is a complex multi-step process influenced by numerous cellular and molecular characteristics of both host organ and tumor.4, 5 During hematogenous metastasis, epithelial cancer cells detach from the primary tumor, migrate, and intravasate into the vascular system through capillary vessels. Cancer cells from a primary tumor transported in the blood stream are called circulating tumor cells (CTCs).6, 7, 8, 9, 10 CTCs spread with circulation to remote sites; and subsequently, they can extravasate from the vascular system through blood vessel walls into the surrounding tissue forming secondary tumors at host organs.11, 12 Much of the research effort has thus far been devoted to the formation of primary tumors.13 However, issues related to cancer metastasis have recently been receiving significant attention since understanding this process could lead to new and more effective therapeutic strategies in effort to eradicate the disease.14, 15
CTC extravasation is one of the most crucial stages in cancer-disease development leading to the establishment of secondary micrometastases in host organs.16 While the extravasation of white blood cells in the presence of inflammation/infection at an injury site is well documented, extravasation of CTCs is still unknown. The “seed-and-soil” hypothesis stipulates that cancer cells spread randomly to other organs, but survive only in sites that produce appropriate growth factors.17, 18, 19, 20 In contrast, the “homing” hypothesis of organ-selective cancer metastasis, due to specific protein-protein interactions, is currently gaining popularity.21, 22, 23 In this regard, several studies proposed the involvement of receptors and localized chemokine signals in directing tumor cells to certain organs and site of the body.24, 25 Extravasation of circulating cells consists of: (i) initial adherence by binding to endothelial cells resulting in a rolling motion, (ii) firm adhesion leading to a complete arrest adjacent to a vessel wall, and (iii) transmigration across the endothelium, squeezing between adjacent endothelial cells, into the surrounding tissue.26 Two mechanisms have been proposed for CTC arrest on a vessel wall: (i) specific biochemical interaction between CTCs and activated endothelial cells similar to initial inflammatory response and (ii) entrapment of CTCs in small vessels due to size restriction as they tend be relatively large. Both arrest mechanisms have been observed,27, 28, 29 and it is still not clear which mechanism is dominant or whether different CTCs are prone to a particular mechanism. Furthermore, following transmigration, tumor-cell invasiveness and secondary-tumor formation depend on the interaction of the invading tumor cells with both host cells and extracellular matrix (ECM) components in a complex microenvironment.30, 31 The effects of microenvironmental conditions and guiding signals within the surrounding tissue on CTC extravasation have yet to be well understood.
Extravasation studies rely heavily on tail-vein injection of tumor cells to mice and rats with subsequent in vivo epifluorescence microscopy of the labeled tumor cells in subpleural microvessels.32 While these experiments provide the most physiologically relevant conditions for extravasation, they are limited in studying interactions between tumor cells and blood vessels due to a narrow range of parameters available and imaging difficulties. A widely utilized model to study the invasion or migration of cancer cells in vitro is based on the Boyden chamber system,33 which is relatively simple to operate. However, it is restricted in investigating the complex interactions between tumor cells and the endothelium that take place during metastasis due to its lack of the basic components of blood vessels. Consequently, the Boyden chamber offers very limited control over the local microenvironment, which is critical for the extravasation process. Microfluidic-based platforms, with a functional blood vessel model, provide solutions to many of these problems allowing direct control of several biochemical and biophysical parameters affecting CTC extravasation.34, 35, 36, 37, 38, 39
While in vitro systems cannot fully recapitulate in vivo conditions, microfluidics offers a promising alternative for in vitro studies of tumor cell behavior in blood vessels. Microfluidic devices enable the creation of specific organ microenvironment, generation of particular signaling cues, and experimentation with different cancer cell types.40 Furthermore, they allow quantitative analysis of various control parameters as well as convenient optical access for continuous monitoring and recording of events within the devices. Recently, several microfluidic systems were employed to study cell migration and tumor cell intravasation.36, 37 A microfluidic model was also developed to reconstitute the principal components of biological blood vessels, including vessel cavity, endothelium, and perivascular matrix containing chemokines.38 Using this model, the transendothelial invasion of tumor aggregates was observed and recorded in real-time. Most recently, a microfluidic system was developed to mimic tumor cell extravasation where cancer cells can transmigrate across an endothelial monolayer into a hydrogel that models the extracellular space.39 Nevertheless, several key aspects of tumor cell extravasation have not been explored or optimized systematically.
In this paper, we report the development of a microfluidic system, mimicking the microenvironment of circulating tumor cells in blood with localized chemokine gradient, to enable in vitro systematic studies of organ-specific metastasis under constant flow rate. In particular, we present a quantitative analysis of parameters controlling the microenvironment, stable endothelial monolayer, and steady chemokine gradients, and propose proper operational ranges. Finally, following the suggested guidelines, CTC extravasation in the developed microsystem is demonstrated.
MATERIALS AND METHODS
Microfluidic device fabrication
A microfluidic device, made of a molded PDMS (polydimethylsiloxane) substrate bonded to a glass slide, was designed and fabricated. The device structure and operation is illustrated in Figure 1a, while the design layout and dimensions are detailed in Supplementary Figure S1.41 The device features a suspension-flow channel, about 150 μm × 500 μm × 3 cm in dimensions, connected to the chemokine inlet via six chemokine-injection channels, each about 100 μm × 250 μm × 1 mm. A negative mold was constructed by two successive drilling steps of grooves in an aluminum block, corresponding to the channels with different heights. A positive mold was realized next by dispensing epoxy on the aluminum negative mold, and separating the cured epoxy from the aluminum mold. The microfluidic devices were then fabricated by peeling off PDMS replicates, cured over the epoxy mold, and bonding them onto glass substrates. An image of a fabricated device is shown in Figure 1b.
Figure 1.

Device design and fabrication: (a) Schematic illustration of the device structure and operation, and (b) an image of a fabricated microfluidic device.
Chemokine gradients in the suspension-flow channel
The effect of flow rate and initial chemokine concentration on the resulting steady-state concentration distributions and their gradients were analyzed numerically. A physical model identical to the fabricated device described in Supplementary Figure S1 (Ref. 41) was constructed, and numerical simulations were performed using COMSOL Multiphysics commercial software. The 3D steady-state incompressible Navier-Stokes module combined with the Convection-Diffusion module was applied to compute flow properties. Fluid flow in the suspension-flow channel only was considered with standard boundary conditions: imposed velocity profile at the inlet (corresponding to a constant flow rate), uniform atmospheric pressure at the outlet, and no-slip boundary condition along the channel walls. Fluid in the entire device, including the suspension-flow and the six chemokine-injection channels, is considered for the convection-diffusion model. The chemokine loading network acts as a source for the chemokine diffusion; due to its significant large volume compared to that of the chemokine-injection channels, a constant concentration condition is imposed at the interfaces between the chemokine-injection channels and the chemokine-loading network. Zero concentration and convective flux is set at the suspension channel inlet and outlet, respectively, while insulation boundary condition is set for all the walls involved. About 70 000 mesh elements were constructed with optimized distributions around the intersections of the channels and the boundaries, and each simulation run lasted about 10 min on a standard PC.
Experimentally, in order to generate a diffusion source for controlling chemokine gradients,42 we loaded a gel-protein mixture into the device through the chemokine inlet. First, 7.0 mg/ml Engelbreth-Holm-Swarm (EHS) (Matrigel, BD Bioscience) was thawed overnight at 4 °C. A suspension of either Fluorescein (0.33 kDa, Sigma-Aldrich, MO) or CXCL12 chemokine labeled with Alexa 647 (8.7 kDa, Almac, UK), at a pre-determined concentration, was mixed with the thawed Matrigel at 4 °C. CXCL12 was selected as the chemokine protein because it has a critical role in tumor metastasis in which cancer cells expressing the CXCR4 receptor are attracted to metastasis target organs that release the CXCL12 ligand.25 A 3 μl sample of the cold mixture was then applied to the chemokine inlet of each microfluidic device. The liquid mixture was driven into the channel by capillary force, stopping at the intersection between the 6 chemokine-injection channels and the suspension-flow channel by surface tension due to the height mismatch. The CXCL12–Matrigel mixture was polymerized after about 5 min incubation at 37 °C. Immediately after polymerization, cell culture medium was driven through the suspension-flow channel to prevent dehydration and shrinkage of the cured gel mixture. The device was incubated for additional 5 min before experimentation. A programmable syringe pump was then utilized to drive culture medium into the suspension-flow channel, under selected flow rates, to characterize the concentration distributions in the suspension-flow channel due to diffusion from the six chemokine-injection channels. Péclet number was used as the control parameter to distinguish between the diffusion- or convection-dominant regimes governing chemokine gradients in the suspension-flow channel.
Cell culture
Human umbilical vein endothelial cells (HUVEC) were commercially obtained from American Type Culture Collection (ATCC CRL-1730). Cells were cultured in F-12K Medium (ATCC) supplemented with 20% screened FBS (Gemini BioProducts, CA), 0.035 mg/ml endothelial cell growth supplement (Sigma-Aldrich, MO), 0.1 mg/ml heparin (Sigma-Aldrich), and 0.1% gentamycin (GIBCO). All experiments were conducted using HUVECs between passages 3–7. Human breast adenocarcinoma cell line MDA-MB-231 (ATCC HTB-26), passages 5-10, was selected for circulating tumor cell studies due to its invasiveness and high expression of the CXCR4 receptor.25 Human mammary epithelial cell line MCF7 (ATCC HTB-22) was also used as control since its expression level of the CXCR4 receptor was reported to be significantly lower than that of MDA-MB-231.25, 43 Both types of mammary cancer cells were cultured in Dulbecco's Modified Eagle Medium (Invitrogen, CA) supplemented with 10% deactivated fetal bovine serum (Gemini BioProducts, CA), 2 mM HEPES buffer (Sigma-Aldrich), and 0.1% gentamycin (GIBCO). All cell lines were cultured in a humidified incubator at 37 °C with 5% CO2.
Immunofluorescence staining assay
Immunostaining was performed to demonstrate the formation of a confluent endothelial monolayer. HUVEC cells were fixed using 3.0% formaldehyde for 15 min at room temperature. Permeabilization was achieved by incubating 0.1% Triton X-100 for 10 min at room temperature. After blocking with phosphate buffered saline (PBS) containing 5% goat serum for 30 min, cells were incubated for 60 min with primary antibody against vascular endothelial (VE)-cadherin from Cell Signaling Technology (Beverly, MA, 1:300 dilution). The primary antibody was detected by anti-rabbit Alexa Fluor 488-conjugated secondary IgG antibody from Invitrogen (Carlsbad, CA, 1:300 dilution) after 60 min incubation. Nuclei were counterstained with 1.0 μg/ml Hoechst-33342 (Invitrogen, USA) for 5 min after secondary antibody incubation.
Surface coating and cell-detachment assay
Straight microchannels with similar dimensions as the suspension-flow channel were used for the surface coating assay.44, 45 The effect of surface treatment on the resulting endothelial monolayer was evaluated; three different surface conditions were examined: (i) bare glass substrate with no coating, (ii) 1.5 mg/ml Matrigel coating, and (iii) 3.0 mg/ml Matrigel coating with various incubation time periods and different cell seeding concentrations in the range of 105 to 6 × 10⁶cell/ml.
The microchannels were also used for the assessment of endothelial cell adhesion depending on the surface treatment. A 30 μl cell suspension at a concentration of 3 × 10⁶cell/ml was introduced into the suspension-flow channel following the three tested surface conditions: 0, 1.5, and 3.0 mg/ml Matrigel coating for 90 s incubation time. Cells were cultured within the microchannels placed in the incubator, for 3 h at 37 °C, prior to applying various flow rates. The Syringe pump was then connected to the suspension-flow channel inlet providing for 5 min a constant flow rate in a range up to 300 ml/h to determine the detached-cell fraction.
CTC extravasation experimental setup
The experimental set up for CTC extravasation studies required a suitable microenvironment of steady chemokine gradients with a stable endothelial monolayer. The selected CXCL12 chemokine was mixed with thawed Matrigel at final concentration of 4.0 μM and loaded into the device through the chemokine inlet. For the surface coating, 3.0 mg/ml, Matrigel solution was incubated for 90 s in the suspension-flow channel, which was subsequently rinsed with endothelial-culture medium to eliminate excessive amount of coating solution. Next, 30 μl of well-mixed HUVEC cell suspension at a concentration of 3 × 10⁶cells/ml was pipetted into the suspension-flow channel and cultured for 5 h; this allowed cell sedimentation and formation of a fully confluent endothelial monolayer on the surface as well as cell adhesion to the gel boundaries along the suspension-flow channel. Following endothelial monolayer formation, the microfluidic device was mounted on a microscope stage-top incubator (Okolab, Italy) for tumor cell loading and live-cell imaging. MDA-MB-231 cells suspended in tumor-cell culture medium at a concentration of 105cell/ml were then loaded into the suspension-flow channel with steady 50 μl/h flow rate using a syringe pump. To track tumor cells location and monitor their migration patterns, MDA-MB-231 cells were stained by CellTrackerTM Green (Invitrogen, CA) prior to loading into suspension-flow channel. Upon tumor cells loading, the flow rate was lowered to allow settlement of the CTCs on the HUVEC cell monolayer. After 2 h incubation at 37 °C, tumor-cell culture medium was replaced by endothelial-culture medium delivered at steady 3 μl/h flow rate through the suspension-flow channel to maintain local chemokine gradients for the duration of the experiment; the channel outlet was connected to a culture-medium reservoir to avoid dehydration. The behavior of the loaded tumor cells and endothelial monolayer was video-recorded over one day.
Microscope-imaging and statistical analysis
All cell activities were monitored using an inverted fluorescence microscope TE2000-U (Nikon, Japan). Phase contrast and fluorescence images as well as time lapse videos were captured using a HQ2 CCD camera (Photometric, Tucson, AZ) with 4× and 10× magnification objectives. All fluorescence images were taken with 1 s exposure time with 50% excitation intensity in order to compare the relative emission fluorescence intensity. Time lapse videos were recorded with 2 min interval for 30 h. Data collection and imaging analysis were performed using the NIH ImageJ software. For number of extravasated cells and cell distance travelled, each data point represents mean ± SEM of at least 15 cells after 30 h incubation. Statistical analysis was carried out using Student's t-test. The differences were considered statistically significant at P < 0.05. All experiments were repeated for at least three times.
RESULTS AND DISCUSSION
Stable endothelial-cell monolayer
All blood-contacting surfaces in the body are lined by a single layer of endothelial cells, which play a critical role in maintaining normal function of blood vessels and other cardiovascular tissues.46 Endothelial cells reside on a basement membrane comprised of a mixture of ECM proteins. Endothelial cells adhere to the basement membrane via integrins that physically link the ECM, the cell surface, and the intracellular cytoskeleton.47
In order to represent the major components of blood vessels, i.e., vessel cavity and endothelium, a monolayer of HUVEC cells was formed inside the suspension-flow channel under various conditions. The formation of a fully confluent monolayer of endothelial cells, which is critical for properly mimicking a blood vessel microenvironment, depends on several factors: underlying substrate, coating conditions, incubation time, and cell concentration. Images of the resulting cell network on the channel surface following several protocols are summarized in Supplementary Figure S2.41 An optimal assay to obtain a confluent endothelial monolayer in a PDMS microchannel on a glass substrate was developed using a cell-suspension concentration of 3 × 10⁶cell/ml loaded into a channel, which was coated with 3 mg/ml Matrigel and incubated over 90 s. Following overnight incubation, the endothelial cells were fixed and stained for VE-cadherin (green) and nuclei (Hoechst-blue). The fluorescent image of the endothelial monolayer shown in Figure 2a exhibits well-defined junctions with no apparent gaps among the endothelial cells demonstrating the formation of fully confluent monolayer. Moreover, the cell seeding concentration was also sufficient to form endothelium on gel boundaries between the suspension-flow channel and the chemokine-injection channels as demonstrated in Figure 2b.
Figure 2.

Fluorescent images of the endothelial monolayer structure at the: (a) channel bottom surface, and (b) interface sidewall between the suspension-flow and chemokine injection channels.
Once the confluent endothelial monolayer was generated within the suspension-flow channel, its stability was examined under different flow conditions. The monolayer integrity was tested by evaluating the fraction of HUVECs detached from the glass surface as a function of the applied flow rate, following 12 h incubation time in an incubator. The results for three coating condtions are summarized in Figure 3. With no coating, up to 80% of attached cells were removed under a flow rate of 6 ml/h; about 20% were removed with 1.5 mg/ml Matrigel coating and less than 8% were removed with 3 mg/ml Matrigel coated surface under the same flow rate. Hence, the Matrigel coating not only improves the confluency of the endothelial monolayer formed on a glass substrate but also increases significantly the adhesion of the endothelial cells to the substrate. The need to maintain the endothelial-monolayer integrity through the operation of the microfluidic systems imposes an upper limit on the applied flow rate, QeH; applying a higher flow rate, Q > QeH, would result in removal of a significant number of endothelial cells and, thus, compromising the integrity of the endothelial monolayer. For the present microsystem, with 3 mg/ml Matrigel coating over 90 s incubation time, this upper limit flow rate is estimated to be about QeH = 6 ml/h.
Figure 3.

The fraction of endothelial cells removed from the surface as a function of applied flow rate for different surface treatment conditions.
Steady local chemokine gradients
Many types of cells possess the ability to sense certain chemicals (chemokines) and move, or taxis, along the direction of chemical concentration gradient. Chemotaxis studies require a microenvironment with controlled chemokine gradients since cells need to be able to sense a change in chemokine concentration to direct their motion.48 Several methods have been developed to create gradients of chemotactic reagents in microfluidic systems. However, it remains a challenge to create and sustain a locally stable concentration gradient within a microchannel flow field allowing for a more controlled experimental environment.49
A steady-state concentration gradient in a flow environment is a balance between two transport mechanisms: convection by the fluid flow and diffusion due to concentration gradient as expressed by the following simplified convection-diffusion or scalar-transport equation:
| (1) |
Equation 1 is valid for steady-state incompressible flow with a constant diffusion coefficient; where D is the diffusion coefficient of the chemokine within the working fluid, and C is the spatial chemokine concentration distribution. The velocity vector V, for steady incompressible flow with constant viscosity, is governed by the simplified Navier-Stokes equations given by
| (2) |
where p is the hydrodynamic pressure field, and μ is the working fluid viscosity. Assuming laminar 2-D channel flow, the wall shear stress can then be approximated as: τw = 6Qμ/WH2, where Q is the volume flow rate with W and H being the channel width and height, respectively.
Locally steady chemokine gradients can be obtained only within a limited volume flow rate range as characterized by the Péclet number: Pe = HU/D = Q/DW; where the characteristic length and velocity scales are the channel height and the average velocity, U = Q/HW, respectively. If the flow rate is lower than a certain limit, QcL (Pe < 1), diffusion becomes dominant and the chemokine molecules flood the entire suspension-flow channel with diminishing gradients as shown in Figure 4a. On the other hand, if the flow rate is higher than an upper limit, QcH (Pe > 1), convection becomes dominant and the chemokine molecules are flushed entirely out of the flow domain as shown in Figure 4b.
Figure 4.
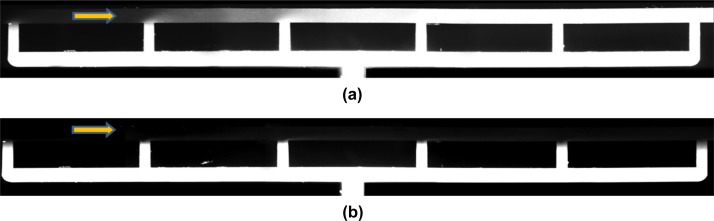
Images of the fluorescein concentration distribution along the flow-suspension channel around the 6 chemokine-injection channels under: (a) low, Q = 0.5 μl/h, and (b) high flow rate, Q = 30 μl/h, with an initial dye concentration of C0 = 40 μM.
It is rather difficult to obtain an analytical solution for Eqs. 1, 2 in search of the upper and lower flow-rate limits. Furthermore, the flow-rate limits depend on the initial chemokine concentration in the gel-protein mixture loaded into the device via the chemokine inlet. Numerical simulations, on the other hand, can readily be utilized for establishing the flow-rate range, QcL < Q < QcH (Pe ∼ 1), which allows the generation of locally steady chemokine gradients. Numerical simulations on this 3D convection-diffusion flow were performed using finite-element method to explore the feasibility of realizing locally stable chemokine gradients under steady flow in the suspension-flow channel, and the results are summarized in Figure 5. Normalized chemokine-concentration distributions, C/C0, were computed for flow rates in the range of 1–50 μl/h, corresponding to Pe = 1-50 and τw=(1.3-66.5) × 10−4 Pa for Fluorescein with D = 0.17 × 10⁻⁹ m2/s. The spanwise and streamwise concentration profiles around chemokine-injection channel #4, at the channel mid-height, are respectively depicted in Figures 5a, 5b. The flow rate affects both the local chemokine concentration and its spatial gradient, which is the chemotaxis driving force. While the local chemokine concentration decreases monotonically with increasing flow rate everywhere, the effect on concentration gradients is more complex. The magnitude of the local concentration-gradient vector is given by
| (3) |
Figure 5.

Numerical simulations depicting the flow rate effects on both chemokine concentration and concentration gradient for C0 = 40 μM: (a) spanwise, and (b) streamwise concentration profiles; (c) spanwise, and (d) streamwise concentration-gradient profiles around chemokine-injection channel #4 under various flow rates; (e) normalized concentration gradient as a function of the applied flow rate at spanwise distances 60 μm (solid lines) and 100 μm (dashed lines) away from chemokine-injection channels #1, #4, and #6; (f) normalized concentration gradients for D = 0.54 × 10⁻⁹ m2/s (red curves for fluorescein) and D = 0.17 × 10⁻⁹ m2/s (blue curves for CXCL12) as a function of the applied flow rate at spanwise distances 60 μm (solid lines) and 100 μm (dashed lines) away from chemokine-injection channel #4.
Calculated spanwise and streamwise concentration-gradient profiles around the chemokine-injection channel #4 are shown in Figures 5c, 5d, respectively, for various flow rates. The concentration gradients vanish in all directions within a distance of 100–200 μm from the intersection between the chemokine-injection and the suspension flow channel. These results indicate that, given a typical CTC diameter of 20 μm in a 500 μm-wide channel, it is feasible to generate strong concentration gradients at highly localized pockets along the suspension-flow channel. Furthermore, the pockets are large enough to allow response of CTCs expressing complimentary receptors. In order to estimate the upper and lower flow-rate limits, the local chemokine gradients that could potentially be detected by the passing CTCs should be explored. Most CTCs are not expected to move along the boundary between the suspension-flow and chemokine-injection channels. On the other hand, some CTCs moving a short distance, about 3–5 cell diameters, away from the chemokine source could detect and respond to the local gradients. Therefore, the normalized chemokine gradient |∇C|/C0 is plotted in Figure 5e as a function of the applied flow rate at spanwise distances 60 and 100 μm away from chemokine-injection channels #1, #4, and #6. The concentration gradient increases from zero, for no flow condition, to a maximum level around 5 μl/h; then, it gradually diminishes with increasing flow rate. The concentration gradient at 60 μm seems to be still appreciable for 50 μl/h flow rate; however, the actual concentration level shown in Figures 5a, 5b is rather negligible. Therefore, accounting for both criteria, the numerical simulations for C0 = 40 μM suggest a low flow rate limit of QcL ≅ 1 μl/h (Pe ≅ 1, τw = 1.3 × 10⁻⁴ Pa) and an upper limit of QcH ≅ 10 μl/h (Pe ≅ 10, τw = 13.3 × 10⁻⁴ Pa).
The detailed chemokine gradient investigation has been conducted for the much cheaper Fluorescein (0.33 kDa) with a diffusion coefficient of about 0.54 × 10⁻⁹ m2/s. However, for the CTC extravasation studies discussed in Sec. 3D, the expensive CXCL12 chemokine (8.7 kDa) is used with a lower diffusion coefficient of about 0.17 × 10⁻⁹ m2/s. To explore the effect of the diffusion coefficient on the resulting chemokine concentration distribution, the normalized chemokine gradient |∇C|/C0 has been numerically calculated for both the low and high diffusion coefficients corresponding to CXCL12 and Fluorescein. The results are plotted in Figure 5f as a function of the flow rate at the same distances of 60 and 100 μm away from chemokine-injection channel #3 only. In general, the flow rate operational limits decrease with increasing chemokine diffusivity. However, within the chemokine-diffusivity range expected in the experiments for Fluorescein and CXCL12, the differences are minor as demonstrated in Supplementary Figure S3(b) (Ref. 41) and would require little adjustment in the applied flow rate.
The simulation results were validated by flowing PBS through the suspension-flow channel, after filling up the chemokine-injection channels with a mixture of gel and fluorescein dye at an initial concentration of C0 = 40 μM at 4 °C. The cold mixture was pumped into the device and stopped when an interface was formed along the suspension-flow channel next to the six chemokine-injection channels. The fluorescein-gel mixture, in the network connecting the chemokine inlet to the suspension-flow channel, served as a source for diffusion of dye. A steady PBS flow rate of Q = 5 μl/h along the suspension flow channel was then applied using a programmable syringe pump. Time-lapse images of the light intensity level, proportional to the fluorescein concentration were recorded under a fluorescent microscope to confirm the establishment of a steady state. The recorded steady image is shown in Figure 6a, and a simulated image numerically obtained under the same conditions is shown in Figure 6b. For quantitative analysis, dye concentration variations along any desired direction can be extracted from the recorded digital fluorescent images. Spanwise and streamwise profiles of the fluorescein concentration, in the vicinity of all six chemokine-injection channels, are respectively comapred in Figures 6c, 6d with numerically simulated concentration profiles. The good qualitative and quantitative agreement between the computed and measured results validates the simulations.
Figure 6.

Fluorescein-dye concentration distribution in the suspension-flow channel under Q = 5 μl/h and C0 = 40 μM; (a) a recorded fluorescent image, and (b) a numerically simulated planar concentration distribution with local gradients, the background color represents relative local concentration increasing with the color changing from blue to red while the solid black curves are isocontours of constant concentration gradients; (c) spanwise, and (d) streamwise (10 μm away from the sidewall) measured and simulated concentration profiles (symbols-measurements, solid lines-simulations).
The flow rate effect on locally stable chemokine gradients formed along the suspension-flow channel was then investigated experimentally after the establishment of a confluent endothelial monolayer. The effect of the endothelial monolayer on the fluorescein diffusion is negligible as demonstrated in Supplementary Figure S3(a).41 Fluorescein-dye concentration distributions were recorded under various flow rates in the range of 1–10 μl/h for three initial dye concentrations: 0.4, 4, and 40 μM. Fluorescent images of steady dyes distributions recorded under flow rates of Q = 1, 3, 5, and 10 μl/h are shown in Figure 7; the images were taken around a representative injection channel (#4) for C0 = 40 μM. Visually, it is evident that the dye penetrates a large area of the suspension-flow channel under the low flow rate of 1 μl/h, while under the high flow rate of 10 μl/h, the dye is confined to a small patch near the injection-channel connection.
Figure 7.
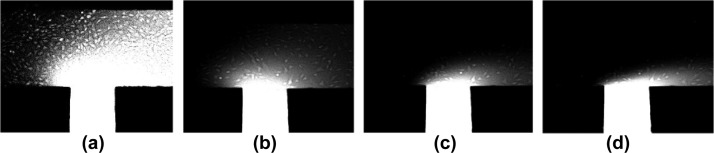
Images of steady fluorescein-dye concentration distribution around injection channel #4 for an initial concentration of C0 = 40 μM under a flow rate of: (a) Q = 1 μl/h, (b) 3 μl/h, (c) 5 μl/h, and (d) 10 μl/h.
Spanwise and streamwise profiles of the fluorescein-dye concentration, in the vicinity of chemokine-injection channel #4, are respectively shown in Figures 8a, 8b for initial dye concentrations of (i) C0 = 40, (ii) C0 = 4, and (iii) C0 = 0.4 μM under flow rates varying in the range of 1–10 μl/hr (Pe = 1-10). The dye concentration level, both in its spanwise and streawise direction, decrease with increasing flow rate for the three initial dye concentrations tested. Stable and locally strong concentration gradients were obtained under flow rates of up to 10 μl/hr for the initially high dye concentration of C0 = 40 μM; while, for the low concentration of C0 = 0.4 μM, significant local gradients could not be obtained even under a flow rate of 1 μl/h. For the intermediate initial dye concentration of C0 = 4 μM, stable gradients were obtained only under the low flow rate range of 1–3 μl/h (Pe = 1-3); however, under the higher flow rate in the range of 5–10 μl/h (Pe = 5-10), the gradients were small and close to the basal level.
Figure 8.

Measured fluorescein-dye concentration profiles along: (a) spanwise, and (b) streamwise directions for three initial dye concentrations: (i) C0 = 40, (ii) C0 = 4, and (iii) C0 = 0.4 μM under flow rates of: 1, 3, 5, and 10 μl/h.
Steady CTC-suspension flow
The response of CTCs to chemokine gradients can be studied by driving a CTC suspension through the suspension-flow channel once a stable endothelial monolayer and steady chemokine gradients were established. However, under low flow rate, sedimentation of CTCs to the channel bottom surface results in binding between the CTCs and the endothelial monolayer at the channel entrance. Subsequently, the CTCs cannot be driven through the microchannel in analogy to the blood stream. The CTC-suspension flow rate therefore has to exceed a certain lower limit, QeL, to overcome the adhesion of CTCs to the immobilized HUVECs. Based on the current experiments, the lower flow rate limit is estimated to be about QeL = 50 μl/h (Pe = 50, τw = 6.7 × 10⁻³ Pa).
Two sets of flow-rate limits have been identified to enable a continuous operation of the microfluidic system under a steady flow of the CTC suspension through a microchannel with steady chemokine gradients and a stable endothelial monolayer. While steady chemokine gradients require the flow rate to be in the range of QcL < Q < QcH, a steady CTC-suspension flow over a stable endothelial monolayer requires the flow rate to be in the range of QeL < Q < QeH. If there was an overlap between the two flow-rate ranges, an operation meeting all criteria would require a flow rate in the range of max(QcL, QeL) < Q < min(QcH, QeH). However, in the present microsystem, there is no overlap as QeL > QcH; namely, the minimum flow rate needed to drive CTCs through the suspension-flow channel is appreciably higher than the maximum flow rate under which stable chemokine gradients can be maintained. To overcome the lack of overlap between the two admissible flow-rate ranges, CTCs can be driven into the suspension-flow channel under a flow rate Q > QeL following the formation of both the endothelial layer and chemokine gradients. The flow rate can then be lowered to a constant level in the range of QcL < Q < QcH to allow the re-formation of the chemokine gradients that vanished while driving CTCs under flow rate Q > QeL > QcH.
Specific tumor cell chemotaxis
CTC extravasation studies in microsystems require a steady flow of CTCs over a stable endothelial monolayer in the vicinity of local chemokine gradients. Following the establishment of a stable HUVEC endothelial monolayer and local CXCL12 chemokine gradients, with initial concentration C0 = 4 μM, a suspension of fluorescently labeled MDA-MB-231 cells was driven under a 50 μl/h flow rate. Once the MDA-MB-231 cells spanned the entire suspension-flow channel, the flow rate was lowered down to 1 μl/h (Pe = 3, τw = 1.3 × 10⁻⁴ Pa) and the corresponding CXCL12 concentration distribution is shown in Supplementary Figure S3(b).41 Under these conditions, the CXCL12 chemokine concentration gradient in the suspension-flow channel is about 35 ng/ml per 1 mm within a radius of about 100 μm from the chemokine injection channel. This is well within the range of 10–100 ng/ml per 1 mm reported for cell migration due to chemotaxis in a microfabricated device.50 Time-lapse video recording of the cells behavior was carried out, and bright-field images spanning a period of 30 hrs are shown in Figure 9a. Several cells were observed to undergo division suggesting that the cells maintain their normal life cycle and could respond to external stimuli. Indeed, CTCs sensing chemokine signaling transmigrated from the suspension-flow channel—across the endothelial monolayer—into the chemokine-injection channels in the direction of positive chemokine gradients, perpendicular to the applied flow direction. The fluorescent images shown in Figure 9b confirm that the cells migrating into the chemokine-injection channels are the MDA-MB-231 cells labeled with cell tracker. Figure 10 (Multimedia view) illustrates the events of MDA-MB-231 cell division and transmigration from the suspension-flow channel along CXCL12 concentration gradients, through the endothelium, into a chemokine-injection channel.
Figure 9.

Optical (a) and fluorescent images (b) tracking the instantaneous cell location in the vicinity of the intersection between the suspension-flow channel and chemokine-injection channel #4 after: (i) 3, (ii) 12, and (iii) 30 h incubation time under a constant flow rate of 1 μl/h (Pe = 3, τw = 1.3 × 10⁻⁴ Pa). Blue arrows show endothelial cells; red arrows trace the migration of MDA-MB-231 cells; and yellow dashed-lines mark the endothelium layer formed between the suspension-flow channel and chemokine-injection channel. The red arrows mark MDA-MB-231 extravasating from thesuspension-flow channel deep into the chemokine-injection channel through the endothelial monolayer barrier.
Figure 10.
CTCs extravasation across endothelium due to the CXCL12 chemokine gradient under a flow rate of 1 μl/h (Pe = 3, τw = 1.3 × 10⁻⁴ Pa). The green arrows track MDA-MB-231 cell extravasating from the suspension-flow channel into the chemokine-injection channel through the endothelial monolayer barrier (Multimedia view).
Since the observed extravasation of MDA-MB-231 cells might be due to random migration rather than chemotaxis, several control experiments were conducted: (i) driving MDA-MB-231 cells, with high-level expression of CXCR4 receptors, through the suspension-flow channel with no CXCL12 chemokine; (ii) driving MCF-7 cells, with low-level expression of CXCR4 receptors, through the suspension-flow channel with well-established CXCL12 gradients; and (iii) driving MCF-7 cells through the suspension-flow channel with no CXCL12 chemokine. Recorded images for both control experiments are shown in Supplementary Figures S4 and S5.41 The number of cells migrating from the suspension-flow into the chemokine-injection channels was counted after 30 h incubation time, and the results are summarized in Figure 11. About one MDA-MB-231 or MCF-7 cell per chemokine-injection channel was observed in the absence of CXCL12 chemokine, Figure 11a, suggesting that this migration is random in nature. Indeed, in the presence of CXCL12, the number of extravasating MDA-MB-231 cells per chemokine-injection channel increased significantly to more than 6 while the number of extravasating MCF-7 cells increased moderately to slightly more than one; this is consistent with the expression level of the CXCR4 receptors. The comparison among different chemokine-injection channels is shown in Figure 11b. In general, more cells extravasate into chemokine-injection channels that are placed further downstream. This could be due to the streamwise transport of chemokine molecules resulting in increasing chemokine concentration and concentration gradient with downstream distance shown in Figure 6d. Finally, the average distance travelled by the migrating cells inside the chemokine-injected channels is shown in Figure 11c. Over the observed 30 h incubation time, the average cell migration speed was maintained fairly steady at about 15 μm/h.
Figure 11.

Statistics of MDA-MB-231 and MCF-7 cell migration from the suspension-flow to the chemokine-injection channels: (a) with and without CXCL12 chemokine; (b) a comparison among chemokine-injection channels #2, #4, and #6; and (c) the average distance travelled by migrating cells over a duration of 30 h incubation time. Statistical analysis, n = 3 (NS, not significant; *, P < 0.05).
CONCLUSIONS
In this work, a microfluidic system has been developed to enable in vitro studies of organ-specific extravasation of CTCs by recapitulating the two major in vivo microenvironmental components: local signaling chemokine gradients, and a vessel with an endothelial monolayer. In particular, the effects of important factors such as CTC-suspension flow rate, initial chemokine concentration, and endothelial monolayer surface treatment, on the formation of a proper microenvironment have been systematically characterized experimentally and numerically. Local chemokine gradients in a fluid flow are the result of a balance between diffusion and convection; they can be sustained within a limited flow rate range depending on the initial chemokine concentration. Utilizing numerical simulations, validated by experimental measurements, the lower and upper flow-rate limits have been determined; applying a flow rate outside of this range results in insufficient chemokine gradients. An endothelial monolayer is a critical element in mimicking the vascular microenvironment. Matrigel coating has been found to play a key role not only in the formation of a confluent endothelial monolayer, but also in significantly enhancing the adhesion between the endothelial cells and the underlying substrate. The need to drive a CTC suspension through the microsystem has introduced further flow rate restrictions to ensure overcoming the adhesion of CTCs to the immobilized endothelial cells while keeping the integrity of the confluent endothelial monolayer. Finally, utilizing the characterized microfluidic system, extravasation of CXCR4-expressing MDA-MB-231 cancer cells along positive concentration gradients of the complimentary CXCL12 chemokine has been recorded. Control experiments have further substantiated the postulate that the observed extravasation was due to specific chemotaxis and not due to random migration. This system, therefore, is a powerful tool not only for exploring specific receptor-ligand combinations driving cancer metastasis, but can also be used for screening of drugs developed for metastasis suppression.
ACKNOWLEDGMENTS
This work was partially supported by NIH Director's New Innovator Award (1DP2OD007161-01).
References
- Hanahan D. and Weinberg R. A., Cell 144(5 ), 646–674 (2011). 10.1016/j.cell.2011.02.013 [DOI] [PubMed] [Google Scholar]
- Hanahan D. and Weinberg R. A., Cell 100(1 ), 57–70 (2000). 10.1016/S0092-8674(00)81683-9 [DOI] [PubMed] [Google Scholar]
- Sporn M. B., Ann. New York Acad. Sci. 833, 137–146 (1997). 10.1111/j.1749-6632.1997.tb48599.x [DOI] [PubMed] [Google Scholar]
- Gupta G. P. and Massague J., Cell 127(4 ), 679–695 (2006). 10.1016/j.cell.2006.11.001 [DOI] [PubMed] [Google Scholar]
- Miles F. L., Pruitt F. L., van Golen K. L., and Cooper C. R., Clin. Exp. Metastasis 25(4 ), 305–324 (2008). 10.1007/s10585-007-9098-2 [DOI] [PubMed] [Google Scholar]
- Bidard F. C., Mathiot C., Degeorges A., Etienne-Grimaldi M. C., Delva R., Pivot X., Veyret C., Bergougnoux L., de Cremoux P., Milano G., and Pierga J. Y., Ann. Oncol. 21(9 ), 1765–1771 (2010). 10.1093/annonc/mdq052 [DOI] [PubMed] [Google Scholar]
- Graves H. and Czerniecki B. J., Pathol. Res. Int. 2011, 621090. 10.4061/2011/621090 [DOI] [PMC free article] [PubMed] [Google Scholar]
- Kim M. Y., Oskarsson T., Acharyya S., Nguyen D. X., Zhang X. H., Norton L., and Massague J., Cell 139(7 ), 1315–1326 (2009). 10.1016/j.cell.2009.11.025 [DOI] [PMC free article] [PubMed] [Google Scholar]
- Meng S., Tripathy D., Frenkel E. P., Shete S., Naftalis E. Z., Huth J. F., Beitsch P. D., Leitch M., Hoover S., Euhus D., Haley B., Morrison L., Fleming T. P., Herlyn D., Terstappen L. W., Fehm T., Tucker T. F., Lane N., Wang J., and Uhr J. W., Clin. Cancer Res. 10(24 ), 8152–8162 (2004). 10.1158/1078-0432.CCR-04-1110 [DOI] [PubMed] [Google Scholar]
- Miller M. C., Doyle G. V., and Terstappen L. W., J. Oncol. 2010, 617421. 10.1155/2010/617421 [DOI] [PMC free article] [PubMed] [Google Scholar]
- Chambers A. F., Groom A. C., and MacDonald I. C., Nat. Rev. Cancer 2(8 ), 563–572 (2002). 10.1038/nrc865 [DOI] [PubMed] [Google Scholar]
- Joyce J. A. and Pollard J. W., Nat. Rev. Cancer 9(4 ), 239–252 (2009). 10.1038/nrc2618 [DOI] [PMC free article] [PubMed] [Google Scholar]
- Egeblad M., Nakasone E. S., and Werb Z., Dev. Cell 18(6 ), 884–901 (2010). 10.1016/j.devcel.2010.05.012 [DOI] [PMC free article] [PubMed] [Google Scholar]
- Riahi R., Long M., Yang Y., Dean Z., Zhang D. D., Slepian M. J., and Wong P. K., Integrative Biology: Quantitative Biosciences from Nano to Macro (2013).
- Roussos E. T., Condeelis J. S., and Patsialou A., Nat. Rev. Cancer 11(8 ), 573–587 (2011). 10.1038/nrc3078 [DOI] [PMC free article] [PubMed] [Google Scholar]
- Thiery J. P., Nat. Rev. Cancer 2(6 ), 442–454 (2002). 10.1038/nrc822 [DOI] [PubMed] [Google Scholar]
- Paget S., Cancer Metastasis Rev. 8(2 ), 98–101 (1989). [PubMed] [Google Scholar]
- Fidler I. J., Nat. Rev. Cancer 3(6 ), 453–458 (2003). 10.1038/nrc1098 [DOI] [PubMed] [Google Scholar]
- Fokas E., Engenhart-Cabillic R., Daniilidis K., Rose F., and An H. X., Cancer Metastasis Rev. 26(3–4 ), 705–715 (2007). 10.1007/s10555-007-9088-5 [DOI] [PubMed] [Google Scholar]
- Langley R. R. and Fidler I. J., Int. J. Cancer 128(11 ), 2527–2535 (2011). 10.1002/ijc.26031 [DOI] [PMC free article] [PubMed] [Google Scholar]
- Ben-Baruch A., Cell Adhesion Migrat. 3(4 ), 328–333 (2009). 10.4161/cam.3.4.9211 [DOI] [PMC free article] [PubMed] [Google Scholar]
- Olkhanud P. B., Baatar D., Bodogai M., Hakim F., Gress R., Anderson R. L., Deng J., Xu M., Briest S., and Biragyn A., Cancer Res. 69(14 ), 5996–6004 (2009). 10.1158/0008-5472.CAN-08-4619 [DOI] [PMC free article] [PubMed] [Google Scholar]
- Teicher B. A. and Fricker S. P., Clin. Cancer Res. 16(11 ), 2927–2931 (2010). 10.1158/1078-0432.CCR-09-2329 [DOI] [PubMed] [Google Scholar]
- Strell C. and Entschladen F., Cell Commun. Signal.: CCS 6, 10 (2008). 10.1186/1478-811X-6-10 [DOI] [PMC free article] [PubMed] [Google Scholar]
- Muller A., Homey B., Soto H., Ge N. F., Catron D., Buchanan M. E., McClanahan T., Murphy E., Yuan W., Wagner S. N., Barrera J. L., Mohar A., Verastegui E., and Zlotnik A., Nature 410(6824 ), 50–56 (2001). 10.1038/35065016 [DOI] [PubMed] [Google Scholar]
- Wirtz D., Konstantopoulos K., and Searson P. C., Nat. Rev. Cancer 11(7 ), 512–522 (2011). 10.1038/nrc3080 [DOI] [PMC free article] [PubMed] [Google Scholar]
- Schluter K., Gassmann P., Enns A., Korb T., Hemping-Bovenkerk A., Holzen J., and Haier J., Am. J. Pathol. 169(3 ), 1064–1073 (2006). 10.2353/ajpath.2006.050566 [DOI] [PMC free article] [PubMed] [Google Scholar]
- Naumov G. N., Wilson S. M., MacDonald I. C., Schmidt E. E., Morris V. L., Groom A. C., Hoffman R. M., and Chambers A. F., J. Cell Sci. 112(Pt 12 ), 1835–1842 (1999). [DOI] [PubMed] [Google Scholar]
- Gassmann P., Hemping-Bovenkerk A., Mees S. T., and Haier J., Int. J. Colorectal Dis. 24(7 ), 851–858 (2009). 10.1007/s00384-009-0694-2 [DOI] [PubMed] [Google Scholar]
- Mareel M. and Leroy A., Physiol. Rev. 83(2 ), 337–376 (2003). 10.1152/physrev.00024.2002 [DOI] [PubMed] [Google Scholar]
- Psaila B. and Lyden D., Nat. Rev. Cancer 9(4 ), 285–293 (2009). 10.1038/nrc2621 [DOI] [PMC free article] [PubMed] [Google Scholar]
- Vargo-Gogola T. and Rosen J. M., Nat. Rev. Cancer 7(9 ), 659–672 (2007). 10.1038/nrc2193 [DOI] [PubMed] [Google Scholar]
- Chen H. C., in Cell Migration: Developmental Methods and Protocols, Methods in Molecular Biology Vol. 294, edited by Guan J.-L. (Humana Press Inc., Totowa, NJ, 2005), pp. 15–22. [Google Scholar]
- Song J. W., Cavnar S. P., Walker A. C., Luker K. E., Gupta M., Tung Y. C., Luker G. D., and Takayama S., PLoS One 4(6 ), e5756 (2009). 10.1371/journal.pone.0005756 [DOI] [PMC free article] [PubMed] [Google Scholar]
- Shin M. K., Kim S. K., and Jung H., Lab Chip 11(22 ), 3880–3887 (2011). 10.1039/c1lc20671k [DOI] [PubMed] [Google Scholar]
- Polacheck W. J., Charest J. L., and Kamm R. D., Proc. Natl. Acad. Sci. U.S.A. 108(27 ), 11115–11120 (2011). 10.1073/pnas.1103581108 [DOI] [PMC free article] [PubMed] [Google Scholar]
- Zervantonakis I. K., Hughes-Alford S. K., Charest J. L., Condeelis J. S., Gertler F. B., and Kamm R. D., Proc. Natl. Acad. Sci. U.S.A. 109(34 ), 13515–13520 (2012). 10.1073/pnas.1210182109 [DOI] [PMC free article] [PubMed] [Google Scholar]
- Zhang Q., Liu T. J., and Qin J. H., Lab Chip 12(16 ), 2837–2842 (2012). 10.1039/c2lc00030j [DOI] [PubMed] [Google Scholar]
- Jeon J. S., Zervantonakis I. K., Chung S., Kamm R. D., and Charest J. L., PLoS One 8(2 ), e56910 (2013). 10.1371/journal.pone.0056910 [DOI] [PMC free article] [PubMed] [Google Scholar]
- Huipeng Ma H. X. and Qin J., AIP Biomicrofluid. 7(1 ), 011501–011513 (2013). 10.1063/1.4774070 [DOI] [Google Scholar]
- See supplementary material at http://dx.doi.org/10.1063/1.4868301 for the microfluidic device layout, endothelial monolayer, chemokine concentration distributions, and control experiments.
- Keenan T. M. and Folch A., Lab Chip 8(1 ), 34–57 (2008). 10.1039/b711887b [DOI] [PMC free article] [PubMed] [Google Scholar]
- Matteucci E., Ridolfi E., Maroni P., Bendinelli P., and Desiderio M. A., Mol. Cancer Res. 5(8 ), 833–845 (2007). 10.1158/1541-7786.MCR-07-0054 [DOI] [PubMed] [Google Scholar]
- Young E. W. K. and Simmons C. A., Lab Chip 10(2 ), 143–160 (2010). 10.1039/b913390a [DOI] [PubMed] [Google Scholar]
- Shin Y., Han S., Jeon J. S., Yamamoto K., Zervantonakis I. K., Sudo R., Kamm R. D., and Chung S., Nat. Protocols 7(7 ), 1247–1259 (2012). 10.1038/nprot.2012.051 [DOI] [PMC free article] [PubMed] [Google Scholar]
- Ross R., Nature 362(6423 ), 801–809 (1993). 10.1038/362801a0 [DOI] [PubMed] [Google Scholar]
- Young E. W. K., Wheeler A. R., and Simmons C. A., Lab Chip 7(12 ), 1759–1766 (2007). 10.1039/b712486d [DOI] [PubMed] [Google Scholar]
- Walker G. M., Sai J. Q., Richmond A., Stremler M., Chung C. Y., and Wikswo J. P., Lab Chip 5(6 ), 611–618 (2005). 10.1039/b417245k [DOI] [PMC free article] [PubMed] [Google Scholar]
- Choi E., Jun I., Chang H. K., Park K. M., Shin H., Park K. D., and Park J., Lab Chip 12(2 ), 302–308 (2012). 10.1039/c1lc20777f [DOI] [PubMed] [Google Scholar]
- Jeon N. L., Baskaran H., Dertinger S. K. W., Whitesides G. M., Van de Water L., and Toner M., Nat. Biotechnol. 20(8 ), 826–830 (2002). 10.1038/nbt712 [DOI] [PubMed] [Google Scholar]