Abstract
Aims: Single center 10-years audit on the relation between labour ward management and caesarean section rate, with special emphasis on the impact of reduced induction rate and the use of strict criteria for the diagnosis of onset of spontaneous labour and the indication for induction of labour.
Methods: Retrospective classification of all deliveries between 1st January 2001 and 31st December 2010 in Ziekenhuis Oost Limburg, Genk Belgium, into the 10- group classification according to Robson. Numbers and rate of caesarean sections were defined for primiparous and multiparous women in spontaneous labour (groups 1 and 3 respectively), after induced labour (groups 2 and 4 respectively), with caesarean scar uterus (group 5) or with other gestational complications (groups 6 to 10). For these groups, a 10-years evolution was evaluated.
Results: In a total of 19.675 deliveries, the overall caesarean section rate increased from 20% (380/1937) in 2001 to 25% (534/2121) in 2007 (p < 0.001), and decreased again to 20% in 2010 (415/2068) (p < 0.001). The increase of caesarean sections before 2007 was associated with an increase of inductions in singleton cephalic pregnancies at term from 28.5% (410/1437) in 2003 to 35.9% (551/1536) in 2006 (p < 0.001). The decrease of caesarean sections after 2007 occurred both in induced labours, as a direct consequence of rationalised reduction of induction rate, and in spontaneous labours, following introduction of strict criteria for diagnosis of labour. Despite a similar caesarean section rate of 20% in 2001 and 2010, the 6.6% (136/2068) repeat caesarean section rate in 2010 was higher than 4.2% (81/1937) in 2001 (p = 0.001).
Conclusion: This single centre audit illustrates that increased induction rate is associated with increased caesarean section rate. This evolution can be reverted through a rationalised management aiming for reduction of induced labours and improved diagnosis of labour.
Keywords: Caesarean section rate, induction of labour, obstetric management, obstetrics
Introduction/Aim
During the last decades, an increase of caesarean section rate is observed in most industrialised countries (Sword et al., 2009). In the United States of America, a strong increase of caesarean sections during the seventies and eighties was followed by a stabilisation around 20% during the nineties, however since the start of the new century again a strong increase uptil 30% is observed (Varner, 2007). Similar trends are reported for European and other countries (Fauendes & Cecatti, 1993; Francome & Savage, 1993; Künzel, 1994; Schuler Barazzoni & Roth-Kleiner, 2008). An explanation for this trend is considered multifactorial, with contribution from (1) medical factors, such as increase of high risk pregnancies (Blondel & Kaminsky, 2002) and preterm deliveries (Noguchi, 2008), (2) psychosocial factors, such as section on demand (Dursun et al., 2011) or low threshold to opt for operative delivery (Scarella et al., 2011) and (3) organisation of prenatal care, being either private or community-based health care (Rooks, 1999; Shorten & Shorten, 2007; Simpson et al., 1997).
In Flanders, Belgium, increasing trends for caesarean sections have also been reported (Defoort & Martens, 2000). Higher caesarean section rates were observed in the eastern parts of the country compared to the west (Aelvoet et al., 2008). From this, an internal audit was performed in 2008 in a large maternity clinic in the eastern part of Flanders, Ziekenhuis Oost Limburg in Genk, in order to identify some obstetric indicators responsible for this increasing trend (Nguyen et al., 2010). Two important obstetric indicators were identified: (1) increasing trend of induced labour, and (2) non-stringent diagnosis of spontaneous labour. In 2008, labour ward management was changed to tackle both problems: inductions for non-medical indication were reduced and the first obstetric intervention in spontaneous labour was postponed until after full effacement of the cervix.
In this paper, we report the impact of these interventions on caesarean section rates, 2 years after clinical implementation, as part of a 10-year departmental audit of labour ward management.
Methods
Materials
The birth register of Ziekenhuis Oost Limburg, Genk Belgium, was searched for collection of all perinatal data between 1st January 2001 and 31st December 2010. Every delivery was categorised into one of 10 groups, as defined by the 10-group classification according to Robson (Brennan et al., 2009; Costa et al., 2010; Robson et al., 1996). The definition of the 10 groups is enlisted in Table I. For the purpose of this analysis, we grouped data from groups 1 and 3, groups 2 and 4, and groups 6 to 10, to allow comparison between women with spontaneous labour, with induced labours, with caesarean scar uterus or with other medical or obstetric complications.
Table I. Characteristics for severe PPGP.
| 10 GROUPS CLASSIFICATION |
|---|
| 1. Nulliparous, single cephalic, ≥ 37 weeks, in spontaneous labour |
| 2. Nulliparous, single cephalic, ≥ 37 weeks, induced or CS before labour |
| 3. Multiparous (excluding prev. CS), single cephalic, ≥ 37 weeks, in spontaneous labour |
| 4. Multiparous (excluding prev. CS), single cephalic, ≥ 37 weeks, induced or CS before labour |
| 5. Previous CS, single cephalic, ≥ 37 weeks |
| 6. All nulliparous breeches |
| 7. All multiparous breeches (including prev. CS) |
| 8. All multiple pregnancies (including prev. CS) |
| 9. All abnormal lies (including prev. CS) |
| 10. All single cephalic, ≤ 36 weeks (including prev. CS) |
Methods
For every group, the total number of data was defined, as well as the caesarean section rate per group and the relative contribution to the total number of caesarean sections per year (Robson et al., 1996). For groups 1 and 3, 2 and 4, 5 and 6 to 10, data were plotted graphically to represent the 10-years evolution between 2001 and 2010. All evolutions were assessed relative to the time onset of changed labour ward management in June 2008, with: (1) reduction of labour inductions for non-medical reasons, and (2) postponing the first obstetric intervention in labour until after fully effaced cervix (Boylan et al., 2004).
Statistical comparison between groups was performed using χ²-test. Pearson’s correlation was used to evaluate parallel evolutions in fractional changes.
Results
A total of 19 765 deliveries were included in this 10-year audit. In this population, the mean overall caesarean section rate in this period was 21.8% (n = 4314). The mean overall induction rate was 22.6% (n = 4463) and induction rate in term singleton cephalic pregnancies was 28.9% (3722/12878).
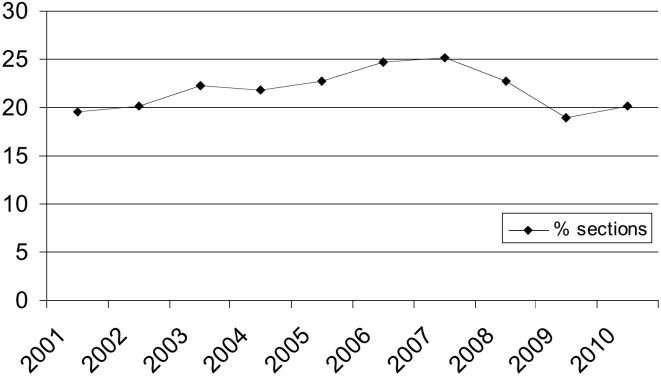
Figure 1 shows the 10-years evolution of the overall caesarean section rate. An increase is observed from 19.6% (380/1937) in 2001 to a maximum of 25.2% (534/2121) in 2007 (p < 0.001), after which there is a decrease again to 20.1% (415/2068) in 2010 (p < 0.001). As such, the overall caesarean section rate is similar at the beginning and the end of the study period.
Fig. 1. Evolution of overall caesarean section rate between 1st January, 2001 and 31st December 2010 in Ziekenhuis Oost Limburg, Genk Belgium.
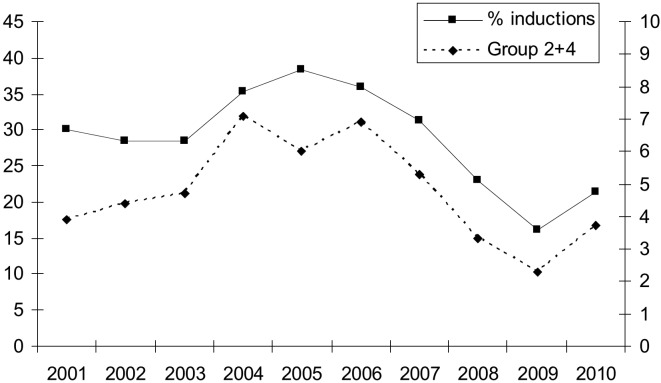
In Figure 2, the contribution of inductions in term singleton cephalic pregnancies (Robson groups 2 + 4) to the overall caesarean section rate is presented. As is shown, this induction rate increases from 28.5% (410/1437) in 2003 to 35.9% (551/1536) in 2006 (p < 0.001), peaking in 2005 at 38.4% (587/1527). After 2007, there is a strong decrease of inductions to 21.4% (337/1576) in 2010 (p < 0.001). This evolution is associated with a parallel trend of caesarean section rate contribution from the induction groups 2 + 4, showing an increase from 4.7% (85/1822) in 2003 to 6.9% (133/1941) in 2006 (p = 0.005), after which there is a strong decrease to 3.7% (78/2068) in 2010 (p < 0.001). The correlation coefficient between fractional changes of inductions and caesarean sections presented in Figure 2 was 0,91.
Fig. 2. Overall induction rate in the total population (left ordinate) and contribution of induction groups 2 + 4 to overall cesarean section rate (right ordinate).
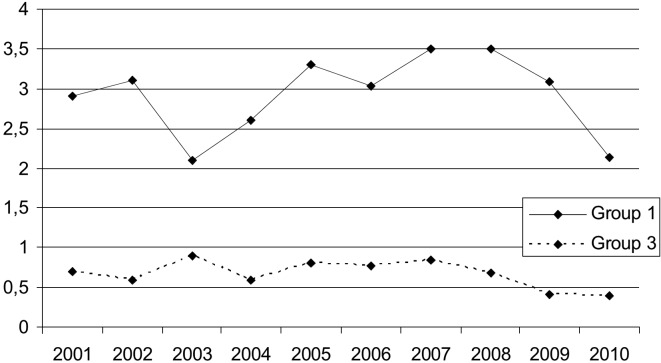
Figure 3 presents the contribution to the overall caesarean section rate of spontaneous labour in term primiparous and multiparous labours (Robson groups 1 + 3). As is shown, there is a fairly steady rate of 3% for group 1 and 0.8% for group 3 between 2001 and 2008, after which non-significant reductions to 2.1% (44/2068) for group 1 and to 0.4% (8/2068) for group 3 are observed in 2010. Figure 4 illustrates this evolution for both groups combined (p < 0.05).
Fig. 3. Contribution to overall cesarean section rate of spontaneous labour groups 1 and 3.
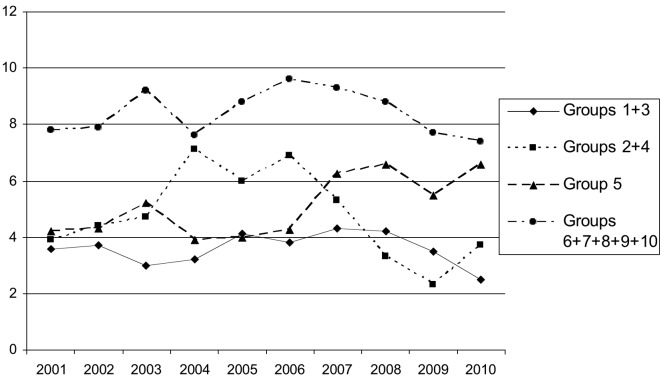
Figure 4 also illustrates the 10-years evolution of all deliveries since 2001, categorised in 4 main groups: spontaneous labours (groups 1 + 3), induced labours (groups 2 + 4), caesarean scar uterus (group 5) and other complications, such as fetal malpostion in breech or transverse or preterm deliveries (groups 6-10). A strong 50% increase is shown of repeat caesarean sections (group 5) from 4.2% (81/1937) in 2001 to 6.6% (136/2068) in 2010 (p = 0.001). Despite a similar overall caesarean section rate in 2001 and 2010, it is clearly shown that the contribution of the 4 main categories is totally different, with significantly more contribution from repeat caesarean sections in 2010 than in 2001 (6.6% (136/2068) versus 4.2% (81/1937)) (p = 0.001).
Fig. 4. 10-years evolution of the contribution to the overall cesarean section rate of all women, delivered in Ziekenhuizen Oost Limburg, Genk Belgium between 2001 and 2010, categorized in 4 main groups: spontaneous labour (Robson groups 1 + 3), induced labours (Robson groups 2 + 4), cesarean scar uterus (Robson group 5) and other obstetric complications (Robson groups 6-10).
Discussion
Audit on clinical impact of obstetric interventions and labour ward management has been proven successful towards reduction of caesarean section rates (Chaillet & Martens, 2007; Kiwanuka & Moore, 1993; Sheikh et al., 2008). Because of a 25% increase of caesarean section rate between 2001 and 2007 in Ziekenhuis Oost Limburg, Genk Belgium, an internal audit was performed, using the ten group classification system reported by Robson (Scarella et al., 2011). Two major changes of management of labour were initiated: (1) reduction of labour induction for non-medical reasons, (2) abstinence from prelabour obstetric interventions, such as amniotomy or oxytocin administration, unless full effacement of the uterine cervix is achieved spontaneously (Muys et al., 2010). In this paper, we report a 10-year audit on caesarean section rates, including 2,5 years of new labour ward management in our department.
The trend evolution for cesarean section rate in our hospital (Figure 1) was different from that in the general population of Flanders, where there was a gradual rise from 17.1% in 2001 to 19.4% in 2010. Our data show a parallel evolution between rate of labour inductions and their contribution to the total caesarean section rate (Figure 2). Induction of labour has been reported as an independent risk factor for emergency caesarean section in both nulliparous and multiparous women, irrespective of the indication for induction (Cammu et al., 2002; Ehrenthal et al., 2010; Seyb et al., 1999, Thorsell et al., 2011). The degree of risk may depend on maternal factors, such as parity, stature, body mass index, maternal and gestational age (Cnattingius et al., 2005; Heffner et al., 2003) and the use of epidural analgesia (Nguyen et al, 2010; Zimmer et al., 2000). In the United States, rising trends of labour inductions have been reported (Kirby, 2004; Rayburn & Zhang, 2002) and this increase was slower for medically indicated inductions than for non-medical inductions (Rayburn & Zhang, 2002). Our data illustrate that reduction of non-medical inductions successfully reduces induction-related caesarean sections (Figure 2) and that this contributes to a decrease of overall caesarean section rate (Figure 1).
The practice of active management of labour results in shorter duration of the first stage of labour and a modest reduction of caesarean section rate, (Brown et al., 2008; Sadler et al., 2000; Wei et al., 2009) but demands a strict diagnosis of onset of labour (Boylan et al., 2004). Initiation of medical interventions during labour, particularly in the latent phase or in early labour with unfavourable cervix, causes an increase of operative delivery (Indraccolo et al., 2010; Vrouenraets et al., 2005). Incorrect diagnosis of onset of labour may lead to medical interventions in women, who actually are not in established labour. As such, this practice can change a natural latent phase to an induced labour. Our data illustrate that training of the midwives towards unequivocal diagnosis of labour and postponing the first medical intervention until after full effacement of the cervix, may lead to a decrease of caesarean sections in both primiparous and multiparous women (Figure 3).
A most interesting observation from our audit is the shift in contribution to the overall caesarean section rate in different subpopulations over the 10-year study period. This is shown in Figure 4. In 2001, this contribution is equally high for spontaneous labours, induced labours and labours with caesarean scar uterus, however in 2010, the contribution from the latter group is much higher than from the other two groups. It is a logical evolution that the relative contribution from labours with caesarean scar uterus to the overall perinatal outcome grows, when there has been a rising trend of caesarean sections in the years before. In many countries and maternity clinics, the most common indication for caesarean section today is repeat caesarean section, which is way above other indications such as failure to progress, fetal distress or breech (Choudhury et al., 2009). The enigma “once a caesarean, always a scar” is already known for many years (Paul & Miller, 1995). The evolution presented in Figure 4 can perhaps be considered “the anatomy of rising caesarean section rates”, starting with medical interventions such as inductions in low risk patients, leading to secondary problems such as fetal distress, requiring solution with new medical interventions such as emergency caesarean section and finally resulting in a larger population of high risk patients: women with caesarean scar. The only way out of this spiral is re-installing non-medicalised management of labour in low risk women. The data presented in this paper show that this management is feasible and can be successful in terms of reversing a rising trend of caesarean sections.
Conclusion
We conclude from this 10-years audit on labour ward management in our department that there is an association between overall caesarean section rate and induction of labour at term with or without non-medically indicated obstetric interventions in low risk pregnant women. As a result of this association, a fraction of women who initially belong to the low risk group end up with caesarean section during the first labour and consecutively shift to a high risk group for the following pregnancies. This evolution can be considered “the anatomy of rising cesarean section trends”. Our data show that it is feasible to reduce the overall caesarean section rate by reducing the number of inductions and withholding obstetric interventions from low risk pregnant women unless there is a clear medical indication to intervene.
Acknowledgement
The authors thank Dr. M. Robson of the National Maternity Hospital, Dublin Ireland, for his kind recommendations on labour ward management and this manuscript.
References
- Aelvoet W, Windey F, Molenberghs G, et al. Screening for inter-hospital differences in caesarean section rates in low-risk deliveries using administrative data: an initiative to improve the quality of care. BMC Health Serv Res. 2008;8:3. doi: 10.1186/1472-6963-8-3. [DOI] [PMC free article] [PubMed] [Google Scholar]
- Blondel B, Kaminski M. The increase in multiple births and its consequences on perinatal health. J Gynecol Obstet Biol Reprod (Paris) 2002;31:725–740. [PubMed] [Google Scholar]
- Boylan P, Driscoll K, Meagher D. Active Management of Labour. Elsevier Health Sciences. 2004 [Google Scholar]
- Brennan DJ, Robson MS, Murphy M, et al. Comparative analysis of international cesarean delivery rate using 10-group classification identifies significant variation in spontaneous labour. Am J Obstet Gynecol. 2009;201:308. doi: 10.1016/j.ajog.2009.06.021. [DOI] [PubMed] [Google Scholar]
- Brown HC, Paranjothy S, Dowswell T, et al. Package of care for active management in labour for reducing caesarean section rates in low-risk women. Cochrane Database of Systematic Reviews. 2008;(CD004907) doi: 10.1002/14651858.CD004907.pub2. [DOI] [PMC free article] [PubMed] [Google Scholar]
- Cammu H, Martens G, Ruyssinck G, et al. Outcome after elective labor induction in nulliparous women: a matched cohort study. Am J Obstet Gynecol. 2002;186:240–244. doi: 10.1067/mob.2002.119643. [DOI] [PubMed] [Google Scholar]
- Chaillet N, Dumont A. Evidence-based strategies for reducing cesarean section rates: a meta-analysis. Birth. 2007;34:53–64. doi: 10.1111/j.1523-536X.2006.00146.x. [DOI] [PubMed] [Google Scholar]
- Choudhury AP, Dawson AJ. Trends in indications for caesarean sections over 7 years in a Welsh district general hospital. J Obstet Gynaecol. 2009;29:714–717. doi: 10.3109/01443610903191269. [DOI] [PubMed] [Google Scholar]
- Cnattingius R, Höglund B, Kieler H. Emergency cesarean delivery in induction of labor: an evaluation of risk factors. Acta Obstet Gynecol Scand. 2005;84:456–462. doi: 10.1111/j.0001-6349.2005.00620.x. [DOI] [PubMed] [Google Scholar]
- Costa ML, Cecatti JG, Souza JP, et al. Using a Caesarean Section Classification System based on characteristics of the population as a way of monitoring obstetric practice. Reprod Health. 2010;26:7–13. doi: 10.1186/1742-4755-7-13. [DOI] [PMC free article] [PubMed] [Google Scholar]
- Defoort P, Martens G. Increasing maternal age, increased cesarean section rate? Studycentre for Perinatal Epidemiology. 2000:84–89. [Google Scholar]
- Dursun P, Yanik FB, Zeyneloglu HB, et al. Why women request cesarean section without medical indication? J Matern Fetal Neonatal Med. 2011;24:1133–1137. doi: 10.3109/14767058.2010.531327. [DOI] [PubMed] [Google Scholar]
- Ehrenthal DB, Jiang X, Strobino DM. Labor induction and the risk of a cesarean delivery among nulliparous women at term. Obstet Gynecol. 2010;116:35–42. doi: 10.1097/AOG.0b013e3181e10c5c. [DOI] [PubMed] [Google Scholar]
- Fauendes A, Cecatti JG. Which policy for caesarean sections in Brazil? An analysis of trends and consequences. Health Policy Plan. 1993;8:27–40. [Google Scholar]
- Francome C, Savage W. Caesarean section in Britain and the United States 12% or 24%: is either the right rate? Soc Sci Med. 1993;37:1199–1218. doi: 10.1016/0277-9536(93)90332-x. [DOI] [PubMed] [Google Scholar]
- Heffner LJ, Elkin E, Fretts RC. Impact of labor induction, gestational age, and maternal age on cesarean delivery rates. Obstet Gynecol. 2003;102:287–293. doi: 10.1016/s0029-7844(03)00531-3. [DOI] [PubMed] [Google Scholar]
- Indraccolo U, Calabrese S, Di Iorio R, et al. Impact of the medicalization of labor on mode of delivery. Clin Exp Obstet Gynecol. 2010;37:273–277. [PubMed] [Google Scholar]
- Kirby RS. Trends in labor induction in the United States: is it true that what goes up must come down? Birth. 2004;31:148–151. doi: 10.1111/j.0730-7659.2004.00294.x. [DOI] [PubMed] [Google Scholar]
- Kiwanuka AI, Moore WM. Influence of audit and feedback on use of caesarean section in a geographically-defined population. Eur J Obstet Gynecol Reprod Biol. 1993;50:59–64. doi: 10.1016/0028-2243(93)90165-9. [DOI] [PubMed] [Google Scholar]
- Künzel W. The birth survey in Germany – education and quality control in perinatology. Eur J Obstet Gynecol Reprod Biol. 1994;54:13–20. doi: 10.1016/0028-2243(94)90075-2. [DOI] [PubMed] [Google Scholar]
- Muys J, Gyselaers W, Martens G, et al. Sectio-audit door middel van de Robson-analyse. Gynaikeia. 2010;15:52–57. [Google Scholar]
- Nguyen US, Rothman KJ, Demissie S, et al. Epidural analgesia and risks of cesarean and operative vaginal deliveries in nulliparous and multiparous women. Matern Child Health J. 2010;14:705–712. doi: 10.1007/s10995-009-0515-9. [DOI] [PubMed] [Google Scholar]
- Noguchi A. Lowering the premature birth rate: what the U.S. experience means for Japan. Keio J Med. 2008;57:45–49. doi: 10.2302/kjm.57.45. [DOI] [PubMed] [Google Scholar]
- Paul RH, Miller DA. Cesarean birth: how to reduce the rate. Am J Obstet Gynecol. 1995;172:1903–1907. doi: 10.1016/0002-9378(95)91430-7. [DOI] [PubMed] [Google Scholar]
- Rayburn WF, Zhang J. Rising rates of labor induction: present concerns and future strategies. Obstet Gynecol. 2002;100:164–167. doi: 10.1016/s0029-7844(02)02047-1. [DOI] [PubMed] [Google Scholar]
- Robson MS, Scudamore IW, Walsh SM. Using the medical audit cycle to reduce cesarean section rates. Am J Obstet Gynecol. 1996;174:199–205. doi: 10.1016/s0002-9378(96)70394-0. [DOI] [PubMed] [Google Scholar]
- Rooks JP. Evidence-based practice and its application to childbirth care for low-risk women. J Nurse Midwifery. 1999;44:355–369. [PubMed] [Google Scholar]
- Sadler LC, Davison T, McCowan LM. A randomised controlled trial and meta-analysis of active management of labour. BJOG. 2000;107:909–915. doi: 10.1111/j.1471-0528.2000.tb11091.x. [DOI] [PubMed] [Google Scholar]
- Scarella A, Chamy V, Sepúlveda M, et al. Medical audit using the Ten Group Classification System and its impact on the cesarean section rate. Eur J Obstet Gynecol Reprod Biol. 2011;154:136–140. doi: 10.1016/j.ejogrb.2010.09.005. [DOI] [PubMed] [Google Scholar]
- Schuler Barazzoni M, Roth-Kleiner M. Respiratory distress of the neonate and the rate of caesarean section have increased over the last 30 years. Is there a link? Rev Med Suisse. 2008;4:504–508. [PubMed] [Google Scholar]
- Seyb ST, Berka RJ, Socol ML, et al. Risk of cesarean delivery with elective induction of labor at term in nulliparous women. Obstet Gynecol. 1999;94:600–607. doi: 10.1016/s0029-7844(99)00377-4. [DOI] [PubMed] [Google Scholar]
- Sheikh L, Tehseen S, Gowani SA, et al. Reducing the rate of primary caesarean sections – an audit. J Pak Med Assoc. 2008;58:444–448. [PubMed] [Google Scholar]
- Shorten A, Shorten B. What happens when a private hospital comes to town? The impact of the ‘public’ to ‘private’ hospital shift on regional birthing outcomes. Women Birth. 2007;20:49–55. doi: 10.1016/j.wombi.2007.02.001. [DOI] [PubMed] [Google Scholar]
- Simpson L, Korenbrot C, Greene J. Outcomes of enhanced prenatal services for Medicaid-eligible women in public and private settings. Public Health Rep. 1997;112:122–132. [PMC free article] [PubMed] [Google Scholar]
- Sword W, Watt S, Krueger P et. The Ontario Mother and Infant Study (TOMIS) III: a multi-site cohort study of the impact of delivery method on health, service use, and costs of care in the first postpartum year. BMC Pregnancy Childbirth. 2009;28:9–16. doi: 10.1186/1471-2393-9-16. [DOI] [PMC free article] [PubMed] [Google Scholar]
- Thorsell M, Lyrenäs S, Andolf E, et al. Induction of labor and the risk for emergency cesarean section in nulliparous and multiparous women. Acta Obstet Gynecol Scand. 2011;90:1094–1099. doi: 10.1111/j.1600-0412.2011.01213.x. [DOI] [PubMed] [Google Scholar]
- Varner M. Queenan J, Spong C, Lockwood C (eds). Management of High-risk Pregnancy: an evidence based approach. 5th edition. Chapter 45. Oxford UK: Blackwell Publishing Ltd; 2007. Cesarean Delivery; pp. 382–388. [Google Scholar]
- Vrouenraets FP, Roumen FJ, Dehing CJ, et al. Bishop score and risk of cesarean delivery after induction of labor in nulliparous women. Obstet Gynecol. 2005;105:690–697. doi: 10.1097/01.AOG.0000152338.76759.38. [DOI] [PubMed] [Google Scholar]
- Wei S, Wo BL, Xu H, et al. Early amniotomy and early oxytocin for prevention of, or therapy for, delay in first stage spontaneous labour compared with routine care. Cochrane Database of Systematic Reviews. 2009;(CD006794) doi: 10.1002/14651858.CD006794.pub2. [DOI] [PubMed] [Google Scholar]
- Zimmer EZ, Jakobi P, Itskovitz-Eldor J, et al. Adverse effects of epidural analgesia in labor. Eur J Obstet Gynecol Reprod Biol. 2000;89:153–157. doi: 10.1016/s0301-2115(99)00191-8. [DOI] [PubMed] [Google Scholar]


