

Abstract
Purpose: Historically, treatment of malignant surface lesions has been achieved with linear accelerator based electron beams or superficial x-ray beams. Recent developments in the field of brachytherapy now allow for the treatment of surface lesions with specialized conical applicators placed directly on the lesion. Applicators are available for use with high dose rate (HDR) 192Ir sources, as well as electronic brachytherapy sources. Part I of this paper will discuss the applicators used with electronic brachytherapy sources; Part II will discuss those used with HDR 192Ir sources. Although the use of these applicators has gained in popularity, the dosimetric characteristics including depth dose and surface dose distributions have not been independently verified. Additionally, there is no recognized method of output verification for quality assurance procedures with applicators like these. Existing dosimetry protocols available from the AAPM bookend the cross-over characteristics of a traditional brachytherapy source (as described by Task Group 43) being implemented as a low-energy superficial x-ray beam (as described by Task Group 61) as observed with the surface applicators of interest.
Methods: This work aims to create a cohesive method of output verification that can be used to determine the dose at the treatment surface as part of a quality assurance/commissioning process for surface applicators used with HDR electronic brachytherapy sources (Part I) and 192Ir sources (Part II). Air-kerma rate measurements for the electronic brachytherapy sources were completed with an Attix Free-Air Chamber, as well as several models of small-volume ionization chambers to obtain an air-kerma rate at the treatment surface for each applicator. Correction factors were calculated using MCNP5 and EGSnrc Monte Carlo codes in order to determine an applicator-specific absorbed dose to water at the treatment surface from the measured air-kerma rate. Additionally, relative dose measurements of the surface dose distributions and characteristic depth dose curves were completed in-phantom.
Results: Theoretical dose distributions and depth dose curves were generated for each applicator and agreed well with the measured values. A method of output verification was created that allows users to determine the applicator-specific dose to water at the treatment surface based on a measured air-kerma rate.
Conclusions: The novel output verification methods described in this work will reduce uncertainties in dose delivery for treatments with these kinds of surface applicators, ultimately improving patient care.
Keywords: skin cancer, surface applicator, HDR
INTRODUCTION
The primary goal of radiation therapy is to deliver a precise dose of ionizing radiation to a specific region of interest to ensure death of malignant cells while sparing the surrounding healthy tissue. Skin cancer is the most common form of cancer in the United States, with over 2 × 10⁶ cases diagnosed each year, and an overall lifetime risk of one in five.1 However, if detected early, nonmelanoma skin cancers can often be treated or controlled effectively with radiation therapy.1, 2 Recently, specialized solid conical applicators have been developed for use with the Xoft Axxent® electronic brachytherapy system (eBx™) an iCAD company (San Jose, CA) for use in the treatment of superficial lesions. Treatments with these applicators generally involve positioning the applicator flush to a lesion while the source dwells within the applicator for a predetermined amount of time to deliver the desired dose. Additional details regarding the clinical use and therapeutic principals of these types of applicators can be found in several peer-reviewed publications.2, 3, 4, 5, 6
Source and applicator descriptions
Xoft offers a surface applicator set for use with the Axxent eBx source. The characteristics of this miniature x-ray source have been discussed by Rivard et al.7 The surface applicators available from Xoft position the long axis of the source perpendicular to the treatment surface (Fig. 1). The source to surface distance (SSD) for each applicator is 20.7, 20.6, 20.6, and 30.3 mm, for the 10, 20, 35, and 50 mm diameter applicators, respectively. Each applicator has a unique aluminum filter, positioned at the apex of the cone. This flattening filter helps to create a more uniform dose distribution at the treatment surface. The stainless steel applicators are available in sizes ranging from 10 to 50 mm in diameter. A disposable polycarbonate disk (1.0 mm thick) attaches to the exit window to provide a flat contact during treatment. The SSD for each cone is unique and must be considered during any dose measurements or calculations.
Figure 1.

Axxent surface applicator set.
Treatments with the Axxent applicators are similar to other clinical surface applicators. An applicator is positioned and secured to the patient, and the source is placed in the applicator. Treatment times for these applicators are calculated by the Axxent Controller based on the air-kerma strength of a bare source (as measured with a well-type ionization chamber).8 Currently, no peer-reviewed recommendations exist for dose or fractionation schedules for treatments with the Axxent surface applicators.
Existing dosimetry protocols and output verification procedures
TG-43
TG-43 (Refs. 9 and 10) is the standard dosimetry protocol for permanent low dose rate brachytherapy sources. A modified version of this protocol has been used to characterize the Axxent source.7 The quantity of interest in TG-43 is the dose rate in water, , at a specific radius, r, and angle, θ, from the longitudinal axis of the source.9, 10 The two-dimensional (2D) formalism for determining from a low-energy brachytherapy source is given by
| (1) |
where SK is the air-kerma strength in U, where 1 U = 1 cGy cm2 h−1, Λ is the dose-rate constant, GX(r, θ) is the geometry function, gX(r) is the radial dose function, and F(r, θ) is the 2D anisotropy function. Traditional uses of photon brachytherapy sources follow the dosimetry recommendations made in the American Association of Physicists in Medicine (AAPM) Task Group 43 report and updates.9, 10 However, the surface applicators of interest have not been well characterized and certain aspects of the standard brachytherapy dosimetry protocol cannot be applied directly.
TG-61
TG-61 is another dosimetry protocol of importance in the characterization of surface applicators as the position of a source in a surface applicator at some distance from the target gives the applicator some attributes of a low-energy external beam.11 TG-61 was originally designed for low- and medium-energy external beam x-ray systems with tube potentials ranging between 40 and 300 kV. The quantity of interest in the TG-61 protocol is dose to water, . An ionization chamber is used to measure air kerma, Kair, which is converted to a dose to water using multiplicative correction factors. An air kerma based methodology is recommended as there is no standard for absorbed dose to water at the National Institute of Standards and Technology (NIST) for these energies. Two methods of measuring air kerma with an ionization chamber are described in TG-61 depending on the beam energy and depth of interest. An in-phantom method is recommended for higher energy beams (tube potential ⩾100 kV), and a free-in-air method is recommended for lower energy beams (tube potential ⩽100 kV). The method of measuring Kair for low-energy x rays (appropriate for the 50 kV Axxent source) is described as a free-in-air measurement whereby a backscatter factor is used to account for the effect of phantom scatter. The reference point for this method is the phantom surface (zref = 0). The absorbed dose to water at the phantom surface is determined according to
| (2) |
where M is the chamber reading with the center of the chamber placed at the reference point, corrected for temperature and pressure, ionic recombination, polarity, and electrometer response. TG-61 recommends that thin-window parallel plate chambers be used for low energy x rays (tube potentials below 70 kV). If the chamber does not have an entrance window thick enough to remove electron contamination, thin plastic foils or plates should be added. NK is the chamber air-kerma calibration coefficient for the beam of interest. Bw is the backscatter factor defined for the reference field as the ratio of water kerma at the surface of a semi-infinite water phantom to water kerma at that point in the absence of the phantom. TG-61 has tabulated values of Bw determined with Monte Carlo simulations by Grosswendt12, 13 and independently verified with experimental data from Klevenhagen14 and additional Monte Carlo data from Knight and Nahum.15Pstem, air is the chamber stem correction factor that accounts for the change in photon scatter from the chamber stem between the calibration and measurement. If the users beam quality and field size match those used in calibration, no correction for the chamber stem effect is needed. However, if the user's field size is different from what was used at the time of calibration, the stem effect may be significant. This is especially true for parallel plate chambers because of the larger chamber body. Finally, is the ratio for water-to-air of the mean mass energy-absorption coefficients averaged over the incident photon spectrum. The values tabulated in TG-61 are from a global fit of data acquired by Seuntjens et al.,16 the IPEMB code of practice,17 and from Ma and Seuntjens.18
Current output verification procedures
Current output verification procedures for the Axxent applicators are based on the TG-61 protocol. An operator's manual provided by the manufacturer, describes how to implement a modified version of TG-61 for the applicator set using a small-volume parallel-plate ionization chamber.8
As described in TG-61, one descriptor of beam quality is the first half-value layer (HVL). Although the quantity of interest for the dose formalism in TG-61 is dose to water, the HVL must first be characterized. The recommended measurement geometry is a source-to-detector distance of 100 cm, with high-purity attenuators (Al or Cu) placed at 50 cm from the source.11 However, this measurement geometry is not reasonable for measurements with the Axxent applicators. The aluminum filter in each applicator creates enough inherent filtration that detection of a useful signal by a miniature ionization chamber 100 cm away is virtually impossible. With this in mind, the Axxent operator's manual suggests a source to detector distance of 30 cm with the filters placed at 15 cm from the source for HVL measurements of each applicator, however this geometry has a number of limitations.8
For determination of dose to water, a modified version of the free-in-air measurement method of TG-61 is suggested by the manufacturer. The operator's manual suggests that air-kerma rate measurements be completed with the chamber placed flush to the exit window of the applicator, using a positioning apparatus designed by Standard Imaging.8 The air-kerma rate measurements are then corrected by the factors described in TG-61. However, the listed values of Bw and in TG-61 were generated under ideal conditions, and the surface applicators of interest are not consisted with the same geometry, energy, and scatter conditions. Furthermore, current recommendations by the manufacturer set Pstem, air to unity although this may not be a valid assumption. Finally, TG-61 recommends that the center of the chamber volume be placed at the reference point during measurements. For surface applicators this is at the exit window of the applicator, but even with a small-volume parallel-plate ionization chamber placed flush to the exit window, the center of volume is not at the recommended reference point.
Motivation for an improved dosimetry method
While standard dosimetry protocols exist for brachytherapy sources and low-energy external photon beams, the geometric, and scatter conditions observed with the Axxent surface applicators do not conform to the requirements of either TG-43 or TG-61. Further, the use of interpolated correction values from TG-61 may not be appropriate and may have a negative impact on the calculated treatment times. This work aims to create a direct method of output verification that is applicable to various types of surface applicators in order to ensure an accurate dose is delivered to the patient. Knowledge of the dose rate at the treatment surface has the potential to reduce treatment times, which may further reduce some of the known side effects of radiation therapy of skin cancers including erythema, pruritus, and desquamation.2
Proposed formalism
The focus of this work culminates in a proposed dosimetry formalism to allow clinical users of these surface applicators to accurately determine the dose at the treatment surface as part of a commissioning/quality assurance program. The proposed dosimetry formalism is based on an ionization chamber measurement of air-kerma rate at the applicator exit window interface, and a set of correction factors are then applied to determine an applicator-specific dose to water. In general, the absorbed dose to water is determined as
| (3) |
| (4) |
where the air kerma, Kair, is determined through: M, the measured charge reading over a collecting period, ; the electrometer calibration coefficient, ; the correction for ambient temperature and pressure, and NK; an applicator-specific calibration coefficient. is a chamber replacement factor, where is the Monte Carlo calculated kerma to air-volume at the point of measurement and is the Monte Carlo calculated kerma to the chamber-volume at the point of measurement, is an effective point-of-measurement correction, where dc is the distance from the chamber entrance window to the center of the chamber collecting volume. The dose to water, is then determined by multiplying the air kerma, Kair by , where is the Monte Carlo calculated dose to water at the depth of interest and is the Monte Carlo calculated air kerma at the exit window of the applicator. The specific methods of determination, instrumentation, and details regarding each parameter of the proposed formalism will be discussed.
METHODS AND MATERIALS
Air Kerma
The fundamental quantity of interest in this investigation is the air kerma or air-kerma rate at the treatment surface (or exit window of the surface applicators). Measurements of the air-kerma rate were completed with a variety of ionization chambers including: the Attix Free-Air-Chamber (FAC), an Exradin A20 end-window parallel plate chamber (Standard Imaging), and PTW TN34013 miniature parallel plate chambers (PTW). The Exradin A20 chamber was purchased for this investigation and the PTW TN34013 chambers were supplied by Xoft Inc., an iCAD company. The Attix FAC is a NIST-traceable standard chamber available at the University of Wisconsin Accredited Dosimetry Calibration Laboratory (UWADCL). The Attix FAC allowed for a NIST-traceable measurement of the air-kerma rate for each applicator, based upon existing primary air kerma standards creating a pathway of traceability to standardized values. Traceability and an accurate determination of the air-kerma rate is essential for the proposed dosimetry formalism to be viable in the clinical setting. Monte Carlo simulations of various parameters were completed for the PTW TN34013 and Exradin A20 to fully characterize their response and compare to measured values.
Monte Carlo methods
Simulations performed with MCNP5 used the MCPLIB04 and MCPLIB84 photon cross-section libraries.19, 20, 21 These cross-section libraries incorporate coherent and incoherent scattering, photoelectric absorption, and pair-production cross-sections for energies ranging from 1 keV to 100 GeV for elements with atomic numbers 1 to 100.20 The electron cross-section library used was derived from the Integrated TIGER Series Version 3.0 (ITS3.0) code from Halbleib at Sandia National Laboratories (Albuquerque, NM).20, 22, 23 The electron library included radiative stopping powers, bremsstrahlung production cross sections and energy distributions, K-edge and Auger production energies, the Goudsmit-Saunderson theory for angular deflections, knock-on electron probabilities, and density effect calculations.20 The *F4 and F6 tallies were used throughout this investigation, depending on the quantity of interest and simulation geometry.
The EGS Monte Carlo code developed at the National Research Council (NRC) in Canada (EGSnrc) was also used in this investigation. EGSnrc is a unique open-source code that offers a wide array of user codes for coupled photon-electron transport depending on the quantity of interest. In this work, the user code “egs_chamber” was utilized. The egs_chamber user code allows the user to create complicated simulation geometries and is useful for simulations of ionization chambers. The prepackaged “DOSRZnrc” user code was also utilized, however it only allows for cylindrically symmetrical geometries, and only tallies the dose to a given region of interest. The EGSnrc version 1.32 was used in this investigation with cross-section libraries for elements with atomic numbers ranging from 1 to 100. EGSnrc transports photons and electrons with an energy range from 1 keV up to several hundred GeV. Several physics processes are accounted for in EGSnrc including bremsstrahlung production using the Bethe-Heitler cross sections or the NIST cross sections. Multiple scattering of charged particles is based on Rutherford scattering or scattering accounting for relativistic and spin effects, including Møller and Bhabha scattering with continuous energy loss as applied to charged particles between discrete interactions. Compton scatter effects use either Klein-Nishina or bound Compton cross sections. Rayleigh scattering, photoelectric effect, and relaxation of excited atoms to create fluorescence photons in the K, L, and M shells and Auger and Coster-Kronig electrons are also modeled in EGSnrc.24 This investigation utilized the bremsstrahlung cross sections from NIST, multiple scattering included relativistic spin effects, and the Compton scattering used an impulse approximation as suggested for low-energy simulations.25 Several variance reduction options are available with EGSnrc including Russian roulette, beam splitting, electron range rejection, and force photon collisions. The recent addition of photon cross section enhancement was of interest for simulations with egs_chamber code. Specific details regarding simulation geometries and tally parameters are described within each respective section below.
Chamber air-kerma calibration coefficients
The two types of small-volume parallel plate chambers utilized in this work were calibrated for air kerma at the UWADCL, which offers AAPM-accredited NIST-traceable calibrations for various beam qualities and sources. The x-ray beam qualities of interest in this work are UW50-M and UW60-M (matched to M50 and M60 NIST beam qualities, respectively). As no standard beam quality exists for the Axxent source, surface applicator-specific chamber calibration coefficients for the Axxent source (in an applicator) were interpolated based on the known HVL's and measured chamber calibration coefficients of the UW50-M and UW60-M standard beam qualities in combination with the measured HVL of each applicator.
PTW TN34013
The PTW TN34013 ionization chamber (Fig. 2) is an air-communicating miniature parallel plate chamber with a quoted collecting volume of 0.0053 cm3 and is designed for soft x-ray measurements up to 50 kVp.26 The energy dependence is quoted to be less than 2% across the energies of interest for this investigation and the work of Pike27 observed a similar value of 3%. This chamber was recommended by Xoft, Inc. for air-kerma rate measurements with the Axxent surface applicators until May 2013.8
Figure 2.

PTW TN34013 miniature parallel-plate chamber.
The chamber body of the PTW TN34013 is polyethylene and the collecting electrode is graphite (1.7 mm in diameter). The entrance window is stated to be 2.3 mg cm−2 in areal density, though the material composition is unknown.26 The materials and dimensions used in Monte Carlo modeling of this chamber stemmed from a combination of the manufacturer's provided specifications as well as the investigation of Pike.27 Figure 3 shows a rendering of the PTW TN34013. Due to the lack of detailed material and dimensional information, (and in agreement with Pike) the results of Monte Carlo simulations with the PTW TN34013 were analyzed with an increased awareness of the associated uncertainties.27
Figure 3.

VisEd rendering of the PTW TN34013 chamber with the Axxent source and 20 mm Axxent surface applicator.
In addition to uncertainties in the physical traits of the PTW TN34013, the effective point of measurement within the chamber collecting volume must be considered. Theoretically, the plane of measurement for a parallel plate ionization chamber lies on the inner surface of the entrance window.28 As the plane of interest for surface applicators is directly at the exit window/chamber entrance window interface, the displacement of the effective point of measurement away from this interface must be considered. All measurements with the Axxent surface applicators were corrected by an inverse-square correction that accounted for the quoted 0.0247 mm thickness of the chamber entrance window (assumed to be polyethylene).
Air-kerma calibration coefficients for five PTW TN34013 chambers were determined at the UWADCL at the UW50-M and UW60-M beam qualities. The entrance window of each PTW TN34013 chamber was modified prior to calibration as TG-61 recommends that there be at least 4 mg cm−2 of buildup present for 50 kV beams and 5.5 mg cm−2 for 60 kV beams. The inherent thickness of the PTW TN34013 entrance window is only 2.3 mg cm−2 in areal density. The addition of a 0.025 mm thick (ρ = 1.42 g cm−3) polyimide layer added 3.55 mg cm−2 to the window, for a total of 5.90 mg cm−2 of buildup. This additional material allows the chamber to meet the TG-61 recommendations for both 50 and 60 kV beams.11 In accordance with the calibration protocol, the center of the chamber collecting volume was positioned at 1 m from the source. Prior to calibration, each chamber was irradiated with the beam of interest for a warm-up period of 15 min. The noise level was continuously monitored, and the electrometer signal was zeroed whenever the noise level was too great or the signal unstable. Unfortunately, the signal-to-noise ratio (SNR) for the PTW TN34013 chambers was very low, and the signal was unstable at times. These performance issues required that the calibration uncertainty be increased to 3.0% at k = 2 from the normal 1.0% in some instances.
The egs_chamber and DOSRZnrc codes were used to calculate air-kerma calibration coefficients for the PTW TN34013 for the UW50-M and UW60-M beam qualities. Previous work of Pike27 established a model of the PTW TN34013 ionization chamber in egs_chamber and it was used for initial simulations in this investigation. Additional details regarding egs_chamber Monte Carlo simulations of this chamber can be found in the work of Pike.27 Calculated calibration coefficients were obtained by taking the ratio of the simulated air-kerma for a given beam-quality to the simulated chamber response determined as the dose to the active collecting volume for the chamber at the same beam-quality. The air-kerma was determined with DOSRZnrc by scoring the dose to a thin slab of air from each beam or source of interest. The user code egs_chamber was used to calculate the dose to the active collecting volume for each beam of interest. The simulated PTW TN34013 was positioned in-air, 1 m away from the source. Each beam quality (source) was simulated as a collimated point-source producing a (10 × 10) cm2 field at a distance of 1 m, matching the calibration geometry.
Exradin A20
The Exradin A20 end-window parallel-plate chamber was designed by Standard Imaging at the request of Xoft Inc., an iCAD company, for measurements with surface applicators described in this investigation (Fig. 4) and is now recommended for use with the Axxent surface applicators. The chamber has a polyimide entrance window (areal density of 7.72 mg cm−2) with a C552 (ρ = 1.76 g cm-3) air-mimicking chamber body, collector, guard, and a nominal collecting volume of 0.0738 cm3. C552 is considered to be a low-Z material and was chosen for this chamber assembly to reduce the anomalous behaviors often observed with miniature ionization chambers.29 Chamber dimensions and material specifications were provided by the manufacturer, allowing for accurate Monte Carlo modeling in MCNP5 and egs_chamber.
Figure 4.

Exradin A20 end-window parallel-plate chamber and C552 buildup cap.
The end-window design of the Exradin A20 chamber largely eliminates stem effects typically observed with side stem geometry parallel-plate chambers. Reduced or negligible stem effect in combination with the overall performance and stability of the most recent version of the Exradin A20 made this chamber suitable for surface dose measurements the surface applicators of interest.
The design of the Exradin A20 chamber is unique, and special consideration of the extended distance between the entrance window and collector must be applied. As discussed, the theoretical effective point of measurement for a standard geometry parallel plate chamber is at the inside surface of the entrance window. This assumption is valid for parallel-plate chambers with a small entrance window-to-collector distance, where the electric field lines are parallel and uniform across the collecting volume. However, this assumption cannot be applied directly for a chamber with an extended window to collector distance as observed with the Exradin A20. Advances in modeling of electric field lines within air-cavity ionization chambers has allowed for a rational estimation of the effective point of measurement for the Exradin A20. The manufacturer provided electric field modeling diagrams with calculations of the overall collecting volume and collecting volume centroid for the Exradin A20. From this analysis, the centroid of the collecting volume (1.8 mm back from the inside surface of the chamber entrance window) was considered to be the effective point of measurement in this investigation.
Air-kerma calibration coefficients were measured for the Exradin A20 with the center of the collecting volume positioned 1 m from the source, similar to the PTW TN34013. However, in contrast to the PTW TN34013, the Exradin A20 was used for measurements at Axxent and 192Ir energies (see Part II). As such, calibration coefficients were determined across the energy range spanning from UW50-M to 137Cs. Applicator-specific chamber calibration coefficients for the Axxent source (in an applicator) were interpolated based on the known HVL's and measured chamber calibration coefficients of the UW50-M and UW60-M beams in combination with the measured HVL of each applicator. Calibration coefficients were calculated for the Exradin A20 in the same manner as previously described using egs_chamber and DOSRZnrc.
Primary measurement of air-kerma rate
The Attix FAC provided a primary measurement of the air-kerma rate with the Axxent applicators, and the two models of small-volume-parallel plate chambers were used to investigate the clinically relevant measurement methodology. The Attix FAC is a variable-aperture and variable-collecting volume ionization chamber developed at the UWADCL.30 The Attix FAC is considered a primary measurement device in that it can directly realize the quantity of interest; air kerma, by using a subtraction-based methodology, as described in Coletti et al.30 The Attix FAC was designed for use with sources up to 50 keV, making it appropriate for use with the Axxent source and applicators.
The detailed methodology for the use of the Attix FAC with Axxent sources is described in Davis25 and was used for this investigation with a few modifications. Before air-kerma rate measurements with the Axxent source and surface applicators were performed, the air-attenuation correction was determined for each round of measurements. An air-attenuation correction is necessary in order to account for the 19 cm of air that exists between the beam defining aperture and the center of the FAC collecting volume. The air-attenuation correction was measured for each applicator by positioning the source (in the applicator) at a fixed distance from the beam-defining aperture with the chamber plate separation fixed to 200 mm. The Axxent source was operated at a tube potential of 50 kV and beam current of 300 μA for all measurements in this investigation. Charge readings using a Standard Imaging Max4000 electrometer were taken with the chamber centered at 81 and 100 cm from the source. The resulting change in the collected charge between the two measurement distances can be attributed to the attenuation of photons over the 19 cm of air between the beam defining aperture and the center of the FAC collecting volume. After air-attenuation measurements were completed, a modified version of the methods of Davis25 were followed to obtain an air-kerma rate at the exit window for each applicator with the Attix FAC. The air-kerma rate with a source-to-chamber distance of 60, 80, and 100 cm was measured for each applicator. These distances were chosen as alignment uncertainty increases with source-to-chamber distances of less than 50 cm (Refs. 25 and 30) and the signal to noise ratio at points beyond 100 cm was unsatisfactory for relevant measurements. As the plane of interest in this investigation is the exit window of the surface applicator, an extrapolation of the air-kerma rates determined at each distance was performed by applying a power function to three measurement points. A single source was used for all applicators during each experimental trial. Source stability was observed before and after each round of measurements using an HDR1000 Plus well-chamber. Criterion for acceptance of a source was a 2% or less drift in the current observed over a period of 5 min.
PTW TN34013 ionization chamber
Two models of small volume parallel plate chambers were used to investigate the clinically relevant measurement methodology. Despite difficulties in calibration of the PTW TN34013 chamber, air-kerma rate measurements were completed with the Axxent surface applicators using the original protocol from the manufacturer. Each chamber was positioned in the center of each applicator using an L-shaped holder designed by Standard Imaging (Fig. 5). After a warm-up period, 30 s charge readings were acquired with a Standard Imaging Max4000 electrometer. The noise level was continuously monitored and the electrometer signal was zeroed as needed. As observed during calibrations, the signal level was very low, with typical values of approximately 5 pA. The air-kerma rate at the surface was calculated as
| (5) |
where is the air-kerma rate in cGy · h−1, M is the collected charge reading, NK is the air-kerma calibration coefficient, Pe is the electrometer correction factor, PTP is the ambient temperature-pressure correction factor, SSD is the applicator-specific SSD, dc is the distance from the entrance window of the chamber to the effective point of measurement, and t is the length of each charge collection.
Figure 5.

PTW TN34013 positioned in center of Axxent surface applicator with SI holder. Image courtesy of Rong and Welsh (Ref. 31).
Exradin A20
Air-kerma rate measurements at the exit window were completed for all source and applicator combinations with the Exradin A20 chamber. The chamber was positioned in the center of the applicator using a C-shaped holder designed by Standard Imaging for the Axxent applicators (Fig. 6). After a warm-up period of 5 min, 15 s charge readings were acquired with a Standard Imaging SuperMAX electrometer. After an initial “zeroing” of the system, the noise level was continuously monitored and the electrometer signal was zeroed as needed, though it was rarely necessary. The air-kerma rate at the surface was calculated in the same manner as described in Eq. 5.
Figure 6.

Axxent surface applicator and A20 chamber.
Conversion factors for determination of absorbed dose to water
Even though air-kerma rate is the measured quantity of interest in the proposed formalism, the clinically relevant quantity of absorbed dose to water was also determined. Conversion factors accounting for the presence of the chamber during the air-kerma rate measurements, in addition to a dose to water conversion from air-kerma, were determined for all source and applicator combinations. As discussed, the Exradin A20 chamber was utilized for air-kerma rate measurements in the proposed formalism, and all calculations of conversion factors confirmed its suitability for use in this work. MCNP5 and egs_chamber were used to calculate a chamber replacement factor and a dose-to-water conversion factor for each source and applicator combination. Ease of modeling complex geometries in MCNP5 and egs_chamber allowed for the creation of complete models for each source and applicator combination as well as the Exradin A20 chamber. Source, applicator, and ionization chamber dimensions and material specifications were based on manufacturer-provided information.
A full source model was used for simulations with the Axxent source in MCNP5 (Ref. 25). The Axxent source spectrum was simulated using both photon and electron transport, with a uniform electron distribution on the inner diameter of the anode, and with ITS-style energy indexing.32 The energy cutoffs for photons and electrons were 1 keV. The collision-kerma (F6) tally was used to calculate the collision kerma at the exit window and at points of interest away from the applicator in both air and water. Sufficient particles were run in combination with variance reduction techniques to achieve reported statistical uncertainties of less than 0.2%.
Complete Axxent surface applicator models were created in egs_chamber, and used in combination with the existing ionization chamber models for the Exradin A20 and PTW TN34013. The Axxent source was simulated as a point source in the corresponding location of the anode within a real source. The spectrum of this point source was based on the Monte Carlo-generated spectrum as determined and verified in the work of Davis.25 A dose tally (the only tally option available in egs_chamber) was used to determine the dose at the exit window and at points of interest away from the Axxent applicators in air and in water. While an accurate model of the Exradin A20 was established, the model of the PTW TN34013 chamber was based on several assumed geometry and material specifications, and results of simulations for the PTW TN34013 chamber were assigned a higher uncertainty, as discussed previously.
Chamber replacement factor
The proposed formalism (Sec. 1D) presents a chamber replacement factor, , which accounts for the presence of the ionization chamber during air-kerma rate measurements. A conversion factor that is related to the proposed Pcham is defined in TG-61 as and was intended to account for the change in photon scatter due to the chamber stem between the user's beam and the calibration beam. Measurement of this conversion factor is nontrivial, and TG-61 discusses a relative method of determining for a given chamber by comparing the response of the chamber under investigation to the response of a chamber with a known for two different field sizes.11 Classically, the influence of the chamber stem on measurements was determined by positioning varying amounts of the chamber stem within a radiation field and comparing the response of the chamber to that observed with the field used in calibration.33 Although this methodology is theoretically straightforward, application can be nontrivial. Accurate determination of the length of chamber stem irradiated for each condition can be difficult if the field under study is not rectangular, as the field edge would intersect the chamber body obliquely. Even with a rectangular field, only four orientations can be studied to ensure a perpendicular junction of the field with the chamber body. Finally, the active volume of the chamber must be placed at the same location within the field, however the spectrum and fluence may change for each orientation, further complicating accurate resolution of a chamber stem conversion factor.
The proposed formalism chamber replacement factor, Pcham, uses a slightly different approach to account for the presence of the chamber by calculating the ratio of the dose to a volume of air corresponding to the collecting volume of the chamber centered on the exit window for each source and applicator combination, to the dose to the collecting volume of air with a full model of the chamber centered on the exit window for each source and applicator combination. An intercomparison of Pcham for the Axxent surface applicators that were calculated with egs_chamber and with MCNP5 was completed. It was determined that MCNP5 and egs_chamber produced the same value for all of the chamber replacement factors within the expected uncertainties. As a result, MCNP5 was used for the determination of the remaining conversion factors due to the shorter computational time, and the ability to model complex geometries.
Dose to water conversion factor
After determination of the air-kerma rate in the proposed formalism, the dose rate in water can be obtained by applying a dose to water conversion factor, . This factor effectively converts the in-air measurement of air-kerma rate at the applicator exit window to a dose to water for a given point of interest at the surface or at depth in water. values were calculated in MCNP5 for each source and applicator combination as the ratio of the air kerma at the applicator exit window to the dose at a point of interest in water with full backscatter conditions using the F6 tally. For simulations with full-backscatter, each source and applicator combination was positioned flush to the surface of a (30 × 30 × 30) cm3 water phantom. The tally region for the dose-to-water conversion factors was a cylinder with a height of 0.01 cm and a radius of 0.2616 cm, matching that of the quoted collecting region radius for the Exradin A20. The true point of calculation for this tally cell is defined in the center, meaning that the actual point of calculation for the depth of 0 mm in Table 1 is 0.005 cm from the applicator/phantom interface. To account for this slight offset, the dose at the surface was extrapolated from the nearby data points.34
Table 1.
Calculated values for the Axxent surface applicators.
| Depth (mm) |
|||||||||
|---|---|---|---|---|---|---|---|---|---|
| Diameter (mm) | 0 | 0.05 | 0.5 | 1 | 1.5 | 2.0 | 2.5 | 3.0 | 5.0 |
| 10 | 1.073 | 1.086 | 1.007 | 0.935 | 0.874 | 0.818 | 0.768 | 0.720 | 0.565 |
| 20 | 1.103 | 1.121 | 1.040 | 0.972 | 0.912 | 0.860 | 0.812 | 0.766 | 0.613 |
| 35 | 1.128 | 1.147 | 1.066 | 0.997 | 0.938 | 0.884 | 0.837 | 0.791 | 0.637 |
| 50 | 1.155 | 1.169 | 1.103 | 1.050 | 1.003 | 0.959 | 0.919 | 0.880 | 0.743 |
The dose to water conversion factor for the Axxent sources was calculated using the F6 tally in air and in water as collision kerma is essentially equivalent to dose in Axxent energy range.
Dosimetric characterization
A complete dosimetric analysis of each source and applicator combination was completed using experimental techniques in addition to Monte Carlo simulations in MCNP5. Relative dose distribution information is essential for any quality assurance or commissioning processes with these kinds of applicators. Percentage depth-dose curves and relative dose distributions were calculated for each source and applicator combination and compared to measured values.
Percentage depth-dose
Percentage depth-dose curves were measured for all source and applicator combinations using the Exradin A20 chamber in a specialized water phantom. An acrylic water-proofing cap was manufactured by Standard Imaging for the Exradin A20 chamber. The water phantom consists of a 31 × 46 × 61 cm3 water tank with three independent axes attached. These axes allow for precise motorized control of instruments in three orthogonal directions within and around the water tank. A L-shaped Virtual WaterTM holder that attached to one axis of the tank and positioned each surface applicator at the surface of the water was designed and machined in-house. Another L-shaped acrylic holder that held the chamber was also machined in-house. Before each experimental trial, the center of the applicator was determined by placing a center finder in the acrylic chamber holder, pointed toward the surface of the water. The hole for the center finder was machined at a known distance from the center of the hole for the ionization chamber. The precision VelmexTM motors (Bloomfield, NY) located on each independent axis were used to position the center finder in the center of the hole for the applicator, and the axes were zeroed to define the coordinate system used in defining the chamber displacement relative to the exit window of the surface applicator. The applicator and chamber were then placed in each respective holder, the applicator was lowered to meet the surface of the water, and the chamber was positioned flush to the applicator exit window. The chamber was allowed to warm up for approximately 5 min before 15 s charge readings were acquired with a Supermax electrometer. Several charge readings were acquired at each depth, ranging from 0 to 3 cm in 0.5 mm increments. It should be noted that chamber readings were corrected by the SSD-based inverse-square correction as discussed above in order to obtain a reading directly at the chamber/applicator interface.
Monte Carlo simulations in MCNP5 of the percentage depth-dose curves for all source and applicator combinations were completed for comparison to the measured values. The applicator was positioned on the surface of a (30 × 30 × 30) cm3 water phantom and a cylindrical *F4 mesh tally (tally cell dimensions: r = 0.13 cm, h = 0.04 cm, θ = 2π) was used to calculate the collision kerma to each tally volume.
Relative dose distributions
Relative surface dose distributions and profiles were measured using a combination of radiochromic films and thermoluminescent dosimeters (TLDs) for all source and applicator combinations. Solid poly-methyl methacrylate (PMMA) ρ = (1.18 ± 0.01) g cm−3 phantoms were constructed with machining tolerances of 0.0254 mm (0.001”) to hold TLD-100 microcubes and position radiochromic film for surface and at-depth measurements. The TLD phantom was machined to hold microcubes flush to the surface in a circular pattern at radii ranging from 0 to 2.5 cm (Fig. 7). Film measurements were completed with film positioned at the surface or at depth in the solid phantom. Sufficient backscatter (at least 10 cm) was included during all measurements.35 The PMMA material used in construction was sent to Columbia Analytical Services (Tucson, AZ) for atomic compositional analysis, with the following results: C = 59.50%, H = 8.11%, O = 32.34%, and N = 0.05%. Contributions of 0.006% or less were reported for the following elements: Si, Na, P, and K. These measured weight fractions are within 0.5% of the composition of pure PMMA (C5O2H8). Columbia Analytical Services did not provide a measure of uncertainty in the PMMA composition analysis, thus it was not included in the uncertainty budget. Multiple researchers have investigated the influence of phantom materials on the measurement process.36, 37, 38, 39, 40 PMMA was chosen as a phantom material for this work because of its purity and lack of high-Z elements (in comparison to calcium present in Solid Water™).40 A correction from the measured PMMA composition to liquid water was determined using Monte Carlo calculations to allow for a direct comparison between experimental and calculated values.
Figure 7.

Rendering of phantom design for TLD-100 microcube measurements. (a) Schematic of TLD phantom design.(b) Detailed view of TLD phantom with TLD-100 microcubes in wells with the 10 mm Axxent surface applicator.
Monte Carlo simulations in MCNP5 of the relative dose distributions for all source and applicator combinations were completed for comparison to measured values. A modified energy fluence (*F4) mesh tally was used to calculate relative dose distributions in water for each applicator as MCNP5 does not allow for the F6 collision kerma tally to be used with the mesh tally function. However, Davis25 demonstrated the equivalence of the *F4 and F6 tallies for the energy and simulation conditions used in this work. Cartesian and cylindrical mesh tallies were used throughout this investigation. The voxel dimensions within the mesh tally region were varied to achieve the best resolution possible while maintaining a reasonable calculation time. An example voxel size for the cartesian mesh was (0.07 × 0.07 × 0.03) cm3. Normalized dose profiles and isodose values were obtained by extracting the values of the mesh tally at the line or plane of interest, respectively.
Thermoluminescent dosimeters
TLD-100 (LiF: Mg, Ti) microcubes were used for all phantom measurements and were handled with vacuum tweezers.41, 42 All dosimeters were fully annealed before and after each experiment at 400 °C for 1 h, quickly cooled on aluminum plates, followed by an 80 °C anneal for 24 h. Dosimeters were read 24 h after exposure using a Harshaw model 5500 TLD reader which uses hot nitrogen gas to heat the TLDs. The time-temperature profile included an initial heating to 50 °C followed by a data collection region using a 13 °C s−1 temperature increase and a maximum temperature of 350 °C. Each cube was marked on one edge with a pencil for consistency in positioning during readout. Before and after each experiment all dosimeters were exposed to 100 cGy with 60Co to determine individual TLD sensitivities. For further discussion of the TLD methodology utilized in this work, the authors refer to the methods of Nunn et al.43
For each experiment, 30 TLDs were used as calibration dosimeters. Separate sets of ten TLDs were irradiated to 50, 100, and 150 cGy dose to water at 1 m from the source of the Theratronics T1000 60Co irradiator at the UWMRRC. A reading (nC) to dose (cGy) calibration coefficient was then determined for each trial in order to calculate the dose rate at each point of measurement.
On the day of each experiment, the dose to the TLDs was estimated based on air-kerma rate measurements for each applicator using the Exradin A20 chamber. A target dose of 100 cGy was used in establishing irradiation times for all trials. This dose level ensured that each dosimeter had a large enough SNR, but was not in the TLD supralinearity region.44 Each phantom was loaded with TLDs prior to placement of the applicator. At least three trials were performed for each source and applicator combination. The following equation was used to determine the dose, D(r, θ), in water from the TLD output
| (6) |
where R is the corrected TLD reading in nC, N is the calibration coefficient (in cGy/nC), is the intrinsic energy dependence correction for the source of interest (η = Axxent or 192Ir), C(r, θ) is the Monte Carlo determined correction factor from PMMA to water and t is the irradiation time. Irradiation times for measurements with the Axxent surface applicators were based on the total air kerma for a given source recipe and applicator as measured with the Exradin A20. Unlike a traditional isotope-based brachytherapy source, the Axxent source needs time to ramp up (and down) the parameters controlling source output, including the tube potential and beam current. The time course of the ramp up, fully on, and ramp down periods is termed a recipe by the manufacturer. The recipe used for TLD irradiations with the Axxent source and applicators was 48 s long. The corrected reading, R, was obtained by multiplying the raw TLD reading by a PMT linearity factor, a background adjustment, and an individual dosimeter sensitivity factor.45, 46, 47
It is well known that TLD photon energy dependence differs from that of water.28, 48 This work was not meant to be an investigation of this phenomenon, but it warrants discussion. Previous brachytherapy investigators have calculated the energy dependence of LiF:Mg,Ti TLDs using Monte Carlo methods, which can account for the energy absorption characteristics of LiF, self-attenuation in the TLD, and volume averaging over the finite detector size.39, 49, 50, 51, 52, 53 Recent work has demonstrated an additional component of TLD-100 energy dependence that cannot be calculated using general-purpose Monte Carlo codes.54, 55 This intrinsic energy dependence arises from the solid-state nature of the detector and can be up to a 13% effect at low photon energies (12–145 keV). Work at the UWMRRC by Pike led to an intrinsic energy dependence correction, , of 0.910 being applied to the Axxent TLD results.27
Since TG-43 and TG-61 specify a dose rate in water, it is necessary to correct for the fact that liquid water was not used as the medium for the TLD measurements. The correction factor, C(r, θ), accounted for the material difference between water and PMMA, finite detector size, and absorbed dose energy dependence of the TLD. A generalized equation follows:
| (7) |
where DTLD, η(r, θ) is the MCNP calculated dose to TLD at η= Axxent or 192Ir energies (see Part II). The exact experimental setup for each TLD surface dose measurement with each source and applicator combination was simulated separately to determine the dose to TLD. Dwater, η(r, θ) is the dose to water at the corresponding radius and polar angle of interest with all materials in the simulation geometry of each experimental setup set to water. This ratio,, accounts for material differences between water and PMMA, as well as finite detector size.
To account for the absorbed dose energy dependence of TLDs, Monte Carlo simulations of the dose to water () as compared to the dose to TLD () at 60Co energies were completed using MCNP5. Fully coupled photon-electron transport with a photon energy cutoff of 1 keV and an electron energy cutoff of 10 keV was used for the simulations. A point source model of 60Co photons using the photon spectrum from Mora et al.56 was placed at 100 cm from a water phantom surface. The TLD dose and water dose calculations were performed separately at a depth of 5 cm in a large water phantom.57
Radiochromic film
Relative surface intensity distributions and distributions at depth were measured with Gafchromic® EBT2 (Ashland Inc., Wayne, NJ). Significant research regarding the response of radiochromic films has been completed in the past and only relevant dosimetry concepts will be discussed here.58, 59, 60, 61, 62, 63 EBT2 film is comprised of five materials layered on one-another including a polyester substrate, an active layer, a topcoat, an adhesive layer and a polyester overlaminate and several authors have demonstrated minimal energy dependence with EBT2 across a large range of energies,64, 65 making it appropriate for use at the Axxent. A notable feature of EBT2 is a yellow dye that is uniformly incorporated into the active layer. This dye is designed to reduce scanning nonuniformities during digitization and has been extensively investigated at the UWMRRC in the work of McCaw et al.58 Early attempts were made to obtain absolute dose information from the EBT2 films acquired for the Axxent surface applicators. At the time, the EBT2 film had only recently been made available and the investigation of McCaw et al.58 was on-going. As such, the EBT2 film measurements were not characterized for determination of absolute dose and the results were used for relative dose characterizations only by analyzing the net pixel values.
Surface measurements were acquired by placing each applicator on top of a (6 × 6) cm2 piece of film positioned in the center of a (30 × 30 × 10) cm3 PMMA phantom. All films were stored and handled according to the recommendations of AAPM TG-55 report.66 The Exradin A20 was used to determine the applicator-specific air-kerma rate on the day of each experiment and was used to estimate the exposure time to deliver approximately 400 cGy air kerma. An Epson Expression® 10000 XL flatbed scanner (Epson America, Long Beach, CA) was used to digitize the films. The generalized scanning protocol of McCaw et al.58 was followed and images were analyzed using ImageJ (National Institutes of Health, Bethesda, MD) and/or MATLAB® (MathWorks, Natick, MA).
RESULTS
Air kerma results
Air-kerma calibration coefficients
The five PTW TN34013 chambers exhibited a wide range of air-kerma calibration coefficients for the UW50-M and UW60-M beam qualities (Table 2). The range of coefficients for UW50-M was 16.1% across all chambers and 16.5% across all chambers for UW60-M. Similar trends were observed for other low- and medium-energy x-ray beam qualities however, they are not explicitly reported as only the UW50-M and UW60-M beams were used in data analysis. An average air-kerma calibration coefficient is reported in Table 2 for comparison to the Monte Carlo calculated coefficients, as seen in Table 3. The large discrepancy between the measured and calculated calibration coefficients is due to the lack of complete and accurate knowledge regarding the assembly and dimensions for the PTW TN34013 chamber, in combination with the difficulties in chamber positioning, signal-to-noise level, and overall chamber instability encountered during calibrations.
Table 2.
Measured air-kerma calibration coefficients for five PTW TN34013 chambers.
|
NK (Gy · C−1) |
|||
|---|---|---|---|
| Chamber S/N | UW50-M | UW60-M | Reported uncertainty1 |
| 00104 | 5.082 × 10⁹ | 5.072 × 10⁹ | 1.8% |
| 00117 | 5.059 × 10⁹ | 5.058 × 10⁹ | 1.8% |
| 00118 | 5.052 × 10⁹ | 5.023 × 10⁹ | 1.8% |
| 00119 | 6.021 × 10⁹ | 6.013 × 10⁹ | 1.8% |
| 00157 | 5.399 × 10⁹ | 5.530 × 10⁹ | 3.0% |
| Average across | 5.322 × 10⁹ | 5.339 × 10⁹ | – |
| all chambers | |||
Uncertainty reflects the reported uncertainty at k = 2 from the UWADCL.
Table 3.
Calculated (Ref. 27) and measured air-kerma calibration coefficients for the PTW TN34013.
| Beam | Calculated | Average measured | % |
|---|---|---|---|
| quality | NK (Gy · C−1) | NK (Gy · C−1) | difference |
| UW50-M | 6.041 × 10⁹ | 5.322 × 10⁹ | +11.9 |
| UW60-M | 6.099 × 10⁹ | 5.339 × 10⁹ | +12.5 |
Air-kerma calibration coefficients for the Exradin A20 were measured for a wide range of beam qualities in order to fully characterize the chamber. Table 4 shows the measured air-kerma calibration coefficients for the Exradin A20. Air-kerma calibration coefficients for the Exradin A20 were also calculated for the beam qualities of interest. Table 5 shows a comparison of the measured and calculated air-kerma calibration coefficients. Overall, there was good agreement between the measured and calculated calibration coefficients to within 4%. This agreement demonstrated that the chamber model was accurate and could be used in determination of the conversion factors applied in the proposed dosimetry formalism.
Table 4.
Measured air-kerma calibration coefficients for the Exradin A20 chamber.
| Beam quality | NK (Gy · C−1) | Energy response |
|---|---|---|
| UW50-M | 3.753 × 10⁸ | – |
| UW60-M | 3.739 × 10⁸ | 1.00 |
| UW80-M | 3.755 × 10⁸ | 1.00 |
| UW120-M | 3.710 × 10⁸ | 0.99 |
| UW150-M | 3.675 × 10⁸ | 0.98 |
| UW250-M | 3.576 × 10⁸ | 0.95 |
| UW250-M with BUC | 3.517 × 10⁸ | 0.951 |
| 137Cs with BUC | 3.690 × 10⁸ | – |
UW250-M with BUC normalized to the 137Cs with BUC beam quality.
Table 5.
Calculated and measured air-kerma calibration coefficients for the Exradin A20 chamber.
| Calculated | Measured | % | |
|---|---|---|---|
| Beam quality | NK (Gy · C−1) | NK (Gy · C−1) | difference |
| UW50-M | 3.603 × 10⁸ | 3.753 × 10⁸ | −4.0 |
| UW60-M | 3.601 × 10⁸ | 3.739 × 10⁸ | −3.7 |
| UW250-M with BUC | 3.479 × 10⁸ | 3.517 × 10⁸ | −1.1 |
| 137Cs | 3.618 × 10⁸ | 3.690 × 10⁸ | −2.0 |
Calibration coefficient uncertainty
An uncertainty budget for the calibration coefficients was developed. The uncertainties associated with the measured calibration coefficients are reported by the UWADCL based on the internal quality manual I.3.3.67 The UWADCL reported uncertainty for the air-kerma calibration coefficients for the Exradin A20 was 0.5% at the k = 1 level. The reported uncertainty for the air-kerma calibration coefficients for the PTW TN34013 was as high as 1.5% at the k = 1 level. The increased uncertainty with the PTW TN34013 was due to low SNR and signal drift.
Tables 6, 7 show the uncertainties associated with calculated calibration coefficients for the PTW TN34103 and the Exradin A20, respectively. Specifically, the uncertainty in the chamber geometry was determined by increasing the chamber collecting volume by 2% and observing the effect on the calibration coefficient for the Exradin A20. The uncertainty associated with the chamber geometry for the PTW TN34013 was estimated by combining the uncertainties described in Pike27 in conjunction with the observed effect of a change in chamber collecting volume. The additional uncertainty from Pike27 was included due to the lack of sufficient information for accurate modeling of this chamber, as discussed. The uncertainty associated with the energy spectrum was determined by observing the influence of different spectra on the calibration coefficient. Similarly, the uncertainty associated with the atomic cross sections was determined by observing the effect of a 2% shift in density for the materials used in the each simulation.
Table 6.
Uncertainty budget for air-kerma calibration coefficients for the PTW TN34013 calculated with EGSnrc. Chamber geometry, energy spectrum, and cross-section uncertainties from the work of Pike (Ref. 27).
| Component | Type A % | Type B % |
|---|---|---|
| Chamber geometry | 4.8 | |
| Energy spectrum | 2.0 | |
| Atomic cross sections | 2.6 | |
| Tally statistics | 0.10 | |
| Combined uncertainty | 0.10 | 5.8 |
| Total uncertainty (k = 1) | 5.8 | |
| Expanded uncertainty (k = 2) | 11.6 | |
Table 7.
Uncertainty budget for air-kerma calibration coefficients for the Exradin A20 calculated with EGSnrc.
| Component | Type A % | Type B % |
|---|---|---|
| Chamber geometry | 0.4 | |
| Energy spectrum | 0.04 | |
| Atomic cross sections | 2.6 | |
| Tally statistics | 0.09 | |
| Combined uncertainty | 0.09 | 2.6 |
| Total uncertainty (k = 1) | 2.6 | |
| Expanded uncertainty (k = 2) | 5.3 | |
Beam quality and applicator-specific calibration coefficient results
As discussed, applicator chamber calibration coefficients were developed for the small-volume parallel plate chambers used in air-kerma rate measurements. Following the recommendations of TG-61,11 the HVL for each Axxent surface applicator was determined as part of the beam characterization process in addition to aiding in determination of the calibration coefficients. The Attix FAC and Max4000 electrometer were used for beam quality measurements with the Axxent surface applicators. According to TG-61, HVL measurements should be measured with a source-to-detector distance of 100 cm. However, this measurement geometry is not feasible with the Axxent surface applicators due to a low SNR. A modified measurement geometry was developed with a source to center-of-chamber volume distance of 80 cm, and high-purity aluminum attenuators at 30 cm from the source. HVL1 and second HVL (HVL2) measurements were completed and the homogeneity coefficients (HC) were calculated for each applicator using a single Axxent source for each applicator.
Table 8 shows the measured HVL1, HVL2, and HC for the Axxent surface applicators, as well as the UW50-M and UW60-M standard beam qualities used for interpolation of the calibration coefficients. The HVL1, HVL2, and HC values for the Axxent surface applicators as reported in the manufacturer's operators manual8 are also included in Table 8. Differences in the HVL values determined by the manufacturer and those of this investigation can be attributed to a difference in experimental setup as well as differences in the ionization chamber used during measurements. For reference, the manufacturer listed a source to chamber distance of 30 cm with filter (of unknown purity) placed at 15 cm from the source and used the PTW TN34013 chamber for measurements. Table 9 shows the Axxent surface applicator specific interpolated calibration coefficients for the Exradin A20 and the PTW TN34013. The values displayed for the PTW TN34013 represent a single chamber, though five chambers were studied.
Table 8.
HVL1, HVL2, and HC for the Axxent surface applicators and UW50-M and UW60-M standard beams as determined at the UW, and reported by the manufacturer.
| (a) HVL1, HVL2, and HC for the Axxent surface applicators and UW50-M and UW60-M standard beams. | |||
|---|---|---|---|
| Applicator diameter (mm)/beam quality | HVL1 (mmAl) UW | HVL2 (mmAl) UW | HC UW |
| 10 | 1.46 | 2.19 | 0.67 |
| 20 | 1.63 | 2.45 | 0.67 |
| 35 | 1.60 | 2.46 | 0.65 |
| 50 | 1.64 | 2.43 | 0.68 |
| UW50-M | 1.02 | 1.54 | 0.66 |
| UW60-M | 1.68 | 2.55 | 0.66 |
| (b) HVL1, HVL2, and HC for the Axxent surface applicators as reported in the manufacturer's operators manual (Ref. 8). | |||
| Applicator diameter (mm) |
HVL1 (mmAl) |
HVL2 (mmAl) |
HC |
| 10 | 1.39 | 2.20 | 0.63 |
| 20 | 1.53 | 2.45 | 0.62 |
| 35 | 1.57 | 2.60 | 0.61 |
| 50 | 1.56 | 2.57 | 0.61 |
Table 9.
Axxent surface applicator air-kerma calibration coefficients.
| Chamber | Applicator diameter (mm) | NK(Gy · C−1) |
|---|---|---|
| PTW TN34013 | 10 | 5.486 × 10⁹ |
| 20 | 5.520 × 10⁹ | |
| 35 | 5.514 × 10⁹ | |
| 50 | 5.522 × 10⁹ | |
| Exradin A20 | 10 | 3.744 × 10⁸ |
| 20 | 3.740 × 10⁸ | |
| 35 | 3.741 × 10⁸ | |
| 50 | 3.740 × 10⁸ |
Air-kerma rate results
As discussed, two determinations (a primary measurement and clinically relevant measurement) of air-kerma rate were completed for the Axxent surface applicators. Table 10 shows the measured air-kerma rates at the exit window for each surface applicator as determined with the FAC, Exradin A20 chamber, and PTW TN34013 chamber. The values displayed are an average of at least three trials with two different Axxent sources. Two sources had to be used as the first source was deemed unusable after well chamber testing before the last round of measurements. The nominal strength (U) of the second source (as determined with the HDR1000 Plus well chamber) was normalized to the first source, making a direct comparison of the measured air-kerma rates possible. The Exradin A20 determined air-kerma rates were within 4.1% of the FAC values across all applicators. In comparison, the PTW TN34013 determined air-kerma rates were within 14.8% of the FAC values across all applicators. Overall, the values measured with the Exradin A20 chamber were in better agreement with the FAC determined values. This indicates that the Exradin A20 chamber provides an accurate, clinically relevant measurement of the air kerma rate for the Axxent surface applicators when compared to the primary measurements made with the FAC.
Table 10.
Air-kerma rate for the Axxent surface applicators.
| Applicator diameter (mm) | 10 | 20 | 35 | 50 |
|---|---|---|---|---|
| Chamber measured air-kerma rate (mGy · s−1) | ||||
| FAC | 31.8 | 25.8 | 26.4 | 11.7 |
| Exradin A20 | 30.5 | 26.0 | 26.3 | 11.9 |
| PTW TN34013 | 27.7 | 24.0 | 23.6 | 10.8 |
Axxent air-kerma rate uncertainty
The uncertainties associated with measurements of the air-kerma rate were determined for each chamber used. The values presented in this section are specific to the 35 mm diameter applicator. A single applicator was chosen to demonstrate the parameters involved in the analysis, however the uncertainties included apply to all applicator diameters. The estimated combined uncertainty for the FAC measurements was largely based on the analysis performed by Davis.68 This investigation utilizes the final estimated combined uncertainty for the air-kerma rate determination of a bare Axxent source from Davis68 in addition to parameters specific to the surface applicator measurements (Table 11). The additional parameters considered the uncertainty in the source position in the applicator, alignment of the applicator with respect to the FAC, and the uncertainty in measurement reproducibility. The uncertainty of the source position within the surface applicator was characterized with Monte Carlo simulations by observing the effect of a 0.5 mm shift in the source on the resulting air-kerma rate. The magnitude of the shift was based on quoted tolerances from mechanical drawings provided by the manufacturer.
Table 11.
Uncertainty budget for FAC measurements of air-kerma rate for the Axxent surface applicators.
| Component | Type A % | Type B % |
|---|---|---|
| Air-kerma rate (bare source) | 0.62 | 2.03 |
| Source position in applicator | 0.08 | |
| Alignment | 1.67 | |
| Measurement reproducibility | 2.07 | |
| Combined uncertainty | 2.2 | 2.6 |
| Total uncertainty (k = 1) | 3.4 | |
| Expanded uncertainty (k = 2) | 6.8 | |
The estimated combined uncertainty for the air-kerma rate measurements made with the Exradin A20 and PTW TN34013 chambers are shown in Tables 12, 13. Parameters included in the uncertainty analysis were the UWADCL reported chamber calibration, the UWADCL reported electrometer calibration, the air-density correction, timing, the chamber position with respect to the center of the surface applicator exit window, the source position within the applicator, the effective point of measurement correction, and measurement reproducibility. The uncertainty associated with timing was calculated using the timer error equation described in Attix.28 The chamber position uncertainty describes the associated uncertainty with positioning the chamber in the center of the applicator, flush to the exit window. This value was determined through Monte Carlo simulations of the influence of a 0.4 mm displacement of the chamber position on the exit window on the resulting air-kerma rate. The largest contributor to the uncertainty budget for measurements with the small-volume parallel-plate chambers was in the estimation of the effective point of measurement. For the Exradin A20, this value was based on the influence of a 0.7 mm shift in the effective point of measurement on the resulting air-kerma rate. For the PTW TN34013, this value was based on the influence of a 0.6 mm shift in the effective point of measurement on the resulting air-kerma rate. The uncertainty associated with measurement reproducibility was calculated as the percent standard deviation of the mean. This particular analysis was applied universally to all determinations of repetitive measurement uncertainty.
Table 12.
Uncertainty budget for Exradin A20 measurements of air-kerma rate for the Axxent surface applicators.
| Component | Type A % | Type B % |
|---|---|---|
| Chamber calibration | 0.50 | |
| Electrometer calibration | 0.10 | |
| Air density | 0.10 | 0.10 |
| Timing | 0.56 | |
| Chamber positioning on applicator exit window | 0.50 | |
| Source position | 0.08 | |
| Effective point-of-measurement correction | 1.7 | |
| Measurement reproducibility | 0.05 | |
| Combined uncertainty | 0.6 | 1.9 |
| Total uncertainty (k = 1) | 1.9 | |
| ADCL reported expanded uncertainty (k = 2) | 3.9 | |
Table 13.
Uncertainty budget for PTW TN34013 measurements of air-kerma rate for the Axxent surface applicators.
| Component | Type A % | Type B % |
|---|---|---|
| Chamber calibration | 1.5 | |
| Electrometer calibration | 0.10 | |
| Air density | 0.10 | 0.10 |
| Timing | 0.87 | |
| Chamber positioning on applicator exit window | 0.80 | |
| Source position | 0.08 | |
| Effective point-of-measurement correction | 1.7 | |
| Measurement reproducibility | 0.74 | |
| Combined uncertainty | 0.75 | 2.4 |
| Total uncertainty (k = 1) | 2.5 | |
| ADCL reported expanded uncertainty (k = 2) | 5.1 | |
Conversion factors
As discussed in Sec. 2B, Monte Carlo techniques were applied to calculate the necessary conversion factors for the proposed dosimetry formalism. The associated uncertainties with each factor are discussed in Sec. 4.
Chamber replacement factor
Table 14 shows the chamber replacement factor, for the various source and applicator combinations as calculated with MCNP5. The values calculated for the Axxent surface applicators differ for each applicator due to the influence of changes in the scattered radiation on the chamber response for each applicator. The changes in the scatter component between the various Axxent applicators is due to the varying dimensions and shape of the unique aluminum flattening filter at the apex of each cone, in addition to the change in field diameter between the cones.
Table 14.
Calculated for the Exradin A20 and the Axxent surface applicators. These values were derived from MCNP5 simulations.
| Applicator | |
|---|---|
| diameter (mm) | Pcham |
| 10 | 0.960 |
| 20 | 0.966 |
| 35 | 0.963 |
| 50 | 0.959 |
For comparison, calculations of , as defined in TG-61 were performed in egs_chamber for the Exradin A20 and PTW TN34013 chambers (Table 15) for the Axxent applicators by taking the ratio of the dose to the collecting volume for each chamber positioned flush to the applicator exit window, to the dose to the collecting volume of the chamber placed in air, 1 m from a (10 × 10) cm2 collimated field for the UW50-M beam quality. As discussed, the manufacturer of the Axxent surface applicators recommends that air-kerma rate measurements for the surface applicators be completed with the PTW TN34013 and is assumed to be unity; however the results of the calculated values of for the PTW TN34013 indicate a difference from unity, close to 20% in some cases. Furthermore, the values as calculated per the TG-61 definition were less than unity for the PTW TN34013. This contradicts the predicted effect of an increase in chamber response due to an increase in scattered radiation from the applicator. The large magnitude and counter-intuitive predicted for the PTW TN34013 indicate that consideration of this effect must be taken into account if the chamber is used for measurements with the Axxent surface applicators as described in the original manufacturer's operator's manual. In comparison, the calculated values for the Exradin A20 were less then 2% from unity across all applicators, illustrating the benefit of the end-window geometry of the chamber. It should be noted that the manufacturer revised the operator's manual for the Axxent surface applicators to include output measurements with the Exradin A20 effective from May 2013.
Table 15.
Calculated Pstem, air for the Exradin A20 and PTW TN34013 for the Axxent applicators. These values were derived from egs_chamber simulations.
|
Pstem, air |
||
|---|---|---|
| Diameter (mm) | Exradin A20 | PTW TN34013 |
| 10 | 1.018 | 0.892 |
| 20 | 1.019 | 0.826 |
| 35 | 1.017 | 0.935 |
| 50 | 1.018 | 0.787 |
Dose to water conversion factor
The Axxent dose to water conversion values showed some variation between applicator diameters, as predicted with the change in the shape and size of the aluminum flattening filter. The uncertainties associated with each chamber conversion factor are discussed in Sec. 4.
Dosimetric characterization
Percentage depth dose in water
Percentage depth dose curves were generated for each source and applicator combination. Results were normalized to a depth of 3 mm.2 Figure 8 shows the measured and calculated depth dose curves for each Axxent applicator. A depth of 3 mm was chosen as the normalization point as current treatment prescriptions with these types of surface applicators generally designate 3 mm as the 100% dose point. Overall, the measured and calculated percent depth dose values agreed well. The largest discrepancy of 5% was observed with the 10 mm diameter applicator, at a depth of 5 mm. This discrepancy with the 10 mm diameter applicator is likely the result of it being the smallest diameter applicator available, and measurements with it are more susceptible to alignment errors as compared to the larger diameter applicators.
Figure 8.
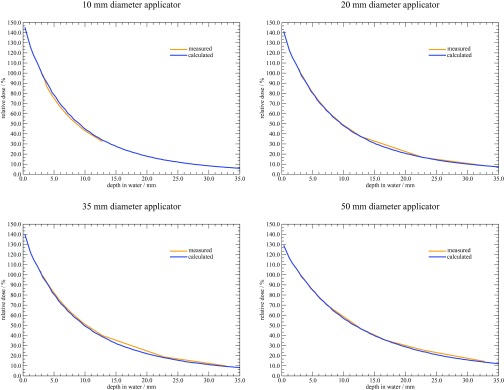
Percentage depth dose curves in water for the Axxent surface applicators.
Relative dose distributions
Figure 9 shows the relative surface profiles (normalized to the maximum center value) as determined with MC simulations, and TLD and film measurements. The error bars on each TLD data point represent the standard deviation across all TLDs used for measurements at that location. A full uncertainty analysis regarding TLD measurements and Monte Carlo parameters is discussed in Sec. 4. A rigorous uncertainty analysis for the film measurements was not performed as it was only used for relative measurements. Overall agreement is observed across all applicator diameters, however a few notable features warrant discussion. The wider penumbra observed with the TLD measured profiles was expected due to volume averaging over the finite detector. In comparison, the MC and film profiles exhibit a sharp fall-off at the edges of each cone.
Figure 9.
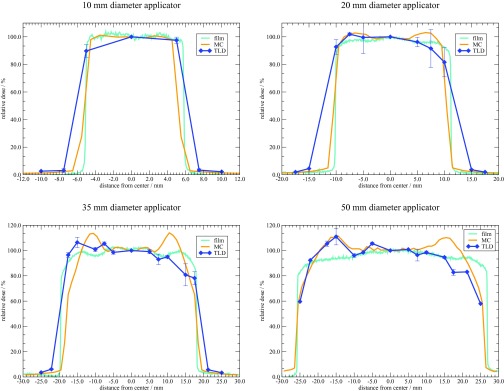
Relative surface dose profiles for the Axxent surface applicators.
A relatively flat region across the field diameter was observed across all applicators. Variations in the field flatness were observed and are likely due to the flattening filter at the apex of each cone as intended by design. This filter is unique to each cone, and the resulting impact of the shape and effect on the profile is unique as well. Specifically, the 35 mm diameter applicator, having the most severe filter, showed a larger variation across the face of the applicator. Furthermore, the Monte Carlo predicted surface dose profile has a larger variation across the face of the applicator. This is likely due to the ideal dimensions and filter geometry used during simulations, as compared to the shape of a real filter which may deviate from the ideal design. Additionally, the TLD measured profiles exhibit a slight anisotropy across the face of each applicator. The manufacturer is aware of this artifact and has observed it during measurements as well. However, the film results did not show this anisotropy, and further investigation is warranted. Future investigations must consider any changes in source construction as the manufacturer is in the process of making a slight modification to the source-centering piece within the water-cooling catheter.
DISCUSSION
Current dosimetry procedures for the Axxent source and surface applicators are described in the manufacturer's operator's manual.8 A modified version of TG-61 is described in the manual, where air-kerma rate measurements are corrected to obtain a dose to water at the surface. This investigation performed air-kerma rate measurements with several different PTW TN34013 chambers, in addition to the Exradin A20. Values presented for measurements with the PTW TN34013 were obtained with sufficient buildup (as described in Sec. 2A3). Values presented for all measurements with the Exradin A20 were corrected for the effective POM to account for the extended entrance window to collecting electrode distance. A correction for the effective POM for measurements with the PTW TN34013 was not applied to values calculated using TG-61 as originally proposed by the manufacturer. All values in the following tables represent an average of at least three measurements of the air-kerma rate used in determination of the dose to water for a set of 30 s irradiations. The uncertainties associated with the dose to water determination for the Axxent applicators are discussed below.
Table 16 presents the dose to water at the surface as determined with the TG-61 formalism for the Exradin A20 and the PTW TN34013. The influence of the manufacturer's assumption of as unity (values in italics) for the PTW TN34013 is illustrated by comparing the dose to water values with = 1 or equal to a calculated value. The values for for each ionization chamber were calculated as discussed previously in Sec. 3B1. The average percent difference between the TG-61 calculated values for the PTW TN34013 ( = 1.00) and the Exradin A20 ( = 1.02) was 12%. It is clear that the uncertainty in modeling the PTW TN34013 leads to a counterintuitive decrease in dose to water with the Monte Carlo calculated . With this in mind, it is unclear what value of is appropriate for the PTW TN34013, and users should take this into consideration when using the PTW TN34013 for measurements with the Axxent surface applicators.
Table 16.
Comparison of dose to water at the surface determined with TG-61.
| Diameter | Dwater | |||||
|---|---|---|---|---|---|---|
| (mm) | Chamber | (cGy · s−1) | Bw | (cGy) | ||
| 10 | PTW TN34013 | 2.77 | 1.00 | 1.05 | 1.0170 | 88.7 |
| PTW TN34013 | 2.77 | 0.892 | 1.05 | 1.0170 | 79.2 | |
| Exradin A20 | 3.05 | 1.02 | 1.05 | 1.0170 | 99.7 | |
| 20 | PTW TN34013 | 2.40 | 1.00 | 1.09 | 1.0174 | 79.8 |
| PTW TN34013 | 2.40 | 0.826 | 1.09 | 1.0174 | 66.0 | |
| Exradin A20 | 2.60 | 1.02 | 1.09 | 1.0174 | 88.2 | |
| 35 | PTW TN34013 | 2.36 | 1.00 | 1.10 | 1.0174 | 79.2 |
| PTW TN34013 | 2.36 | 0.935 | 1.10 | 1.0174 | 74.1 | |
| Exradin A20 | 2.63 | 1.02 | 1.10 | 1.0174 | 90.1 | |
| 50 | PTW TN34013 | 1.08 | 1.00 | 1.13 | 1.0174 | 37.2 |
| PTW TN34013 | 1.08 | 0.787 | 1.13 | 1.0174 | 29.3 | |
| Exradin A20 | 1.19 | 1.02 | 1.13 | 1.0174 | 41.9 |
This investigation establishes a dosimetry formalism specific to surface applicators, however it is important to observe how the existing dosimetry method compares with the proposed formalism. Table 17 describes the dose to water at the surface as calculated using the proposed dosimetry formalism for the Exradin A20. Those values are compared to the TG-61 calculated values in Table 18. On average, the proposed formalism predicts a 5.7% lower dose to water than the TG-61 values. This difference is likely due to the proposed formalism explicitly accounting for the perturbation of the field by the chamber and the source and field diameter-specific dose to water conversion factors. The correction factors outlined in TG-61 were not explicitly designed for treatments with surface applicators such as those available from Xoft Inc (an iCAD company), and as such, the specialized approach of the proposed formalism accounts for the specific treatment geometry wherein the framework of TG-61cannot be applied. It must be noted that the absolute values in Table 18 are not for treatment planning purposes. It is expected that a given dose to water determination will vary according to the source output, however the trends observed would remain consistent.
Table 17.
Proposed formalism dose to water at the surface as determined with the A20.
| Diameter | Dwater | |||
|---|---|---|---|---|
| (mm) | (cGy · s−1) | (cGy) | ||
| 10 | 3.05 | 0.960 | 1.073 | 94.3 |
| 20 | 2.60 | 0.966 | 1.103 | 83.1 |
| 35 | 2.63 | 0.963 | 1.128 | 85.7 |
| 50 | 1.19 | 0.959 | 1.155 | 39.5 |
Table 18.
Comparison of dose to water at the surface determined with TG-61 and the proposed formalism for the Exradin A20. The values calculated with the TG-61 formalism assumed a of 1.02 for the Exradin A20. The final column presents the percent difference in the dose to water as determined with each formalism.
| Diameter | Dwater | % | ||
|---|---|---|---|---|
| (mm) | Chamber | Formalism | (cGy) | difference |
| 10 | Exradin A20 | Proposed | 94.3 | −5.7 |
| Exradin A20 | TG-61 | 99.7 | ||
| 20 | Exradin A20 | Proposed | 83.1 | −6.1 |
| Exradin A20 | TG-61 | 88.2 | ||
| 35 | Exradin A20 | Proposed | 85.7 | −5.1 |
| Exradin A20 | TG-61 | 90.1 | ||
| 50 | Exradin A20 | Proposed | 39.5 | −6.1 |
| Exradin A20 | TG-61 | 41.9 |
The percentage depth dose in water as calculated with Monte Carlo simulations, measured with the Exradin A20 in a water tank, and determined using the proposed formalism for the 20 mm diameter applicator is shown in Fig. 10. The Monte Carlo and measured values are those that were discussed previously in Sec. 3C. The proposed formalism values were obtained by using the measured air-kerma rate and applying the Pcham and conversion factors as previously defined. All values were normalized to a depth of 3 mm, and excellent agreement to within 1% across all depths and methods investigated was observed.
Figure 10.

Comparison of percent depth dose in water for the 20 mm diameter Axxent surface applicator.
Perhaps the most important comparison is presented in Table 19 where the dose to water at the surface as determined with TLD measurements (Dw, TLD) is compared with that determined using the proposed formalism (Dw, chamber), from measurements with the Exradin A20. The proposed formalism dose to water agrees to within 3.4% of the TLD measured dose to water across all applicators. This is within the expected uncertainties and validates the proposed dosimetry formalism.
Table 19.
Dose to water at the surface for the Axxent surface applicators as measured with the Exradin A20 and TLDs.
| Diameter (mm) | Dw, TLD cGy | Dw, chamber cGy | % difference |
|---|---|---|---|
| 10 | 172.0 | 178.7 | −3.7 |
| 20 | 159.7 | 157.7 | +1.2 |
| 35 | 160.7 | 162.0 | −0.81 |
| 50 | 75.7 | 75.7 | −0.08 |
Axxent-specific estimated uncertainty for dose to water determination
The estimated uncertainty budget for the dose to water determination for the Axxent surface applicators is shown in Table 20. The uncertainties associated with the calculated conversion factors (Pcham and ) were added in quadrature with the uncertainty in the air-kerma rate determination as discussed in Sec. 3 (Table 12). The Monte Carlo components used to estimate the uncertainties associated with the conversion factors included the simulation geometry, energy spectrum, atomic cross sections, and tally statistics. The uncertainty in the simulation geometry was estimated by observing the influence of a perturbation of the tally cell volume and shape in water. The tally region for the conversion factor was a cylinder of radius = 0.2616 cm and a height = 0.01 cm. This nominal value was perturbed by changing the height to 0.05 cm and the radius to 0.2193 cm (separately) and the resulting effect on the factor was quantified. The uncertainty in the energy spectrum and cross section was calculated as discussed in Sec. 3A2. In accordance with the literature, the estimated uncertainty in the dose to water determination for the Axxent surface applicators is acceptable for clinical implementation.69
Table 20.
Estimated uncertainty in the dose to water determination of the proposed formalism for the Axxent surface applicators.
| Component | Type A % | Type B % |
|---|---|---|
| Monte Carlo uncertainties | ||
| Geometry | 0.65 | |
| Energy spectrum | 0.25 | |
| Atomic cross-sections | 0.13 | |
| Tally statistics | 0.23 | |
| Combined uncertainty | 0.81 | 3.1 |
| Type A and Type B combined | 0.75 | |
| Uncertainty in air-kerma rate | 1.94 | |
| Total uncertainty (k = 1) | 2.1 | |
| Expanded uncertainty (k = 2) | 4.2 | |
A separate analysis of the uncertainties associated with the absolute dose to water determination from the TLD measurements was completed. The estimated uncertainty budget for TLD measurements is shown Table 21. The parameters associated with the TLD readings from measurements with the applicators included TLD reproducibility, positioning, irradiation time, PMT linearity, reader stability, and the source position within the applicator. The TLD reproducibility was estimated as the percent standard deviation of the mean of all TLDs used to determine the dose in the center of the applicator (corresponding to a location in the PMMA phantom of r = 0 cm and ϑ = 0o). The uncertainty of the TLD position within each well of the phantom was estimated as a triangular distribution based on the machining tolerance of the mill used during fabrication. The TLD irradiation time is based on the timer error determined with the Attix formalism. The PMT linearity correction uncertainty accounts for the possible nonlinear response of the PMT in the reader and is based on previous work at the UWMRRC by Bartol and DeWerd.70 Similarly, the reader stability has been characterized and assigned a value in the University of Wisconsin Radiation Calibration Laboratory (UWRCL) Quality Manual.71 The uncertainty of the source position within the applicator was applied in the same manner as described previously. To account for the source ramp-up and ramp-down time, the uncertainty of the TLD irradiation time was estimated from the standard deviation across the TLD measured doses. This estimation shows the potential variation of the source recipe used during each experimental trial. It should be noted that this assumption is correlated with the individual TLD response and advanced statistical analysis beyond the scope of this work would be needed to unfold all of the correlated uncertainties within this investigation.
Table 21.
Estimated uncertainty for the TLD measured dose to water for the Axxent surface applicators.
| Component | Type A % | Type B % |
|---|---|---|
| R-corrected TLD reading | ||
| TLD reproducibility | 0.78 | |
| TLD positioning | 0.02 | |
| TLD irradiation time | 1.6 | |
| PMT linearity correction | 0.1 | |
| Reader stability | 0.2 | |
| N-calibration coefficient (measured) | ||
| TLD reproducibility | 0.34 | |
| Air-kerma rate determination | 0.8 | |
| TLD positioning | 0.0 | |
| TLD irradiation time | 0.01 | |
| Field uniformity | 0.1 | |
| PMT linearity correction | 0.1 | |
| Reader stability | 0.2 | |
| Phantom correction (192Ir component) | ||
| MC statistical uncertainty | 0.23 | |
| Photon spectrum | 0.25 | |
| Cross section | 0.13 | |
| Geometry | 0.65 | |
| Phantom correction (60Co component) | ||
| MC statistical uncertainty | 0.07 | |
| Photon spectrum | 0.03 | |
| Cross section | 0.01 | |
| Energy dependence correction | 0.99 | 0.97 |
| Combined uncertainty | 2.08 | 1.48 |
| Total uncertainty (k = 1) | 2.6 | |
| Expanded uncertainty (k = 2) | 5.1 | |
The next component of the TLD uncertainties stems from the calibration coefficient, which provides a conversion from the light output in nC to a dose. The parameters included for this component include the TLD reproducibility, the air-kerma rate determination, the TLD positioning and irradiation time, the field uniformity, the PMT linearity, and reader stability. The TLD reproducibility was analyzed as the percent standard deviation of the TLDs used for calibration. The uncertainty of the air-kerma rate determination describes the methods used in measuring the air-kerma rate from the 60Co source at the UWADCL and is based on previous work at the UWMRRC.57 The TLD positioning, irradiation time, PMT linearity and reader stability uncertainties were analyzed with the same values as discussed above. The field uniformity uncertainty is based on the UWRCL Quality Manual.67
The uncertainties associated with the Monte Carlo calculated dose to water conversion factor included separate simulations with the Axxent source and with 60Co as described in Sec. 3C. For simulations with the Axxent source and applicators, the uncertainties associated with the dose to water conversion factor included the reported simulation statistics, photon spectrum, cross sections, and the simulation geometry. The uncertainties associated with the Axxent source spectrum and atomic cross sections were based on the work of Pike, and included variations in the source spectrum and the effect of a 2% shift in the cross sections on the calculated collision kerma (see Sec. 3A2).27 The influence of the simulation geometry on the calculated dose to TLD was estimated by observing the effect of an increase in the thickness of the aluminum flattening filter based on the quoted tolerances. For simulations using 60Co, the values for the photon spectrum and cross section uncertainties were based on previous work including Pike27 and Kennedy et al.57 The uncertainty associated with the energy dependence correction factor for the Axxent source was based on the work of Pike27 and Raffi.47
CONCLUSIONS
This investigation has produced a clinically relevant and practical method of measuring the dose from a variety of surface applicators used with high dose-rate brachytherapy sources using a small-volume end-window parallel plate ionization chamber. The methods and results utilized with HDR 192Ir sources and applicators can be found in Part II of this paper. The proposed dosimetry formalism focuses on a measurement of the air-kerma rate at the exit window of the surface applicator which is then converted to a dose to water via conversion factors. The conversion factors introduced in the proposed formalism were calculated using Monte Carlo simulations and account for the perturbation of the radiation field due the presence of the chamber and the conversion of air kerma to a dose to water at a given depth of interest. TLDs, film, and Monte Carlo simulations were used characterize the relative dose distributions including surface dose profiles, dose distributions and percent depth dose curves in water.
ACKNOWLEDGMENTS
The authors would like to thank iCAD for supplying materials for this research. Thanks also to UWRCL and UWADCL customers, whose calibrations help support ongoing research at the UWMRRC. This work was supported in part by Xoft Inc., an iCAD company.
References
- American Cancer Society, Cancer Facts & Figures 2012 (American Cancer Society, Atlanta, 2012). [Google Scholar]
- Ouhib Z. and Kasper M., Clinical Guide to Surface Treatment of Skin Cancer with Brachytherapy (Nucletron, Veenendaal, Netherlands, 2010). [Google Scholar]
- Granero D., Pérez-Calatayud J., Gimeno J., Ballester F., Casal E., Crispín V., and van der Laarse R., “Design and evaluation of a HDR skin applicator with flattening filter,” Med. Phys. 35, 495–503 (2008). 10.1118/1.2825622 [DOI] [PubMed] [Google Scholar]
- Pérez-Calatayud J., Granero D., Ballester F., Puchades V., Casal E., Soriano A., and Crispín V., “A dosimetric study of Leipzig applicators,” Int. J. Radiat. Oncol., Biol., Phys. 62, 579–584 (2005). 10.1016/j.ijrobp.2005.02.028 [DOI] [PubMed] [Google Scholar]
- Evans M., Yassa M., Podgorsak E., Roman T., Schereiner L., and Souhami L., “Surface applicators for high dose rate brachytherapy in AIDS-related Kaposi's sarcoma,” Int. J. Radiat. Oncol., Biol., Phys. 39, 769–774 (1997). 10.1016/S0360-3016(97)00360-X [DOI] [PubMed] [Google Scholar]
- In this paper, certain commercially available products are referred to by name. These references are for informational purposes only and imply neither endorsement by the ADCL nor that these products are the best or only products available for the purpose.
- Rivard M. J., Davis S. D., DeWerd L. A., Rusch T. W., and Axelrod S., “Calculated and measured brachytherapy dosimetry parameters in water for the Xoft Axxent X-Ray Source: An electronic brachytherapy source,” Med. Phys. 33, 4020–4032 (2006). 10.1118/1.2357021 [DOI] [PubMed] [Google Scholar]
- Xoft Inc., Axxent Electronic Brachytherapy System Operator Manual, Appendix J (Xoft Inc., San Jose, CA, 2009). [Google Scholar]
- Rivard M. J., Coursey B. M., DeWerd L. A., Hanson W. F., Huq M. S., Ibbott G. S., Mitch M. G., Nath R., and Williamson J. F., “Update of AAPM Task Group No. 43 report: A revised AAPM protocol for brachytherapy dose calculations,” Med. Phys. 31, 633–674 (2004). 10.1118/1.1646040 [DOI] [PubMed] [Google Scholar]
- Nath R., Anderson L. L., Luxton G., Weaver K. A., Williamson J. F., and Megooni A. S., “Dosimetry of interstitial brachytherapy sources: Recommendations of the AAPM Radiation Therapy Committee Task Group No. 43,” Med. Phys. 22, 209–234 (1995). 10.1118/1.597458 [DOI] [PubMed] [Google Scholar]
- Ma C.-M., Coffey C. W., DeWerd L. A., Liu C., Nath R., Seltzer S. M., and Seuntjens J. P., “AAPM protocol for 40–300 kV x-ray beam dosimetry in radiotherapy and radiobiology,” Med. Phys. 28, 868–893 (2001). 10.1118/1.1374247 [DOI] [PubMed] [Google Scholar]
- Grosswendt B., “Dependence of the photon backscatter factor for water on source-to-phantom distance and irradiation field size,” Phys. Med. Biol. 35, 1233–1245 (1990). 10.1088/0031-9155/35/9/004 [DOI] [Google Scholar]
- Grosswendt B., “Dependence of the photon backscatter factor for water on irradiation field size and source-to-phantom distance between 1.5 and 10 cm,” Phys. Med. Biol. 38, 305–310 (1993). 10.1088/0031-9155/38/2/007 [DOI] [Google Scholar]
- Klevenhagen S., “Experimentally determined backscatter factors for x-rays generated at voltages between 16 and 140 kV,” Phys. Med. Biol. 34, 1871–1882 (1989). 10.1088/0031-9155/34/12/010 [DOI] [Google Scholar]
- Knight R. T. and Nahum A. E., “Depth and field-size dependence of ratios of mass-energy absorption coefficient, water-to-air, for kV X-ray dosimetry,” in Proceedings of the IAEA International Symposium on Measurement Assurance Dosimetry (IAEA, Vienna, 1994), pp. 361–370.
- Seuntjens J. P., Kawrakow I., Borg J., Hobeila F., and Rogers D. W. O., “Calculated and measured air-kerma response of ionization chambers in low- and medium-energy photon beams,” in Recent Developments in Accurate Radiation Dosimetry, AAPM Symposium Proceedings No. 13, edited by Seuntjens J. P. and Mobit P. N. (Medical Physics Publishing, Madison, WI, 2002), pp. 69–84.
- Klevenhagen S., Aukett R., Harrison R., Moretti C., Nahum A., and Rosser K., “The IPEMB code of practice for the determination of absorbed dose for x-rays below 300 kV generating potential (0.035 mm Al - 4 mm Cu); 10–300 kV generating potential,” Phys. Med. Biol. 41, 2605–2625 (1996). 10.1088/0031-9155/41/12/002 [DOI] [PubMed] [Google Scholar]
- Ma C. M. and Seuntjens J. P., “Mass energy-absorption coefficient and backscatter factor ratios for kilovoltage x-ray beams,” Phys. Med. Biol. 44, 131–143 (1999). 10.1088/0031-9155/44/1/011 [DOI] [PubMed] [Google Scholar]
- White M. C., “Photoatomic data library MCPLIB04: A new photoatomic library based on data from ENDF/B-VI Release 8,” Memorandum LA-UR-03-1019, Los Alamos National Laboratory, Los Alamos, NM, 2003.
- X-5 Monte Carlo Team, MCNP — A General Monte Carlo N-Particle Transport Code, Version 5, Report LA-UR-03-1987, Los Alamos National Laboratory, Los Alamos, NM, 2005.
- Cullen D., Hubbell J., and Kissel L., “EPDL97: The Evaluated Photon Data Library,” Report UCRL-50400 Vol. 6 Rev. 5, Lawrence Livermore National Laboratory, 1997.
- Adams K. J., “Electron upgrade for MCNP4B,” Los Alamos National Laboratory Memorandum X-5-RN(U)-00-14, 2000.
- Adams K. J., “Electron Upgrade for MCNP4B,” Memorandum LA-UR-00-3581, Los Alamos National Laboratory, Los Alamos, NM, 2000.
- Kawrakow I. and Rogers D. W. O., “The EGSnrc code system: Monte Carlo simulation of electron and photon transport,” Technical Report PIRS-701, National Research Council of Canada, Ottawa, Canada, 2006.
- Davis S., “Monte Carlo 101,” Power Point Presentation, University of Wisconsin MRRC Research Meeting, 2009.
- PTW-Freiburg, Ionization Chamber Type 34013 (PTW-Freiburg, Freiburg, Germany, 1999). [Google Scholar]
- Pike T. L., “A dosimetric Characterization of an electronic brachytherapy source in terms of absorbed dose to water,” Ph.D. dissertation, University of Wisconsin-Madison, 2012. [Google Scholar]
- Attix F. H., Introduction to Radiological Physics and Radiation Dosimetry (John Wiley and Sons, Inc., New York, 1986). [Google Scholar]
- Snow J., Micka J., and DeWerd L., “Microionization chamber air-kerma calibration coefficients as a function of photon energy for x-ray spectra in the range of 20 to 250 kVp relative to 60Co,” Med. Phys. 40, 041711 (5pp.) (2013). 10.1118/1.4794491 [DOI] [PubMed] [Google Scholar]
- Coletti J. G., Pearson D. W., and DeWerd L. A., “Mammography exposure standard: Design and characterization of free-air ionization chamber,” Rev. Sci. Instrum. 66, 2574–2577 (1995). 10.1063/1.1145590 [DOI] [Google Scholar]
- Rong Y. and Welsh J. S., “Surface applicator calibration and commissioning of an electronic brachytherapy system for nonmelanoma skin cancer and treatment,” Med. Phys. 37, 5509–5517 (2010). 10.1118/1.3489379 [DOI] [PubMed] [Google Scholar]
- Jeraj R., Keall P. J., and Ostwald P. M., “Comparisons between MCNP, EGS4 and experiment for clinical electron beams,” Phys. Med. Biol. 44, 705–717 (1999). 10.1088/0031-9155/44/3/013 [DOI] [PubMed] [Google Scholar]
- Ibbott G., Barnes J., Hall R., and Hendee W. R., “Stem corrections for ionization chambers,” Med. Phys. 2(6), 328–330 (1975). 10.1118/1.594202 [DOI] [PubMed] [Google Scholar]
- Glecker M., Valentine J., and Silberstein E., “Calculating lens dose and surface dose rates from Sr-90 opthalmic applicators using Monte Carlo modeling,” Med. Phys. 25(1), 29–36 (1998). 10.1118/1.598434 [DOI] [PubMed] [Google Scholar]
- Angelopoulos A., Baras P., Sakelliou L., Karaiskos P., and Sandilos P., “Monte Carlo dosimetry of a new 192Ir high dose rate brachytherapy source,” Med. Phys. 27(11), 2521–2527 (2000). 10.1118/1.1315316 [DOI] [PubMed] [Google Scholar]
- Sloboda R. S. and Menon G. V., “Experimental determination of the anisotropy function and anisotropy factor for model 6711 I-125 seeds,” Med. Phys. 27, 1789–1799 (2000). 10.1118/1.1287285 [DOI] [PubMed] [Google Scholar]
- Meigooni A. S., Sowards K., and Soldano M., “Dosimetric characteristics of the InterSource 103Pd brachytherapy source,” Med. Phys. 27, 1093–1100 (2000). 10.1118/1.598991 [DOI] [PubMed] [Google Scholar]
- Meigooni A. S., Meli J. A., and Nath R., “A comparison of solid phantoms with water for dosimetry of 125I brachytherapy sources,” Med. Phys. 15, 695–701 (1988). 10.1118/1.596182 [DOI] [PubMed] [Google Scholar]
- Dolan J., Li Z., and Williamson J. F., “Monte Carlo and experimental dosimetry of an 125I brachytherapy seed,” Med. Phys. 33, 4675–4684 (2006). 10.1118/1.2388158 [DOI] [PubMed] [Google Scholar]
- Meigooni A., Awan S., Thompson N., and Dini S., “Updated Solid WaterTM to water conversion factors for 125I and 103Pd brachytherapy sources,” Med. Phys. 33, 3988–3992 (2006). 10.1118/1.2357018 [DOI] [PubMed] [Google Scholar]
- Cox F. M., Lucas A. C., and Kaspar B. M., “The reusability of solid thermoluminescent dosimeters and its relation to the maintenance of TL standards,” Health Phys. 30, 135–138 (1976). 10.1097/00004032-197601000-00015 [DOI] [PubMed] [Google Scholar]
- Srinivasan M. and DeWerd L., “Effect of plastic deformation on the thermoluminescence of LiF(TLD-100) single crystals,” J. Phys. D: Appl. Phys. Med. Biol. 6, 2142–2143 (1973). 10.1088/0022-3727/6/17/322 [DOI] [Google Scholar]
- Nunn A. A., Davis S. D., Micka J. A., and DeWerd L. A., “LiF:Mg,Ti TLD response as a function of photon energy for moderately filtered x-ray spectra in the range of 20 to 250 kVp relative to 60Co,” Med. Phys. 35, 1859–1869 (2008). 10.1118/1.2898137 [DOI] [PubMed] [Google Scholar]
- Horowitz Y. and Olko P., “The effects of ionisation density on the thermoluminescence response (efficiency) of LiF:Mg,Ti and LiF:Mg,Cu,P,” Radiat. Prot. Dosim. 109(4), 331–348 (2004). 10.1093/rpd/nch310 [DOI] [PubMed] [Google Scholar]
- Chiu-Tsao S., Duckworth T., Hsiung C., Li Z., Williamson J., Patel N., and Harrison L., “Thermoluminescent dosimetry of the SourceTech Medical model STM1251 125I seed,” Med. Phys. 30, 1732–1735 (2003). 10.1118/1.1577251 [DOI] [PubMed] [Google Scholar]
- Williamson J. F. and Rivard M. J., “Quantitative dosimetry methods for brachytherapy, brachytherapy physics,” Proceedings of the Joint AAPM/American Brachytherapy Society Summer School (AAPM, College Park, MD, 2006).
- Raffi J. A., “Limitations of current dosimetry for intracavitary accelerated partial breast irradiation with high dose rate 192Ir and electronic brachytherapy sources,” Ph.D. dissertation, University of Wisconsin-Madison, 2010. [Google Scholar]
- DeWerd L., Bartol L., and Davis S., “Thermoluminescence dosimeters,” Proceedings of the AAPM Summer School (AAPM, College Park, MD, 2009), pp. 815–840.
- MacPherson M. S. and Battista J. J., “Dose distributions and dose rate constants for new ytterbium-169 brachytherapy seeds,” Med. Phys. 22, 89–96 (1995). 10.1118/1.597597 [DOI] [PubMed] [Google Scholar]
- Patel N. S., Chiu-Tsao S.-T., Williamson J. F., Fan P., Duckworth T., Shasha D., and Harrison L. B., “Thermoluminescent dosimetry of the Symmetra™125I model I25.S06 interstitial brachytherapy seed,” Med. Phys. 28, 1761–1769 (2001). 10.1118/1.1388218 [DOI] [PubMed] [Google Scholar]
- Anagnostopoulos G., Baltas D., Karaiskos P., Sandilos P., Papagiannis P., and Sakelliou L., “Thermoluminescent dosimetry of the selectSeed 125I interstitial brachytherapy seed,” Med. Phys. 29, 709–716 (2002). 10.1118/1.1469631 [DOI] [PubMed] [Google Scholar]
- Mobit P. and Badragan I., “Response of LiF-TLD micro-rods around 125I radioactive seed,” Phys. Med. Biol. 49, 3161–3170 (2004). 10.1088/0031-9155/49/14/010 [DOI] [PubMed] [Google Scholar]
- Lymperopoulou G., Papagiannis P., Sakelliou L., Karaiskos P., Sandilos P., Przykutta A., and Baltas D., “Monte Carlo and thermoluminescence dosimetry of the new IsoSeed model I25.S17 125I interstitial brachytherapy seed,” Med. Phys. 32, 3313–3317 (2005). 10.1118/1.2089588 [DOI] [PubMed] [Google Scholar]
- Davis S. D., Ross C. K., Mobit P. N., Van der Zwan L., Chase W. J., and Shortt K. R., “The response of LiF thermoluminescence dosemeters to photon beams in the energy range from 30 kV x rays to 60Co gamma rays,” Radiat. Prot. Dosim. 106, 33–43 (2003). 10.1093/oxfordjournals.rpd.a006332 [DOI] [PubMed] [Google Scholar]
- Rasmussen B. E., Davis S. D., Micka J. A., and DeWerd L. A., “Response of LiF:Mg,Ti thermoluminescent dosimeters to low-energy photons,” (abstract) Med. Phys. 35, 2792 (2008). 10.1118/1.2962044 [DOI] [Google Scholar]
- Mora G. M., Maio A., and Rogers D. W. O., “Monte Carlo simulation of a typical 60Co therapy source,” Med. Phys. 26(11), 2494–2502 (1999). 10.1118/1.598770 [DOI] [PubMed] [Google Scholar]
- Kennedy R., Davis S., Micka J., and DeWerd L., “Experimental and Monte Carlo determination of the TG-43 dosimetric parameters for the model 9011 THINSeedTM brachytherapy source,” Med. Phys. 37(4), 1681–1688 (2010). 10.1118/1.3360899 [DOI] [PubMed] [Google Scholar]
- McCaw T. J., Micka J. A., and DeWerd L. A., “Characterizing the marker-dye correction for Gafchromic® EBT2 film: A comparison of three analysis methods,” Med. Phys. 38, 5771–5777 (2011). 10.1118/1.3639997 [DOI] [PubMed] [Google Scholar]
- Devic S., Seuntjens J., Sham E., Podgorsak E. B., Schmidtlein C. R., Kirov A. S., and Soares C. G., “Precise radiochromic film dosimetry using a flat-bed document scanner,” Med. Phys. 32, 2245–2253 (2005). 10.1118/1.1929253 [DOI] [PubMed] [Google Scholar]
- Devic S., Seuntjens J., Hegyi G., Podgorsak E., Soares C. G., Kirov A. S., Ali I., Williamson J. F., and Elizondo A., “Dosimetric properties of improved GafChromic films for seven different digitizers,” Med. Phys. 31, 2392–2401 (2004). 10.1118/1.1776691 [DOI] [PubMed] [Google Scholar]
- Devic S., Seuntjens J., Abdel-Rahman W., Evans M., Olivares M., Podgorsak E. B., Vuong T., and Soares C. G., “Accurate skin dose measurements using radiochromic film in clinical applications,” Med. Phys. 33, 1116–1124 (2006). 10.1118/1.2179169 [DOI] [PubMed] [Google Scholar]
- Devic S., Aldelaijan S., Mohammed H., Tomic N., Liang L., Deblois F., and Seuntjens J., “Absorption spectra time evolution of EBT-2 model GAFCHROMIC™ film,” Med. Phys. 37, 2207–2214 (2010). 10.1118/1.3378675 [DOI] [PubMed] [Google Scholar]
- Devic S., Tomic N., Aldelaijan S., DeBlois F., Seuntjens J., Chan M. F., and Lewis D., “Linearization of dose–response curve of the radiochromic film dosimetry system,” Med. Phys. 39(8), 4850–4857 (2012). 10.1118/1.4736800 [DOI] [PMC free article] [PubMed] [Google Scholar]
- Arjomandy B., Tailor R., Sahoo N., Gillin M., Prado K., and Vicic M., “Energy dependence and dose response of GafChromic EBT2 film over a wide range of photon, electron, and proton beam energies,” Med. Phys. 37, 1942–1947 (2010). 10.1118/1.3373523 [DOI] [PubMed] [Google Scholar]
- Richley L., John A. C., Coomber H., and Fletcher S., “Evaluation and optimization of the new EBT2 radiochromic film dosimetry system for patient dose verification in radiotherapy,” Phys. Med. Biol. 55, 2601–2617 (2010). 10.1088/0031-9155/55/9/012 [DOI] [PubMed] [Google Scholar]
- Niroomand-Rad A., Blackwell C. R., Coursey B. M., Gall K. P., Galvin J. M., McLaughlin W. L., Meigooni A. S., Nath R., Rodgers J. E., and Soares C. G., “Radiochromic film dosimetry: Recommendations of AAPM Radiation Therapy Committee Task Group 55,” Med. Phys. 25, 2093–2115 (1998). 10.1118/1.598407 [DOI] [PubMed] [Google Scholar]
- UWRCL, UW-RCL Quality Manual I.3.3 Uncertainty Tables: Air Kerma Therapy (UWADCL, Madison, WI, 2008). [Google Scholar]
- Davis S. D., “Air-kerma strength determination of a miniature x-ray source for brachytherapy applications,” Ph.D. dissertation, University of Wisconsin–Madison, 2009. [Google Scholar]
- Nag S., Beyer D., Friedland J., Grimm P., and Nath R., “American brachytherapy society (ABS) recommendations for transperineal permanent brachytherapy of prostate cancer,” Int. J. Radiat. Oncol., Biol., Phys. 44(4), 789–799 (1999). 10.1016/S0360-3016(99)00069-3 [DOI] [PubMed] [Google Scholar]
- Bartol L. and DeWerd L., “Characterization of thermoluminescent dosimeter reader precision and artifacts,” (abstract) Med. Phys. 35, 2796 (2008). 10.1118/1.2962059 [DOI] [Google Scholar]
- UWRCL, UW-RCL Quality Manual I.5.1 Uncertainty Tables: Diagnostic TLD (UWADCL, Madison, WI, 2008). [Google Scholar]